
|
|||||
|
 | |
| |
| |
| |
| |
| |
|
Gene: EMILIN1 |
Gene summary for EMILIN1 |
| Gene information | Species | Human | Gene symbol | EMILIN1 | Gene ID | 11117 |
| Gene name | elastin microfibril interfacer 1 | |
| Gene Alias | EMI | |
| Cytomap | 2p23.3 | |
| Gene Type | protein-coding | GO ID | GO:0000165 | UniProtAcc | Q9Y6C2 |
Top |
Malignant transformation analysis |
| Identification of the aberrant gene expression in precancerous and cancerous lesions by comparing the gene expression of stem-like cells in diseased tissues with normal stem cells |
| Entrez ID | Symbol | Replicates | Species | Organ | Tissue | Adj P-value | Log2FC | Malignancy |
| 11117 | EMILIN1 | AEH-subject1 | Human | Endometrium | AEH | 7.92e-24 | -4.80e-01 | -0.3059 |
| 11117 | EMILIN1 | AEH-subject2 | Human | Endometrium | AEH | 5.67e-27 | -4.94e-01 | -0.2525 |
| 11117 | EMILIN1 | AEH-subject3 | Human | Endometrium | AEH | 6.19e-21 | -4.66e-01 | -0.2576 |
| 11117 | EMILIN1 | AEH-subject4 | Human | Endometrium | AEH | 3.20e-10 | -3.86e-01 | -0.2657 |
| 11117 | EMILIN1 | AEH-subject5 | Human | Endometrium | AEH | 3.14e-30 | -5.00e-01 | -0.2953 |
| 11117 | EMILIN1 | EEC-subject1 | Human | Endometrium | EEC | 3.93e-21 | -4.90e-01 | -0.2682 |
| 11117 | EMILIN1 | EEC-subject2 | Human | Endometrium | EEC | 8.22e-27 | -4.98e-01 | -0.2607 |
| 11117 | EMILIN1 | EEC-subject3 | Human | Endometrium | EEC | 2.32e-33 | -4.88e-01 | -0.2525 |
| 11117 | EMILIN1 | EEC-subject4 | Human | Endometrium | EEC | 1.98e-27 | -4.80e-01 | -0.2571 |
| 11117 | EMILIN1 | EEC-subject5 | Human | Endometrium | EEC | 3.42e-26 | -4.98e-01 | -0.249 |
| 11117 | EMILIN1 | GSM5276935 | Human | Endometrium | EEC | 5.05e-31 | -4.94e-01 | -0.123 |
| 11117 | EMILIN1 | GSM6177620_NYU_UCEC1_lib1_lib1 | Human | Endometrium | EEC | 1.19e-24 | -5.02e-01 | -0.1869 |
| 11117 | EMILIN1 | GSM6177620_NYU_UCEC1_lib2_lib2 | Human | Endometrium | EEC | 5.85e-22 | -5.02e-01 | -0.1875 |
| 11117 | EMILIN1 | GSM6177620_NYU_UCEC1_lib3_lib3 | Human | Endometrium | EEC | 1.62e-25 | -5.02e-01 | -0.1883 |
| 11117 | EMILIN1 | GSM6177621_NYU_UCEC2_lib1_lib1 | Human | Endometrium | EEC | 4.41e-32 | -4.95e-01 | -0.1934 |
| 11117 | EMILIN1 | GSM6177622_NYU_UCEC3_lib1_lib1 | Human | Endometrium | EEC | 1.26e-30 | -5.02e-01 | -0.1917 |
| 11117 | EMILIN1 | GSM6177622_NYU_UCEC3_lib2_lib2 | Human | Endometrium | EEC | 3.17e-31 | -4.89e-01 | -0.1916 |
| 11117 | EMILIN1 | GSM6177623_NYU_UCEC3_Vis | Human | Endometrium | EEC | 4.91e-19 | -4.56e-01 | -0.1269 |
| 11117 | EMILIN1 | P2T-E | Human | Esophagus | ESCC | 1.84e-54 | 1.02e+00 | 0.1177 |
| 11117 | EMILIN1 | P4T-E | Human | Esophagus | ESCC | 2.81e-07 | 3.71e-01 | 0.1323 |
| Page: 1 2 3 |
| Tissue | Expression Dynamics | Abbreviation |
| Endometrium | 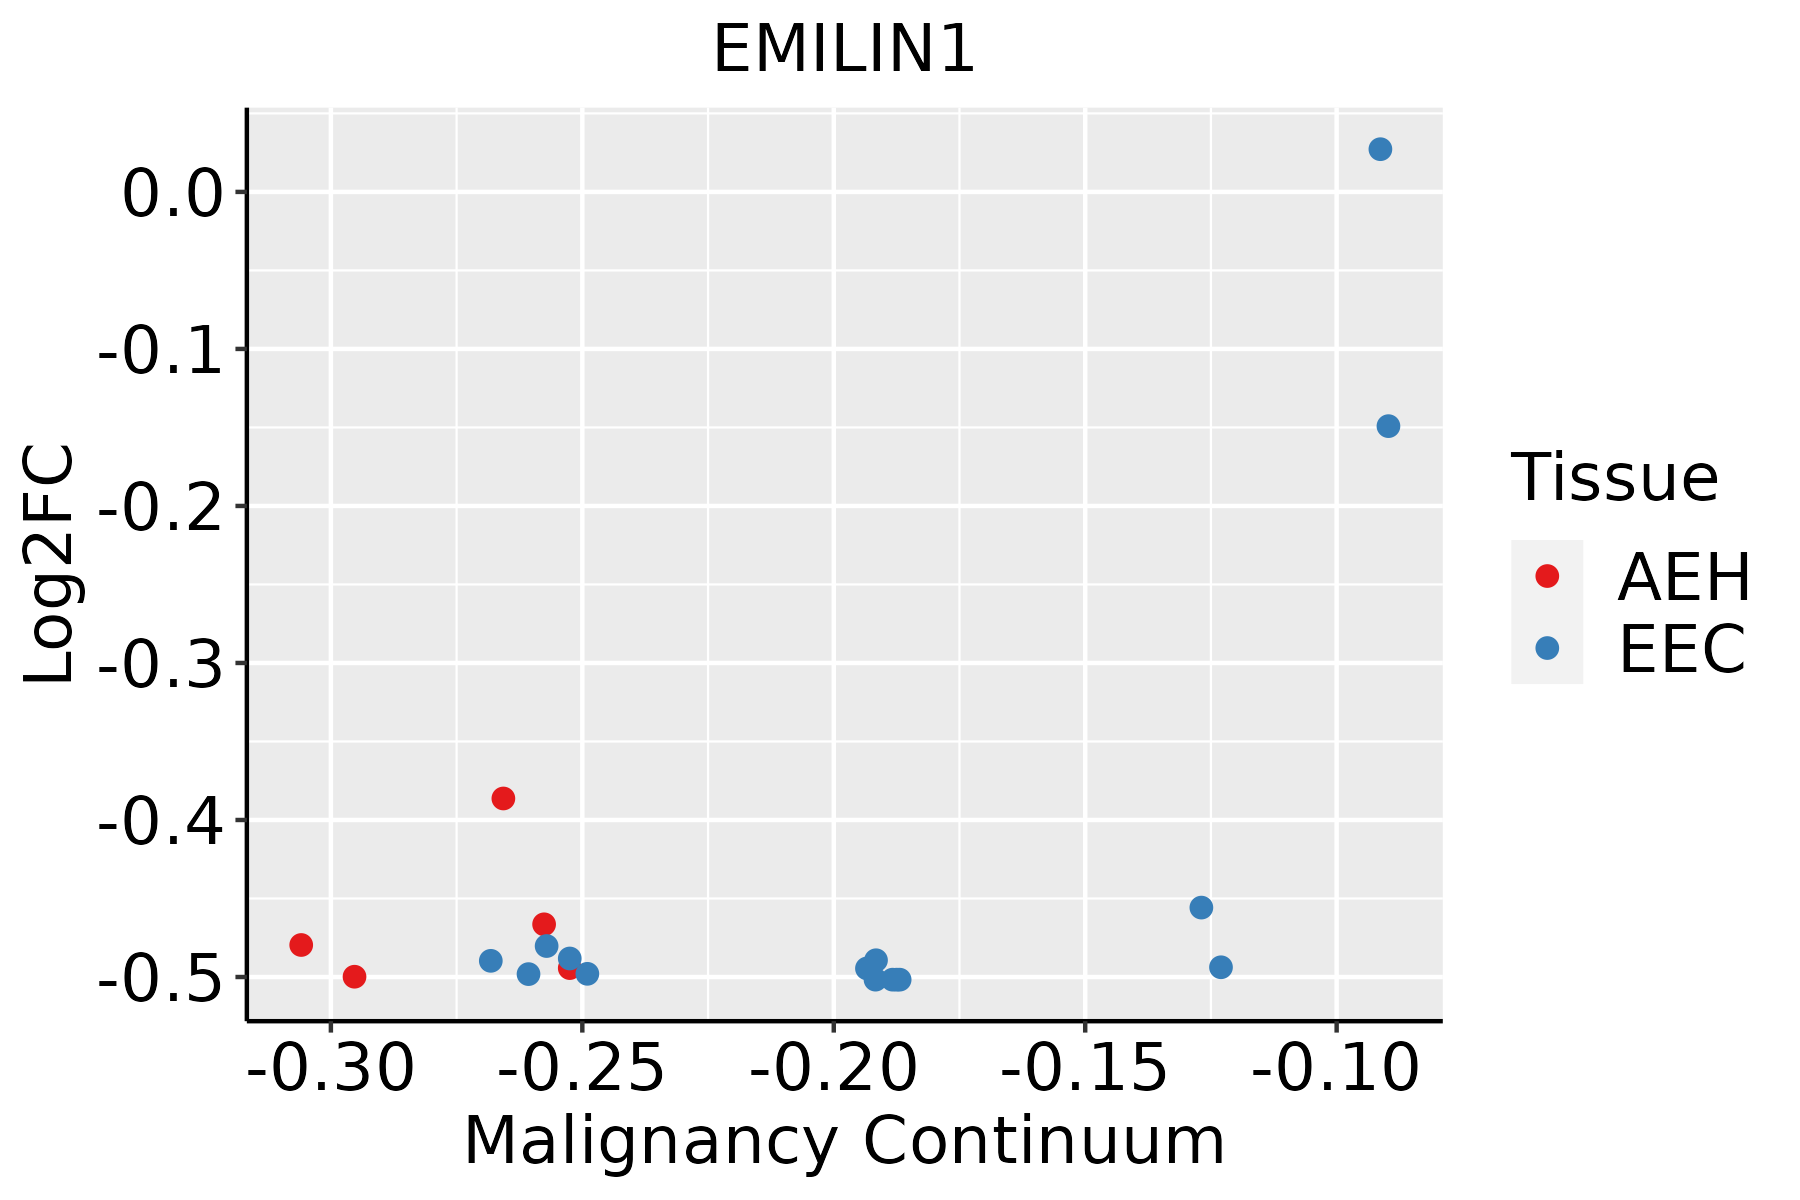 | AEH: Atypical endometrial hyperplasia |
| EEC: Endometrioid Cancer | ||
| Esophagus |  | ESCC: Esophageal squamous cell carcinoma |
| HGIN: High-grade intraepithelial neoplasias | ||
| LGIN: Low-grade intraepithelial neoplasias | ||
| Oral Cavity | 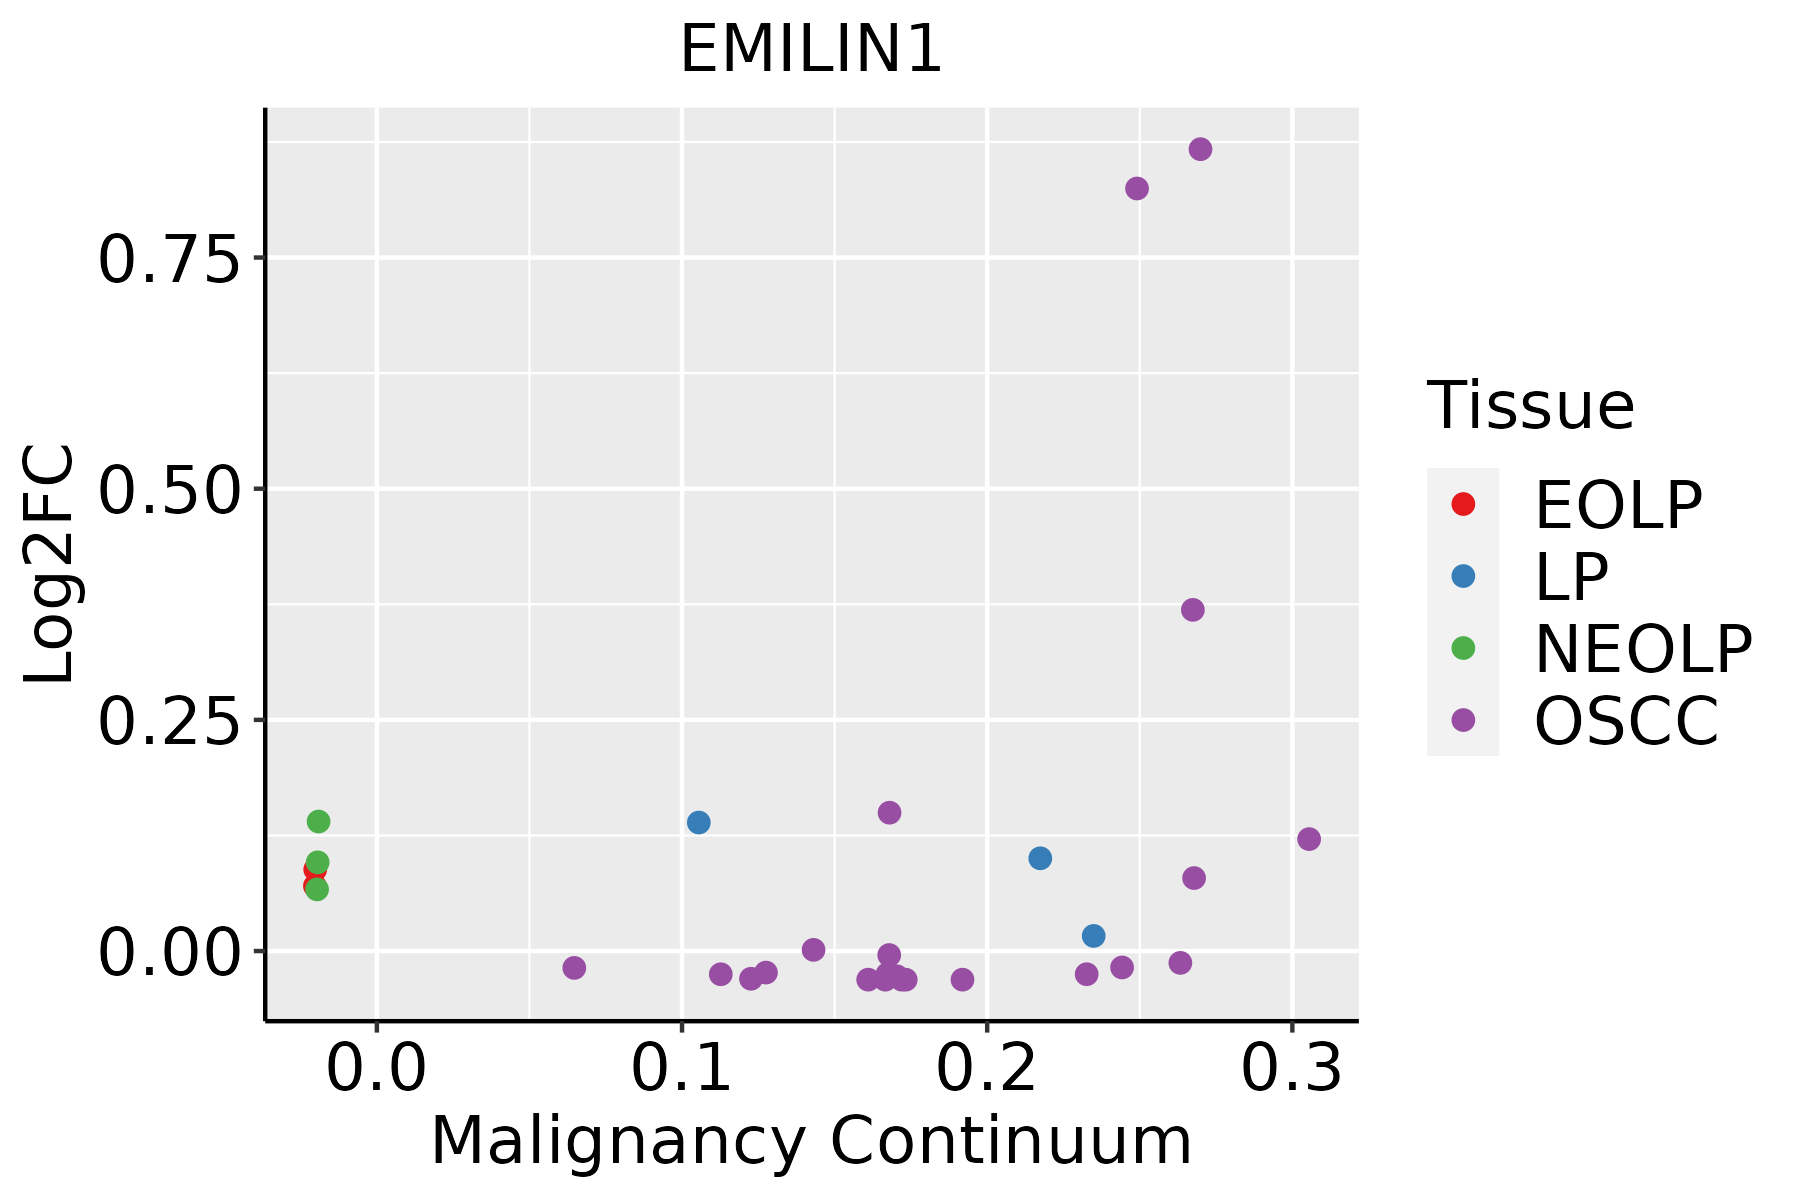 | EOLP: Erosive Oral lichen planus |
| LP: leukoplakia | ||
| NEOLP: Non-erosive oral lichen planus | ||
| OSCC: Oral squamous cell carcinoma | ||
| Thyroid | 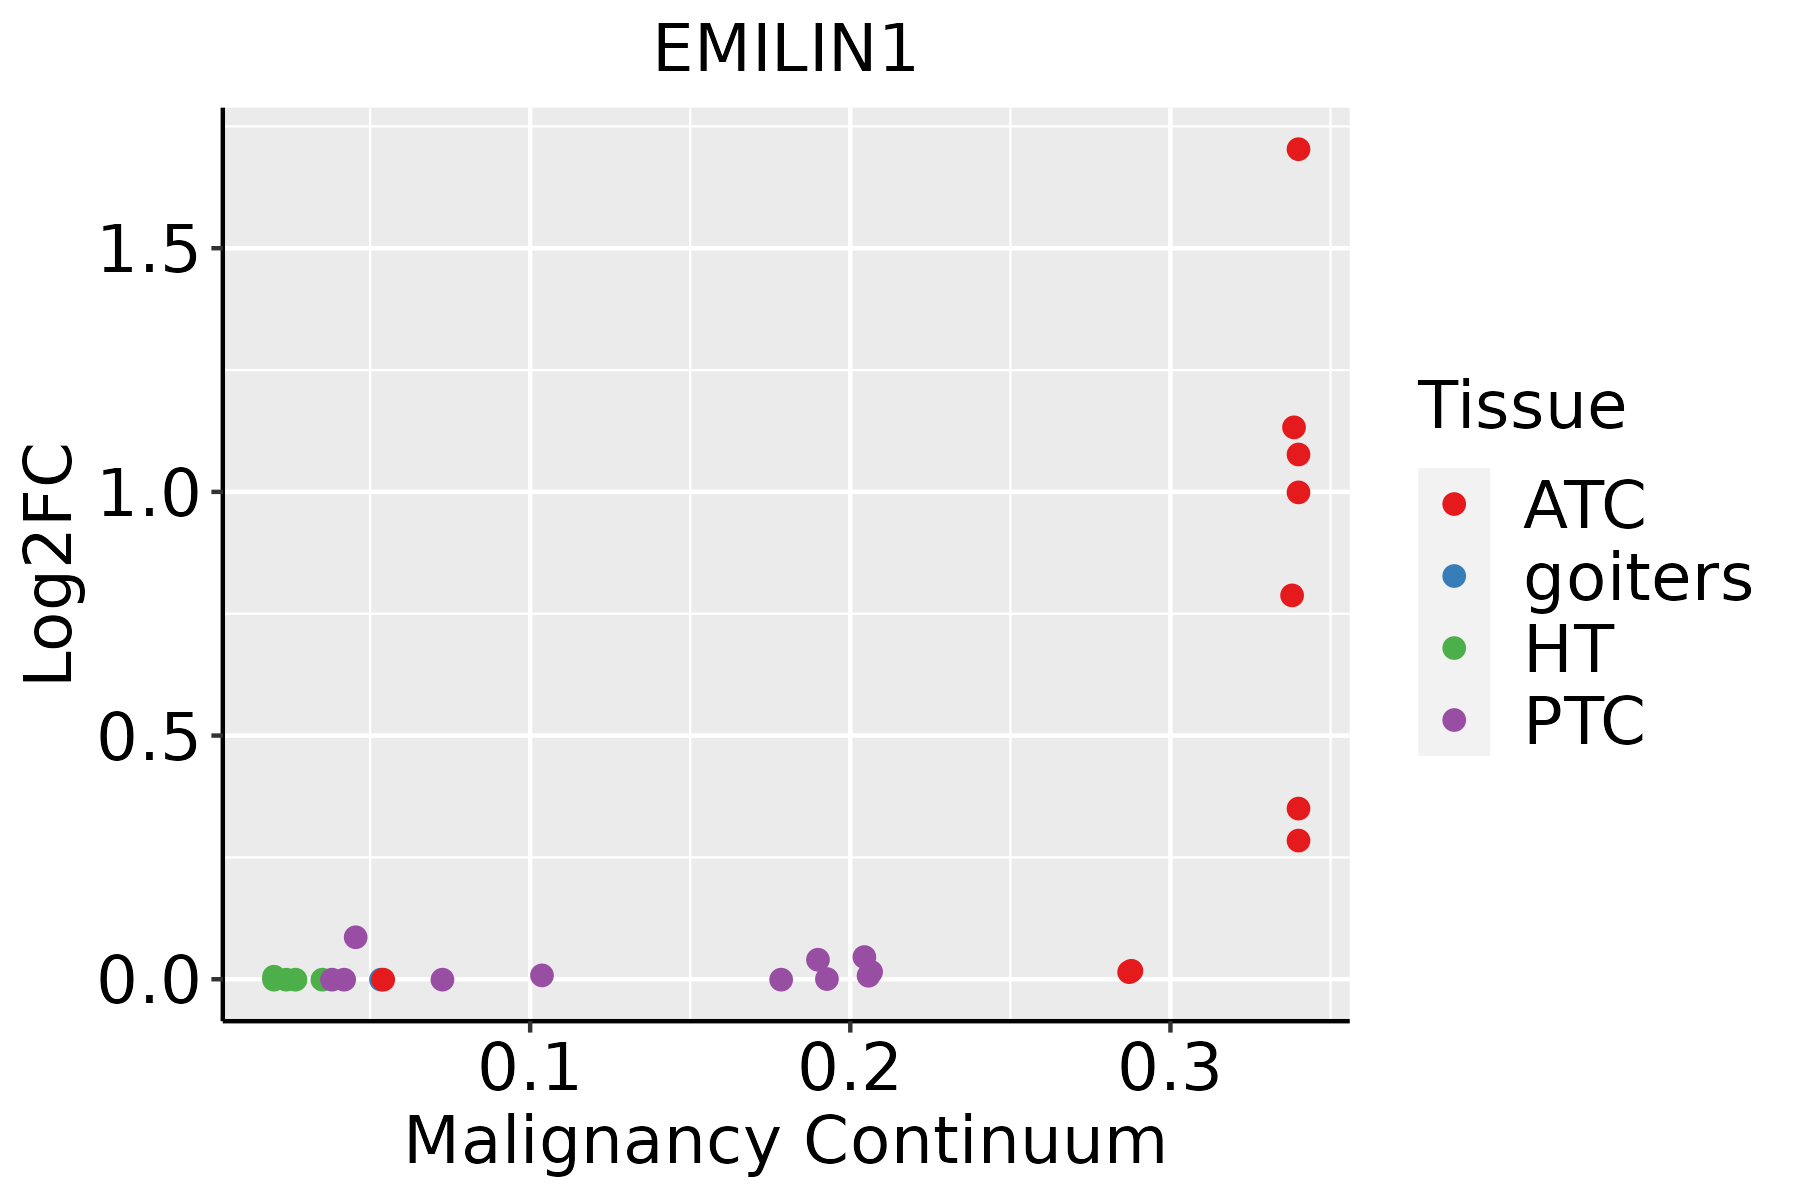 | ATC: Anaplastic thyroid cancer |
| HT: Hashimoto's thyroiditis | ||
| PTC: Papillary thyroid cancer |
| ∗log2FC in expression of this searched gene in stem-like cells from each diseased tissue sample relative to stem-like cells in normal samples in each tissue plotted against the malignancy continuum. Samples are colored based on if they are from different disease stage. |
Top |
Malignant transformation related pathway analysis |
| Find out the enriched GO biological processes and KEGG pathways involved in transition from healthy to precancer to cancer |
| Tissue | Disease Stage | Enriched GO biological Processes |
| Colorectum | AD |  |
| Colorectum | SER |  |
| Colorectum | MSS |  |
| Colorectum | MSI-H |  |
| Colorectum | FAP |  |
| ∗Top 15 enriched GO BP terms are showed in the bar plot of each disease state in each tissue. Each row represents a significant GO biological process which is colored according to the -log10(p.adjust). |
| Page: 1 2 3 4 5 6 7 8 9 |
| GO ID | Tissue | Disease Stage | Description | Gene Ratio | Bg Ratio | pvalue | p.adjust | Count |
| GO:00026858 | Endometrium | AEH | regulation of leukocyte migration | 39/2100 | 210/18723 | 1.06e-03 | 9.33e-03 | 39 |
| GO:00026838 | Endometrium | AEH | negative regulation of immune system process | 69/2100 | 434/18723 | 1.76e-03 | 1.41e-02 | 69 |
| GO:00975299 | Endometrium | AEH | myeloid leukocyte migration | 39/2100 | 220/18723 | 2.55e-03 | 1.88e-02 | 39 |
| GO:004340910 | Endometrium | AEH | negative regulation of MAPK cascade | 33/2100 | 180/18723 | 3.04e-03 | 2.15e-02 | 33 |
| GO:00900922 | Endometrium | AEH | regulation of transmembrane receptor protein serine/threonine kinase signaling pathway | 43/2100 | 256/18723 | 4.47e-03 | 2.93e-02 | 43 |
| GO:0030199 | Endometrium | AEH | collagen fibril organization | 14/2100 | 61/18723 | 6.65e-03 | 3.91e-02 | 14 |
| GO:001081016 | Endometrium | EEC | regulation of cell-substrate adhesion | 63/2168 | 221/18723 | 5.17e-12 | 8.85e-10 | 63 |
| GO:003158915 | Endometrium | EEC | cell-substrate adhesion | 87/2168 | 363/18723 | 1.95e-11 | 3.00e-09 | 87 |
| GO:004578517 | Endometrium | EEC | positive regulation of cell adhesion | 98/2168 | 437/18723 | 6.15e-11 | 8.38e-09 | 98 |
| GO:190290317 | Endometrium | EEC | regulation of supramolecular fiber organization | 82/2168 | 383/18723 | 2.11e-08 | 1.25e-06 | 82 |
| GO:001081117 | Endometrium | EEC | positive regulation of cell-substrate adhesion | 37/2168 | 123/18723 | 2.59e-08 | 1.51e-06 | 37 |
| GO:000716014 | Endometrium | EEC | cell-matrix adhesion | 54/2168 | 233/18723 | 3.98e-07 | 1.56e-05 | 54 |
| GO:200014613 | Endometrium | EEC | negative regulation of cell motility | 71/2168 | 359/18723 | 3.98e-06 | 1.04e-04 | 71 |
| GO:005127113 | Endometrium | EEC | negative regulation of cellular component movement | 72/2168 | 367/18723 | 4.59e-06 | 1.15e-04 | 72 |
| GO:190290415 | Endometrium | EEC | negative regulation of supramolecular fiber organization | 40/2168 | 167/18723 | 5.23e-06 | 1.28e-04 | 40 |
| GO:007155914 | Endometrium | EEC | response to transforming growth factor beta | 54/2168 | 256/18723 | 8.25e-06 | 1.83e-04 | 54 |
| GO:003033612 | Endometrium | EEC | negative regulation of cell migration | 67/2168 | 344/18723 | 1.24e-05 | 2.54e-04 | 67 |
| GO:004001312 | Endometrium | EEC | negative regulation of locomotion | 74/2168 | 391/18723 | 1.28e-05 | 2.59e-04 | 74 |
| GO:007156014 | Endometrium | EEC | cellular response to transforming growth factor beta stimulus | 52/2168 | 250/18723 | 1.81e-05 | 3.41e-04 | 52 |
| GO:000717814 | Endometrium | EEC | transmembrane receptor protein serine/threonine kinase signaling pathway | 68/2168 | 355/18723 | 1.90e-05 | 3.50e-04 | 68 |
| Page: 1 2 3 4 5 6 7 8 9 10 11 12 13 |
| Pathway ID | Tissue | Disease Stage | Description | Gene Ratio | Bg Ratio | pvalue | p.adjust | qvalue | Count |
| Page: 1 |
Top |
Cell-cell communication analysis |
| Identification of potential cell-cell interactions between two cell types and their ligand-receptor pairs for different disease states |
| Ligand | Receptor | LRpair | Pathway | Tissue | Disease Stage |
| Page: 1 |
Top |
Single-cell gene regulatory network inference analysis |
| Find out the significant the regulons (TFs) and the target genes of each regulon across cell types for different disease states |
| TF | Cell Type | Tissue | Disease Stage | Target Gene | RSS | Regulon Activity |
| ∗The dot plots of a searched regulon are shown for all cell subpopulations in each disease state of each tissue based on the regulon specific score inferred using pySCENIC and by calculating the average expression. |
| Page: 1 |
Top |
Somatic mutation of malignant transformation related genes |
| Annotation of somatic variants for genes involved in malignant transformation |
| Hugo Symbol | Variant Class | Variant Classification | dbSNP RS | HGVSc | HGVSp | HGVSp Short | SWISSPROT | BIOTYPE | SIFT | PolyPhen | Tumor Sample Barcode | Tissue | Histology | Sex | Age | Stage | Therapy Types | Drugs | Outcome |
| EMILIN1 | SNV | Missense_Mutation | novel | c.382N>C | p.Asp128His | p.D128H | protein_coding | deleterious(0) | probably_damaging(0.979) | TCGA-BH-A0B6-01 | Breast | breast invasive carcinoma | Female | <65 | I/II | Unknown | Unknown | SD | |
| EMILIN1 | SNV | Missense_Mutation | rs554471085 | c.296G>A | p.Arg99His | p.R99H | protein_coding | deleterious(0) | probably_damaging(0.998) | TCGA-BH-A18G-01 | Breast | breast invasive carcinoma | Female | >=65 | I/II | Unknown | Unknown | SD | |
| EMILIN1 | SNV | Missense_Mutation | c.2029N>A | p.Asp677Asn | p.D677N | protein_coding | deleterious(0) | probably_damaging(0.966) | TCGA-D8-A1JA-01 | Breast | breast invasive carcinoma | Female | <65 | III/IV | Chemotherapy | adriamycin | PD | ||
| EMILIN1 | insertion | Nonsense_Mutation | novel | c.2228_2229insCAACCAAGGACCGTATCATTTCTGAGATTA | p.Gly743_Leu744insAsnGlnGlyProTyrHisPheTerAspTer | p.G743_L744insNQGPYHF*D* | protein_coding | TCGA-A8-A08H-01 | Breast | breast invasive carcinoma | Female | >=65 | I/II | Unknown | Unknown | SD | |||
| EMILIN1 | insertion | Nonsense_Mutation | novel | c.2694_2695insGAGCACAACAGGAGAGCCTCAGCAGATGTTTGCTGAG | p.Tyr899GlufsTer12 | p.Y899Efs*12 | protein_coding | TCGA-BH-A0B3-01 | Breast | breast invasive carcinoma | Female | <65 | I/II | Chemotherapy | cyclophosphamide | SD | |||
| EMILIN1 | insertion | In_Frame_Ins | novel | c.1526_1527insTTTCAT | p.Gly509_Gln510insPheMet | p.G509_Q510insFM | protein_coding | TCGA-DS-A1OB-01 | Cervix | cervical & endocervical cancer | Female | <65 | I/II | Chemotherapy | carboplatin | PD | |||
| EMILIN1 | insertion | Frame_Shift_Ins | novel | c.1529_1530insCCCCA | p.Gln510HisfsTer53 | p.Q510Hfs*53 | protein_coding | TCGA-DS-A1OB-01 | Cervix | cervical & endocervical cancer | Female | <65 | I/II | Chemotherapy | carboplatin | PD | |||
| EMILIN1 | SNV | Missense_Mutation | c.528G>T | p.Glu176Asp | p.E176D | protein_coding | tolerated(0.15) | benign(0.135) | TCGA-A6-6141-01 | Colorectum | colon adenocarcinoma | Male | <65 | I/II | Chemotherapy | 5-fu | SD | ||
| EMILIN1 | SNV | Missense_Mutation | novel | c.736N>T | p.Leu246Phe | p.L246F | protein_coding | tolerated(0.08) | possibly_damaging(0.596) | TCGA-AA-3556-01 | Colorectum | colon adenocarcinoma | Male | >=65 | I/II | Unknown | Unknown | SD | |
| EMILIN1 | SNV | Missense_Mutation | rs781472388 | c.343N>A | p.Asp115Asn | p.D115N | protein_coding | tolerated(0.2) | possibly_damaging(0.521) | TCGA-AA-A010-01 | Colorectum | colon adenocarcinoma | Female | <65 | I/II | Chemotherapy | folinic | CR |
| Page: 1 2 3 4 5 6 7 8 9 10 |
Top |
Related drugs of malignant transformation related genes |
| Identification of chemicals and drugs interact with genes involved in malignant transfromation |
| (DGIdb 4.0) |
| Entrez ID | Symbol | Category | Interaction Types | Drug Claim Name | Drug Name | PMIDs |
| Page: 1 |

Copyright 2023-Present -The University of Texas Health Science Center at Houston |