
|
|||||
|
 | |
| |
| |
| |
| |
| |
|
Gene: ELP6 |
Gene summary for ELP6 |
| Gene information | Species | Human | Gene symbol | ELP6 | Gene ID | 54859 |
| Gene name | elongator acetyltransferase complex subunit 6 | |
| Gene Alias | C3orf75 | |
| Cytomap | 3p21.31 | |
| Gene Type | protein-coding | GO ID | GO:0002097 | UniProtAcc | Q0PNE2 |
Top |
Malignant transformation analysis |
| Identification of the aberrant gene expression in precancerous and cancerous lesions by comparing the gene expression of stem-like cells in diseased tissues with normal stem cells |
| Entrez ID | Symbol | Replicates | Species | Organ | Tissue | Adj P-value | Log2FC | Malignancy |
| 54859 | ELP6 | LZE2T | Human | Esophagus | ESCC | 1.56e-02 | 4.67e-01 | 0.082 |
| 54859 | ELP6 | LZE4T | Human | Esophagus | ESCC | 5.52e-03 | 1.85e-01 | 0.0811 |
| 54859 | ELP6 | LZE7T | Human | Esophagus | ESCC | 8.77e-03 | 2.19e-01 | 0.0667 |
| 54859 | ELP6 | LZE24T | Human | Esophagus | ESCC | 4.80e-12 | 2.45e-01 | 0.0596 |
| 54859 | ELP6 | LZE21T | Human | Esophagus | ESCC | 1.88e-02 | 1.83e-01 | 0.0655 |
| 54859 | ELP6 | LZE6T | Human | Esophagus | ESCC | 1.66e-05 | 2.49e-01 | 0.0845 |
| 54859 | ELP6 | P1T-E | Human | Esophagus | ESCC | 6.11e-03 | 1.56e-01 | 0.0875 |
| 54859 | ELP6 | P2T-E | Human | Esophagus | ESCC | 4.25e-13 | 2.43e-01 | 0.1177 |
| 54859 | ELP6 | P4T-E | Human | Esophagus | ESCC | 2.49e-24 | 4.66e-01 | 0.1323 |
| 54859 | ELP6 | P5T-E | Human | Esophagus | ESCC | 5.79e-05 | 1.28e-01 | 0.1327 |
| 54859 | ELP6 | P8T-E | Human | Esophagus | ESCC | 1.06e-11 | 2.10e-01 | 0.0889 |
| 54859 | ELP6 | P9T-E | Human | Esophagus | ESCC | 1.22e-07 | 2.55e-01 | 0.1131 |
| 54859 | ELP6 | P10T-E | Human | Esophagus | ESCC | 2.16e-21 | 3.40e-01 | 0.116 |
| 54859 | ELP6 | P11T-E | Human | Esophagus | ESCC | 9.95e-06 | 2.61e-01 | 0.1426 |
| 54859 | ELP6 | P12T-E | Human | Esophagus | ESCC | 4.38e-21 | 4.10e-01 | 0.1122 |
| 54859 | ELP6 | P15T-E | Human | Esophagus | ESCC | 6.30e-13 | 2.05e-01 | 0.1149 |
| 54859 | ELP6 | P16T-E | Human | Esophagus | ESCC | 7.06e-21 | 3.34e-01 | 0.1153 |
| 54859 | ELP6 | P17T-E | Human | Esophagus | ESCC | 3.99e-03 | 2.97e-01 | 0.1278 |
| 54859 | ELP6 | P19T-E | Human | Esophagus | ESCC | 6.01e-08 | 4.71e-01 | 0.1662 |
| 54859 | ELP6 | P20T-E | Human | Esophagus | ESCC | 1.74e-08 | 1.73e-01 | 0.1124 |
| Page: 1 2 3 4 5 6 |
| Tissue | Expression Dynamics | Abbreviation |
| Esophagus |  | ESCC: Esophageal squamous cell carcinoma |
| HGIN: High-grade intraepithelial neoplasias | ||
| LGIN: Low-grade intraepithelial neoplasias | ||
| Liver |  | HCC: Hepatocellular carcinoma |
| NAFLD: Non-alcoholic fatty liver disease | ||
| Oral Cavity |  | EOLP: Erosive Oral lichen planus |
| LP: leukoplakia | ||
| NEOLP: Non-erosive oral lichen planus | ||
| OSCC: Oral squamous cell carcinoma | ||
| Skin |  | AK: Actinic keratosis |
| cSCC: Cutaneous squamous cell carcinoma | ||
| SCCIS:squamous cell carcinoma in situ | ||
| Thyroid | 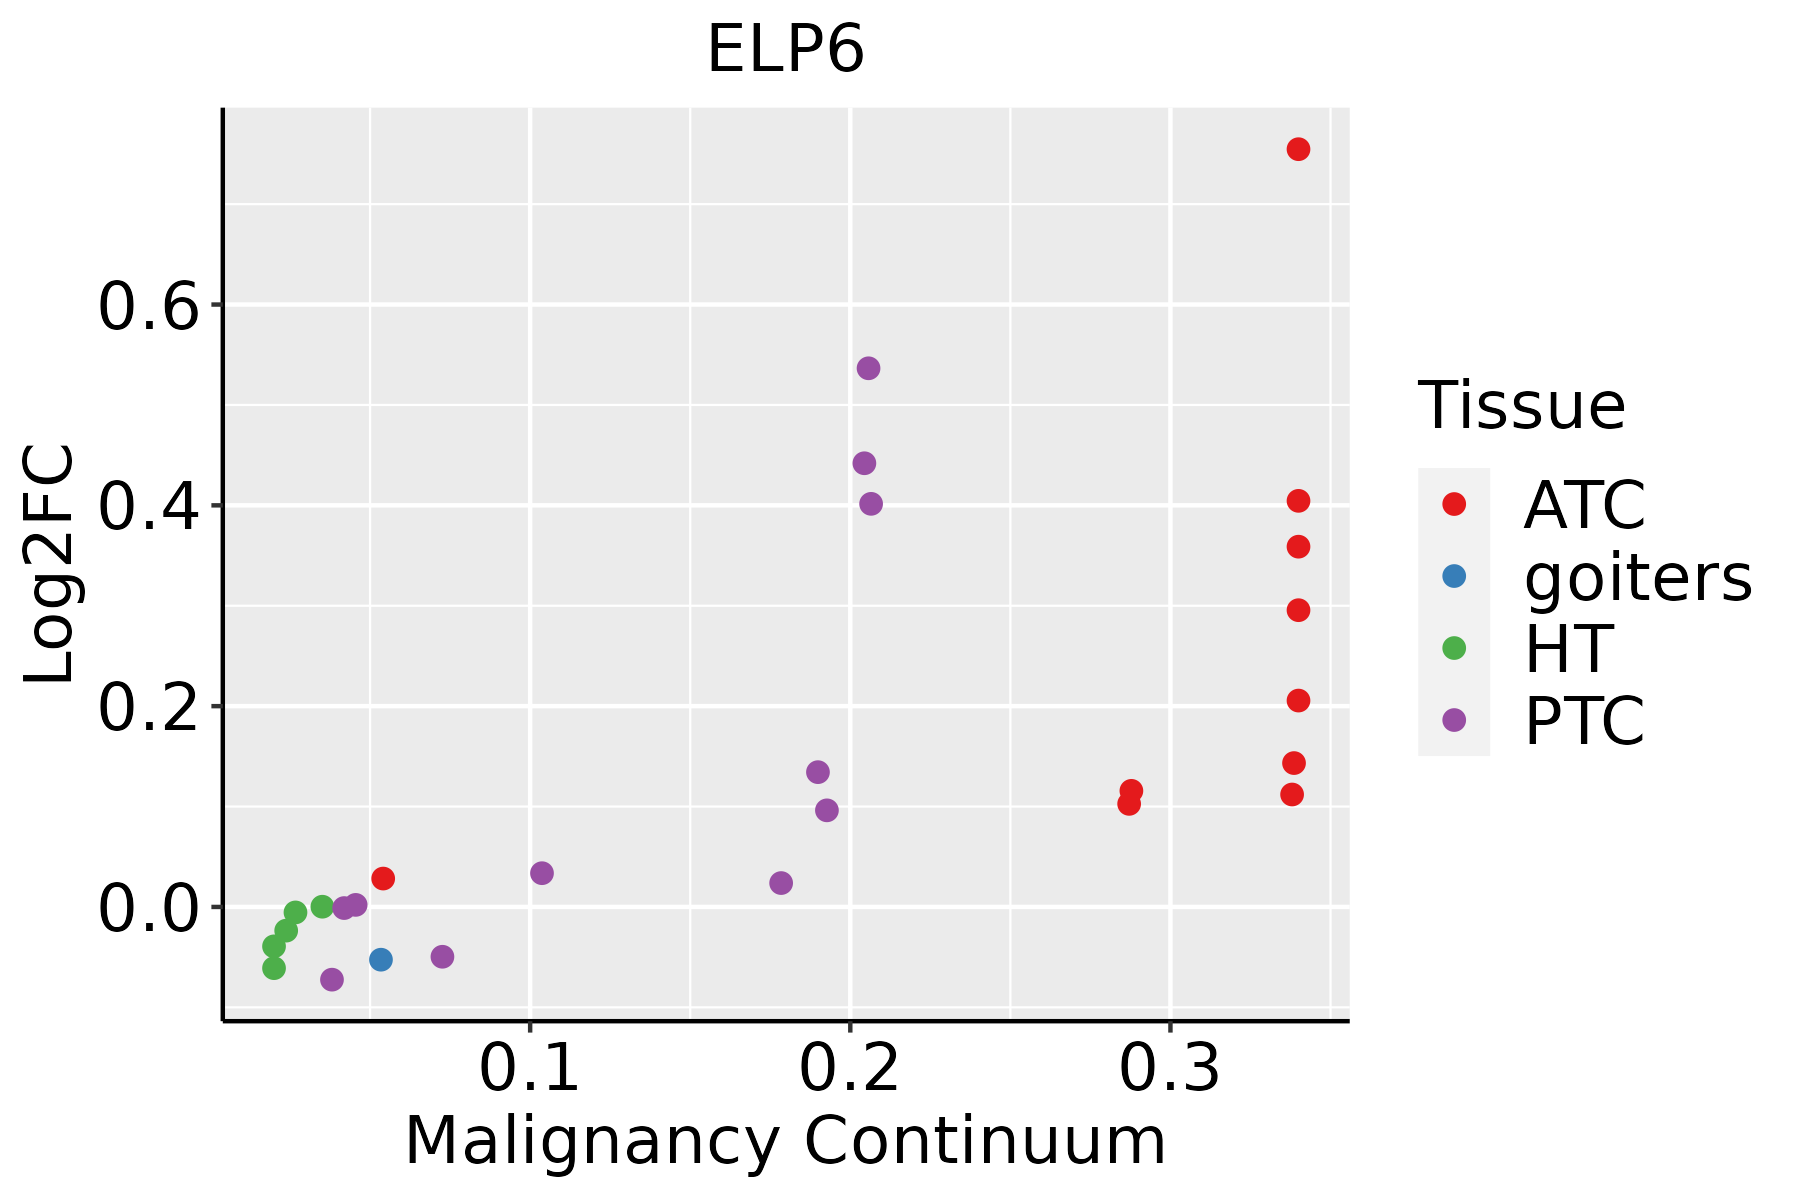 | ATC: Anaplastic thyroid cancer |
| HT: Hashimoto's thyroiditis | ||
| PTC: Papillary thyroid cancer |
| ∗log2FC in expression of this searched gene in stem-like cells from each diseased tissue sample relative to stem-like cells in normal samples in each tissue plotted against the malignancy continuum. Samples are colored based on if they are from different disease stage. |
Top |
Malignant transformation related pathway analysis |
| Find out the enriched GO biological processes and KEGG pathways involved in transition from healthy to precancer to cancer |
| Tissue | Disease Stage | Enriched GO biological Processes |
| Colorectum | AD |  |
| Colorectum | SER |  |
| Colorectum | MSS |  |
| Colorectum | MSI-H |  |
| Colorectum | FAP |  |
| ∗Top 15 enriched GO BP terms are showed in the bar plot of each disease state in each tissue. Each row represents a significant GO biological process which is colored according to the -log10(p.adjust). |
| Page: 1 2 3 4 5 6 7 8 9 |
| GO ID | Tissue | Disease Stage | Description | Gene Ratio | Bg Ratio | pvalue | p.adjust | Count |
| GO:003447014 | Oral cavity | LP | ncRNA processing | 184/4623 | 395/18723 | 1.20e-21 | 3.12e-19 | 184 |
| GO:003466011 | Oral cavity | LP | ncRNA metabolic process | 205/4623 | 485/18723 | 6.46e-18 | 1.09e-15 | 205 |
| GO:00080331 | Oral cavity | LP | tRNA processing | 44/4623 | 127/18723 | 7.50e-03 | 4.15e-02 | 44 |
| GO:003447017 | Skin | cSCC | ncRNA processing | 215/4864 | 395/18723 | 6.83e-34 | 4.28e-31 | 215 |
| GO:003466013 | Skin | cSCC | ncRNA metabolic process | 234/4864 | 485/18723 | 1.37e-26 | 4.77e-24 | 234 |
| GO:00080334 | Skin | cSCC | tRNA processing | 49/4864 | 127/18723 | 1.20e-03 | 7.81e-03 | 49 |
| GO:00063993 | Skin | cSCC | tRNA metabolic process | 64/4864 | 179/18723 | 2.34e-03 | 1.36e-02 | 64 |
| GO:00094513 | Skin | cSCC | RNA modification | 58/4864 | 167/18723 | 7.33e-03 | 3.47e-02 | 58 |
| GO:003447018 | Thyroid | PTC | ncRNA processing | 215/5968 | 395/18723 | 7.14e-21 | 1.22e-18 | 215 |
| GO:00346608 | Thyroid | PTC | ncRNA metabolic process | 239/5968 | 485/18723 | 5.54e-16 | 4.26e-14 | 239 |
| GO:003447021 | Thyroid | ATC | ncRNA processing | 216/6293 | 395/18723 | 3.14e-18 | 3.98e-16 | 216 |
| GO:003466021 | Thyroid | ATC | ncRNA metabolic process | 240/6293 | 485/18723 | 2.03e-13 | 9.91e-12 | 240 |
| Page: 1 2 |
| Pathway ID | Tissue | Disease Stage | Description | Gene Ratio | Bg Ratio | pvalue | p.adjust | qvalue | Count |
| Page: 1 |
Top |
Cell-cell communication analysis |
| Identification of potential cell-cell interactions between two cell types and their ligand-receptor pairs for different disease states |
| Ligand | Receptor | LRpair | Pathway | Tissue | Disease Stage |
| Page: 1 |
Top |
Single-cell gene regulatory network inference analysis |
| Find out the significant the regulons (TFs) and the target genes of each regulon across cell types for different disease states |
| TF | Cell Type | Tissue | Disease Stage | Target Gene | RSS | Regulon Activity |
| ∗The dot plots of a searched regulon are shown for all cell subpopulations in each disease state of each tissue based on the regulon specific score inferred using pySCENIC and by calculating the average expression. |
| Page: 1 |
Top |
Somatic mutation of malignant transformation related genes |
| Annotation of somatic variants for genes involved in malignant transformation |
| Hugo Symbol | Variant Class | Variant Classification | dbSNP RS | HGVSc | HGVSp | HGVSp Short | SWISSPROT | BIOTYPE | SIFT | PolyPhen | Tumor Sample Barcode | Tissue | Histology | Sex | Age | Stage | Therapy Types | Drugs | Outcome |
| ELP6 | SNV | Missense_Mutation | rs545060366 | c.54N>T | p.Gln18His | p.Q18H | Q0PNE2 | protein_coding | deleterious(0.01) | possibly_damaging(0.81) | TCGA-A2-A04N-01 | Breast | breast invasive carcinoma | Female | >=65 | I/II | Chemotherapy | cytoxan | SD |
| ELP6 | SNV | Missense_Mutation | c.263N>G | p.Lys88Arg | p.K88R | Q0PNE2 | protein_coding | tolerated(0.24) | benign(0.058) | TCGA-E2-A1L9-01 | Breast | breast invasive carcinoma | Female | <65 | I/II | Chemotherapy | cytoxan | SD | |
| ELP6 | insertion | Frame_Shift_Ins | novel | c.217_218insTTTGTCCCAAAAGCTATAGAGAGGATCATTTGCTGGAAGGATGG | p.Thr73IlefsTer58 | p.T73Ifs*58 | Q0PNE2 | protein_coding | TCGA-A2-A0EY-01 | Breast | breast invasive carcinoma | Female | <65 | I/II | Chemotherapy | adriamycin | SD | ||
| ELP6 | SNV | Missense_Mutation | c.773N>T | p.Ala258Val | p.A258V | Q0PNE2 | protein_coding | deleterious(0) | possibly_damaging(0.544) | TCGA-AD-6964-01 | Colorectum | colon adenocarcinoma | Male | <65 | III/IV | Chemotherapy | folfox | PD | |
| ELP6 | SNV | Missense_Mutation | c.294N>C | p.Gln98His | p.Q98H | Q0PNE2 | protein_coding | tolerated(0.08) | possibly_damaging(0.571) | TCGA-AZ-4315-01 | Colorectum | colon adenocarcinoma | Male | <65 | I/II | Unknown | Unknown | SD | |
| ELP6 | SNV | Missense_Mutation | rs758926474 | c.706N>A | p.Ala236Thr | p.A236T | Q0PNE2 | protein_coding | tolerated(1) | benign(0) | TCGA-G4-6628-01 | Colorectum | colon adenocarcinoma | Male | >=65 | I/II | Unknown | Unknown | SD |
| ELP6 | SNV | Missense_Mutation | novel | c.703N>T | p.Pro235Ser | p.P235S | Q0PNE2 | protein_coding | tolerated(0.74) | benign(0.001) | TCGA-A5-A0G1-01 | Endometrium | uterine corpus endometrioid carcinoma | Female | >=65 | I/II | Unknown | Unknown | SD |
| ELP6 | SNV | Missense_Mutation | rs759438726 | c.280G>A | p.Val94Ile | p.V94I | Q0PNE2 | protein_coding | tolerated(0.21) | benign(0.013) | TCGA-AJ-A3EK-01 | Endometrium | uterine corpus endometrioid carcinoma | Female | <65 | I/II | Chemotherapy | carboplatin | CR |
| ELP6 | SNV | Missense_Mutation | rs370492398 | c.626N>A | p.Arg209Gln | p.R209Q | Q0PNE2 | protein_coding | tolerated(0.38) | benign(0.121) | TCGA-AP-A05J-01 | Endometrium | uterine corpus endometrioid carcinoma | Female | >=65 | I/II | Chemotherapy | carboplatin | SD |
| ELP6 | SNV | Missense_Mutation | novel | c.201G>T | p.Lys67Asn | p.K67N | Q0PNE2 | protein_coding | deleterious(0) | possibly_damaging(0.756) | TCGA-AP-A1DK-01 | Endometrium | uterine corpus endometrioid carcinoma | Female | <65 | I/II | Unknown | Unknown | SD |
| Page: 1 2 3 |
Top |
Related drugs of malignant transformation related genes |
| Identification of chemicals and drugs interact with genes involved in malignant transfromation |
| (DGIdb 4.0) |
| Entrez ID | Symbol | Category | Interaction Types | Drug Claim Name | Drug Name | PMIDs |
| Page: 1 |

Copyright 2023-Present -The University of Texas Health Science Center at Houston |