
|
|||||
|
 | |
| |
| |
| |
| |
| |
|
Gene: ELOVL3 |
Gene summary for ELOVL3 |
| Gene information | Species | Human | Gene symbol | ELOVL3 | Gene ID | 83401 |
| Gene name | ELOVL fatty acid elongase 3 | |
| Gene Alias | CIG-30 | |
| Cytomap | 10q24.32 | |
| Gene Type | protein-coding | GO ID | GO:0000038 | UniProtAcc | Q9HB03 |
Top |
Malignant transformation analysis |
| Identification of the aberrant gene expression in precancerous and cancerous lesions by comparing the gene expression of stem-like cells in diseased tissues with normal stem cells |
| Entrez ID | Symbol | Replicates | Species | Organ | Tissue | Adj P-value | Log2FC | Malignancy |
| 83401 | ELOVL3 | P56T-E | Human | Esophagus | ESCC | 2.17e-07 | 7.33e-01 | 0.1613 |
| 83401 | ELOVL3 | P80T-E | Human | Esophagus | ESCC | 1.13e-42 | 1.67e+00 | 0.155 |
| 83401 | ELOVL3 | P130T-E | Human | Esophagus | ESCC | 1.51e-34 | 6.98e-01 | 0.1676 |
| Page: 1 |
| Tissue | Expression Dynamics | Abbreviation |
| Esophagus | 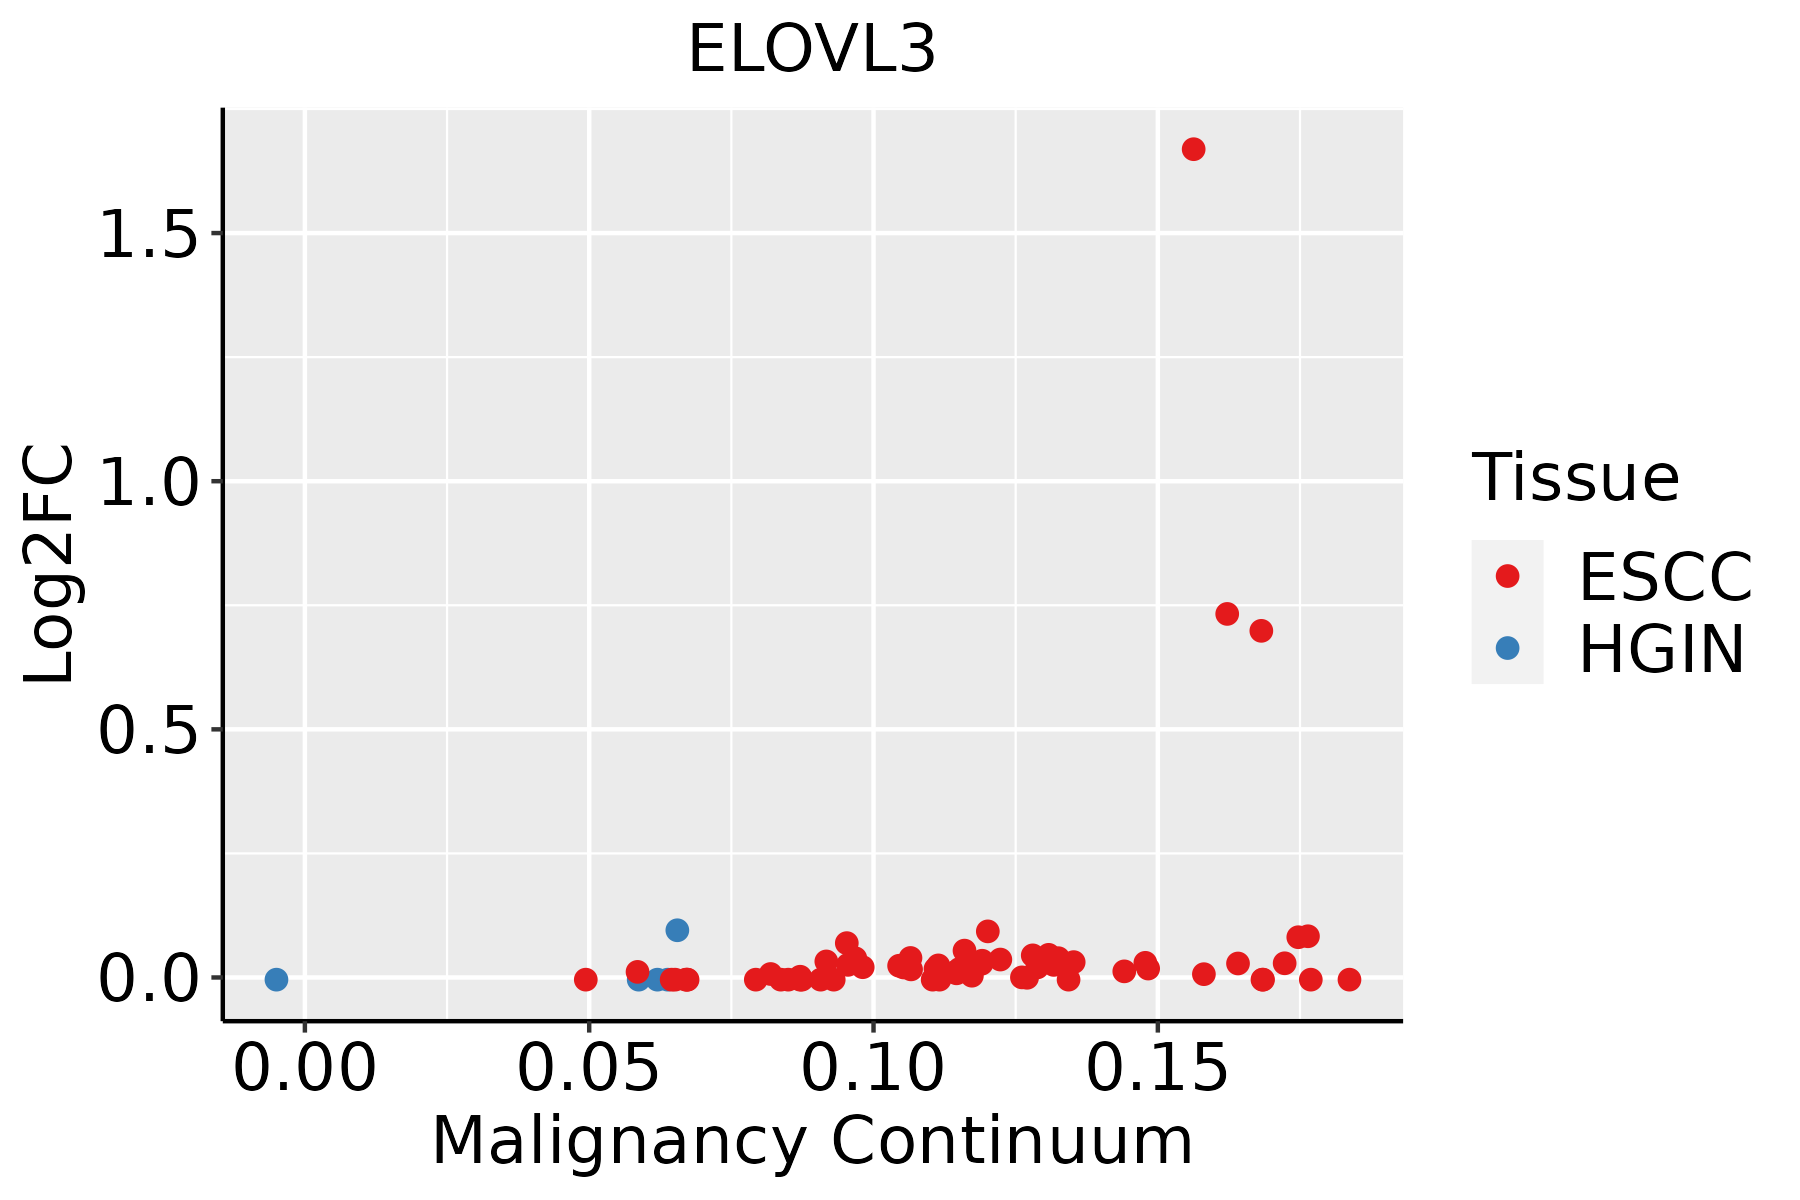 | ESCC: Esophageal squamous cell carcinoma |
| HGIN: High-grade intraepithelial neoplasias | ||
| LGIN: Low-grade intraepithelial neoplasias |
| ∗log2FC in expression of this searched gene in stem-like cells from each diseased tissue sample relative to stem-like cells in normal samples in each tissue plotted against the malignancy continuum. Samples are colored based on if they are from different disease stage. |
Top |
Malignant transformation related pathway analysis |
| Find out the enriched GO biological processes and KEGG pathways involved in transition from healthy to precancer to cancer |
| Tissue | Disease Stage | Enriched GO biological Processes |
| Colorectum | AD |  |
| Colorectum | SER |  |
| Colorectum | MSS |  |
| Colorectum | MSI-H |  |
| Colorectum | FAP |  |
| ∗Top 15 enriched GO BP terms are showed in the bar plot of each disease state in each tissue. Each row represents a significant GO biological process which is colored according to the -log10(p.adjust). |
| Page: 1 2 3 4 5 6 7 8 9 |
| GO ID | Tissue | Disease Stage | Description | Gene Ratio | Bg Ratio | pvalue | p.adjust | Count |
| GO:00066318 | Esophagus | ESCC | fatty acid metabolic process | 217/8552 | 390/18723 | 4.21e-05 | 3.39e-04 | 217 |
| GO:0009152110 | Esophagus | ESCC | purine ribonucleotide biosynthetic process | 103/8552 | 169/18723 | 4.40e-05 | 3.51e-04 | 103 |
| GO:000616417 | Esophagus | ESCC | purine nucleotide biosynthetic process | 113/8552 | 191/18723 | 1.16e-04 | 8.04e-04 | 113 |
| GO:00463948 | Esophagus | ESCC | carboxylic acid biosynthetic process | 175/8552 | 314/18723 | 1.98e-04 | 1.26e-03 | 175 |
| GO:00160538 | Esophagus | ESCC | organic acid biosynthetic process | 175/8552 | 316/18723 | 3.04e-04 | 1.82e-03 | 175 |
| GO:00353844 | Esophagus | ESCC | thioester biosynthetic process | 32/8552 | 45/18723 | 4.87e-04 | 2.70e-03 | 32 |
| GO:00716164 | Esophagus | ESCC | acyl-CoA biosynthetic process | 32/8552 | 45/18723 | 4.87e-04 | 2.70e-03 | 32 |
| GO:00338655 | Esophagus | ESCC | nucleoside bisphosphate metabolic process | 77/8552 | 128/18723 | 6.71e-04 | 3.55e-03 | 77 |
| GO:00338755 | Esophagus | ESCC | ribonucleoside bisphosphate metabolic process | 77/8552 | 128/18723 | 6.71e-04 | 3.55e-03 | 77 |
| GO:00340325 | Esophagus | ESCC | purine nucleoside bisphosphate metabolic process | 77/8552 | 128/18723 | 6.71e-04 | 3.55e-03 | 77 |
| GO:00301481 | Esophagus | ESCC | sphingolipid biosynthetic process | 62/8552 | 103/18723 | 2.10e-03 | 9.38e-03 | 62 |
| GO:01201624 | Esophagus | ESCC | positive regulation of cold-induced thermogenesis | 57/8552 | 97/18723 | 6.43e-03 | 2.35e-02 | 57 |
| GO:01061066 | Esophagus | ESCC | cold-induced thermogenesis | 80/8552 | 144/18723 | 1.07e-02 | 3.65e-02 | 80 |
| GO:01201616 | Esophagus | ESCC | regulation of cold-induced thermogenesis | 80/8552 | 144/18723 | 1.07e-02 | 3.65e-02 | 80 |
| GO:00066374 | Esophagus | ESCC | acyl-CoA metabolic process | 55/8552 | 96/18723 | 1.45e-02 | 4.71e-02 | 55 |
| GO:00353834 | Esophagus | ESCC | thioester metabolic process | 55/8552 | 96/18723 | 1.45e-02 | 4.71e-02 | 55 |
| Page: 1 2 |
| Pathway ID | Tissue | Disease Stage | Description | Gene Ratio | Bg Ratio | pvalue | p.adjust | qvalue | Count |
| Page: 1 |
Top |
Cell-cell communication analysis |
| Identification of potential cell-cell interactions between two cell types and their ligand-receptor pairs for different disease states |
| Ligand | Receptor | LRpair | Pathway | Tissue | Disease Stage |
| Page: 1 |
Top |
Single-cell gene regulatory network inference analysis |
| Find out the significant the regulons (TFs) and the target genes of each regulon across cell types for different disease states |
| TF | Cell Type | Tissue | Disease Stage | Target Gene | RSS | Regulon Activity |
| ∗The dot plots of a searched regulon are shown for all cell subpopulations in each disease state of each tissue based on the regulon specific score inferred using pySCENIC and by calculating the average expression. |
| Page: 1 |
Top |
Somatic mutation of malignant transformation related genes |
| Annotation of somatic variants for genes involved in malignant transformation |
| Hugo Symbol | Variant Class | Variant Classification | dbSNP RS | HGVSc | HGVSp | HGVSp Short | SWISSPROT | BIOTYPE | SIFT | PolyPhen | Tumor Sample Barcode | Tissue | Histology | Sex | Age | Stage | Therapy Types | Drugs | Outcome |
| ELOVL3 | SNV | Missense_Mutation | c.139N>G | p.Leu47Val | p.L47V | Q9HB03 | protein_coding | tolerated(0.14) | benign(0.241) | TCGA-A1-A0SI-01 | Breast | breast invasive carcinoma | Female | <65 | I/II | Unknown | Unknown | SD | |
| ELOVL3 | SNV | Missense_Mutation | c.777N>G | p.Ile259Met | p.I259M | Q9HB03 | protein_coding | deleterious(0.04) | benign(0.158) | TCGA-AN-A0XN-01 | Breast | breast invasive carcinoma | Female | >=65 | III/IV | Unknown | Unknown | SD | |
| ELOVL3 | SNV | Missense_Mutation | c.565N>C | p.Ala189Pro | p.A189P | Q9HB03 | protein_coding | deleterious(0) | probably_damaging(0.998) | TCGA-BH-A0WA-01 | Breast | breast invasive carcinoma | Female | >=65 | I/II | Unknown | Unknown | SD | |
| ELOVL3 | deletion | Frame_Shift_Del | novel | c.798_811delNNNNNNNNNNNNNN | p.Thr267LysfsTer7 | p.T267Kfs*7 | Q9HB03 | protein_coding | TCGA-GI-A2C9-01 | Breast | breast invasive carcinoma | Female | <65 | I/II | Unspecific | SD | |||
| ELOVL3 | SNV | Missense_Mutation | rs774432163 | c.172N>T | p.Arg58Cys | p.R58C | Q9HB03 | protein_coding | deleterious(0) | probably_damaging(0.97) | TCGA-A6-2672-01 | Colorectum | colon adenocarcinoma | Female | >=65 | III/IV | Unknown | Unknown | SD |
| ELOVL3 | SNV | Missense_Mutation | c.80N>T | p.Arg27Met | p.R27M | Q9HB03 | protein_coding | deleterious(0.01) | benign(0.028) | TCGA-A6-6653-01 | Colorectum | colon adenocarcinoma | Male | >=65 | I/II | Unknown | Unknown | SD | |
| ELOVL3 | SNV | Missense_Mutation | c.519N>C | p.Met173Ile | p.M173I | Q9HB03 | protein_coding | deleterious(0.03) | benign(0.387) | TCGA-AA-3710-01 | Colorectum | colon adenocarcinoma | Female | >=65 | I/II | Unknown | Unknown | SD | |
| ELOVL3 | SNV | Missense_Mutation | novel | c.4G>A | p.Val2Ile | p.V2I | Q9HB03 | protein_coding | tolerated_low_confidence(0.43) | benign(0) | TCGA-CM-4743-01 | Colorectum | colon adenocarcinoma | Male | >=65 | I/II | Chemotherapy | capecitabine | SD |
| ELOVL3 | SNV | Missense_Mutation | c.133C>A | p.Leu45Met | p.L45M | Q9HB03 | protein_coding | tolerated(0.27) | possibly_damaging(0.897) | TCGA-WS-AB45-01 | Colorectum | colon adenocarcinoma | Female | <65 | I/II | Unknown | Unknown | SD | |
| ELOVL3 | SNV | Missense_Mutation | novel | c.722T>C | p.Ile241Thr | p.I241T | Q9HB03 | protein_coding | tolerated(0.07) | benign(0.026) | TCGA-F5-6814-01 | Colorectum | rectum adenocarcinoma | Male | <65 | I/II | Unknown | Unknown | SD |
| Page: 1 2 3 4 |
Top |
Related drugs of malignant transformation related genes |
| Identification of chemicals and drugs interact with genes involved in malignant transfromation |
| (DGIdb 4.0) |
| Entrez ID | Symbol | Category | Interaction Types | Drug Claim Name | Drug Name | PMIDs |
| Page: 1 |

Copyright 2023-Present -The University of Texas Health Science Center at Houston |