
|
|||||
|
 | |
| |
| |
| |
| |
| |
|
Gene: ELAC2 |
Gene summary for ELAC2 |
| Gene information | Species | Human | Gene symbol | ELAC2 | Gene ID | 60528 |
| Gene name | elaC ribonuclease Z 2 | |
| Gene Alias | COXPD17 | |
| Cytomap | 17p12 | |
| Gene Type | protein-coding | GO ID | GO:0000959 | UniProtAcc | Q9BQ52 |
Top |
Malignant transformation analysis |
| Identification of the aberrant gene expression in precancerous and cancerous lesions by comparing the gene expression of stem-like cells in diseased tissues with normal stem cells |
| Entrez ID | Symbol | Replicates | Species | Organ | Tissue | Adj P-value | Log2FC | Malignancy |
| 60528 | ELAC2 | LZE7T | Human | Esophagus | ESCC | 9.63e-14 | 5.20e-01 | 0.0667 |
| 60528 | ELAC2 | LZE22T | Human | Esophagus | ESCC | 1.88e-03 | 2.77e-01 | 0.068 |
| 60528 | ELAC2 | LZE24T | Human | Esophagus | ESCC | 3.52e-16 | 3.70e-01 | 0.0596 |
| 60528 | ELAC2 | P2T-E | Human | Esophagus | ESCC | 2.35e-19 | 3.14e-01 | 0.1177 |
| 60528 | ELAC2 | P4T-E | Human | Esophagus | ESCC | 1.55e-16 | 4.79e-01 | 0.1323 |
| 60528 | ELAC2 | P5T-E | Human | Esophagus | ESCC | 1.49e-12 | 9.59e-02 | 0.1327 |
| 60528 | ELAC2 | P8T-E | Human | Esophagus | ESCC | 3.35e-17 | 3.54e-01 | 0.0889 |
| 60528 | ELAC2 | P9T-E | Human | Esophagus | ESCC | 6.45e-06 | 1.68e-01 | 0.1131 |
| 60528 | ELAC2 | P10T-E | Human | Esophagus | ESCC | 2.26e-23 | 2.86e-01 | 0.116 |
| 60528 | ELAC2 | P11T-E | Human | Esophagus | ESCC | 2.61e-05 | 2.77e-01 | 0.1426 |
| 60528 | ELAC2 | P12T-E | Human | Esophagus | ESCC | 1.26e-24 | 4.28e-01 | 0.1122 |
| 60528 | ELAC2 | P15T-E | Human | Esophagus | ESCC | 1.83e-13 | 1.61e-01 | 0.1149 |
| 60528 | ELAC2 | P16T-E | Human | Esophagus | ESCC | 1.69e-22 | 3.73e-01 | 0.1153 |
| 60528 | ELAC2 | P17T-E | Human | Esophagus | ESCC | 2.24e-07 | 3.57e-01 | 0.1278 |
| 60528 | ELAC2 | P19T-E | Human | Esophagus | ESCC | 1.72e-05 | 8.14e-01 | 0.1662 |
| 60528 | ELAC2 | P20T-E | Human | Esophagus | ESCC | 2.33e-10 | 2.50e-01 | 0.1124 |
| 60528 | ELAC2 | P21T-E | Human | Esophagus | ESCC | 1.52e-27 | 5.56e-01 | 0.1617 |
| 60528 | ELAC2 | P22T-E | Human | Esophagus | ESCC | 2.94e-17 | 3.32e-01 | 0.1236 |
| 60528 | ELAC2 | P23T-E | Human | Esophagus | ESCC | 2.01e-24 | 5.93e-01 | 0.108 |
| 60528 | ELAC2 | P24T-E | Human | Esophagus | ESCC | 1.33e-32 | 5.52e-01 | 0.1287 |
| Page: 1 2 3 4 5 |
| Tissue | Expression Dynamics | Abbreviation |
| Esophagus | 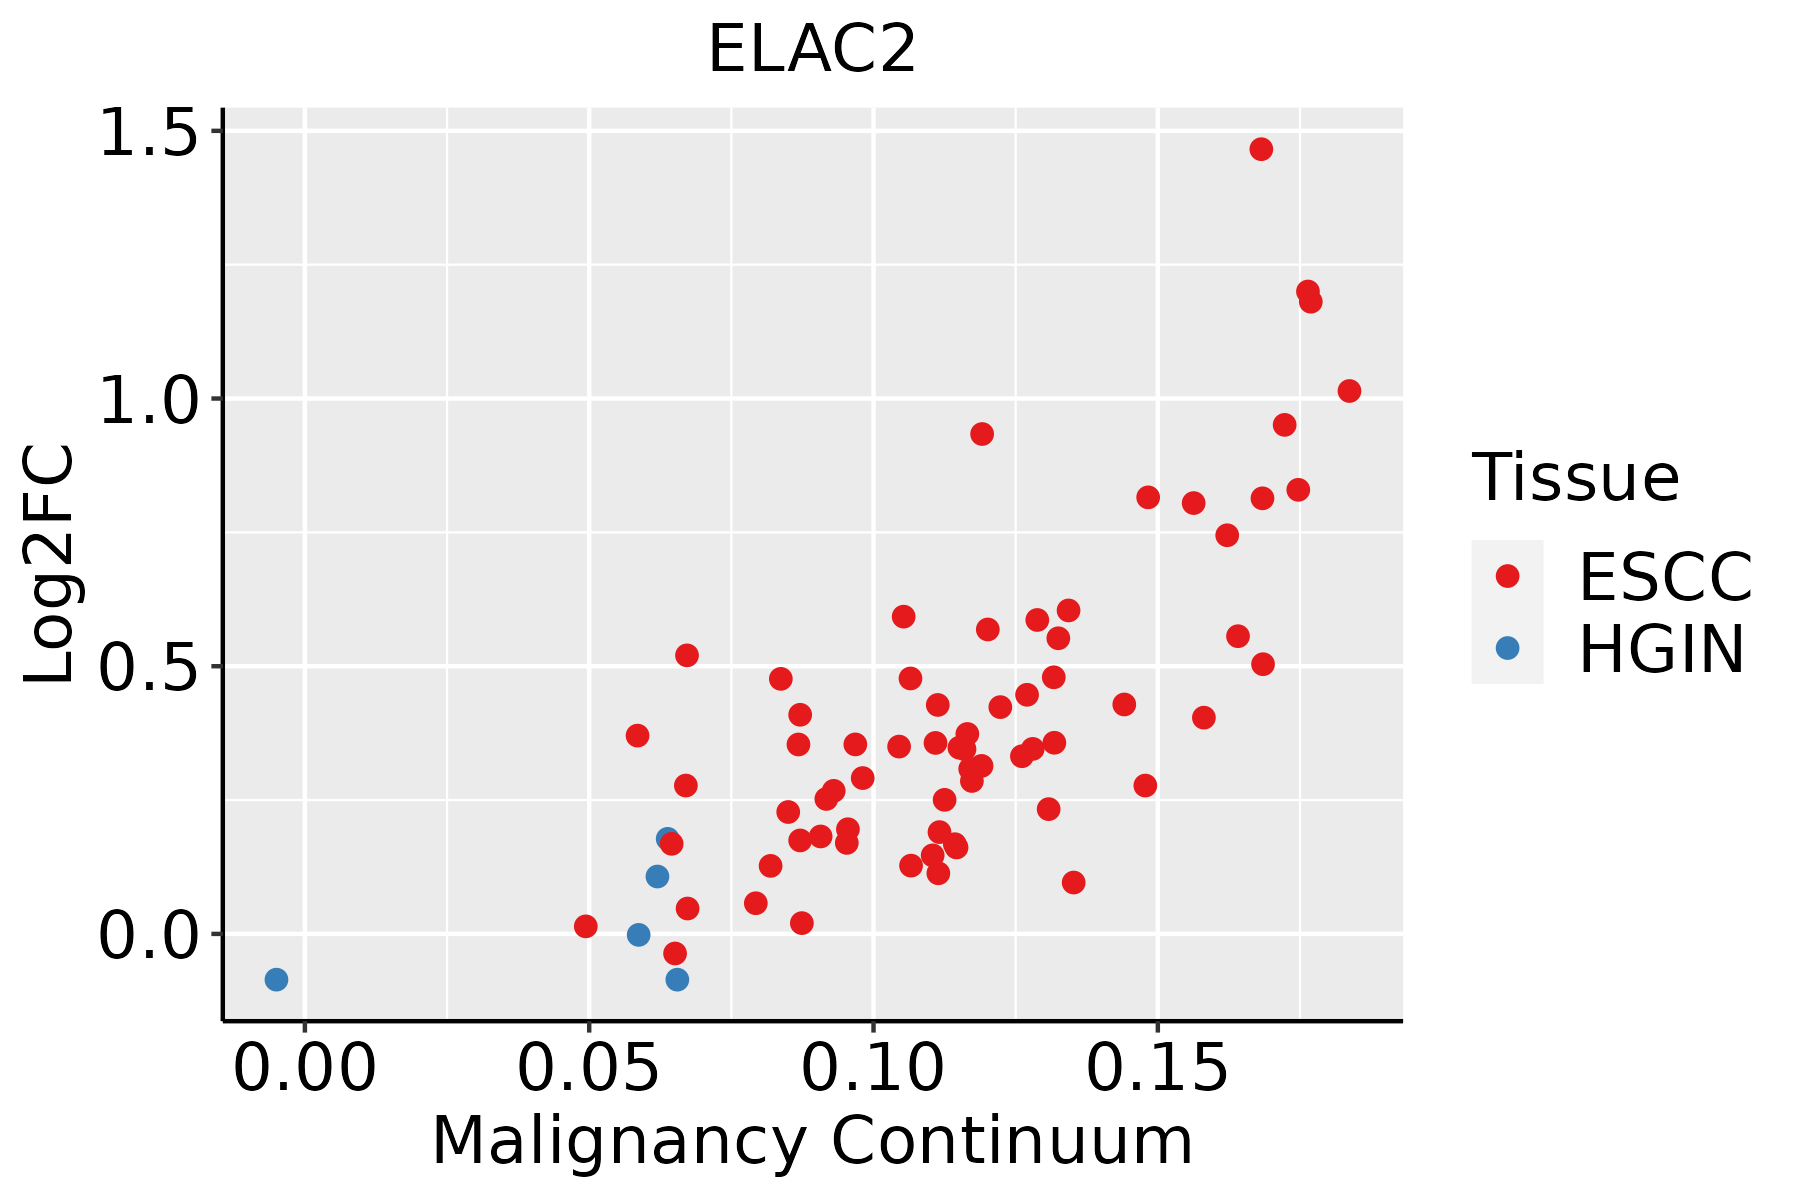 | ESCC: Esophageal squamous cell carcinoma |
| HGIN: High-grade intraepithelial neoplasias | ||
| LGIN: Low-grade intraepithelial neoplasias | ||
| Liver |  | HCC: Hepatocellular carcinoma |
| NAFLD: Non-alcoholic fatty liver disease | ||
| Oral Cavity | 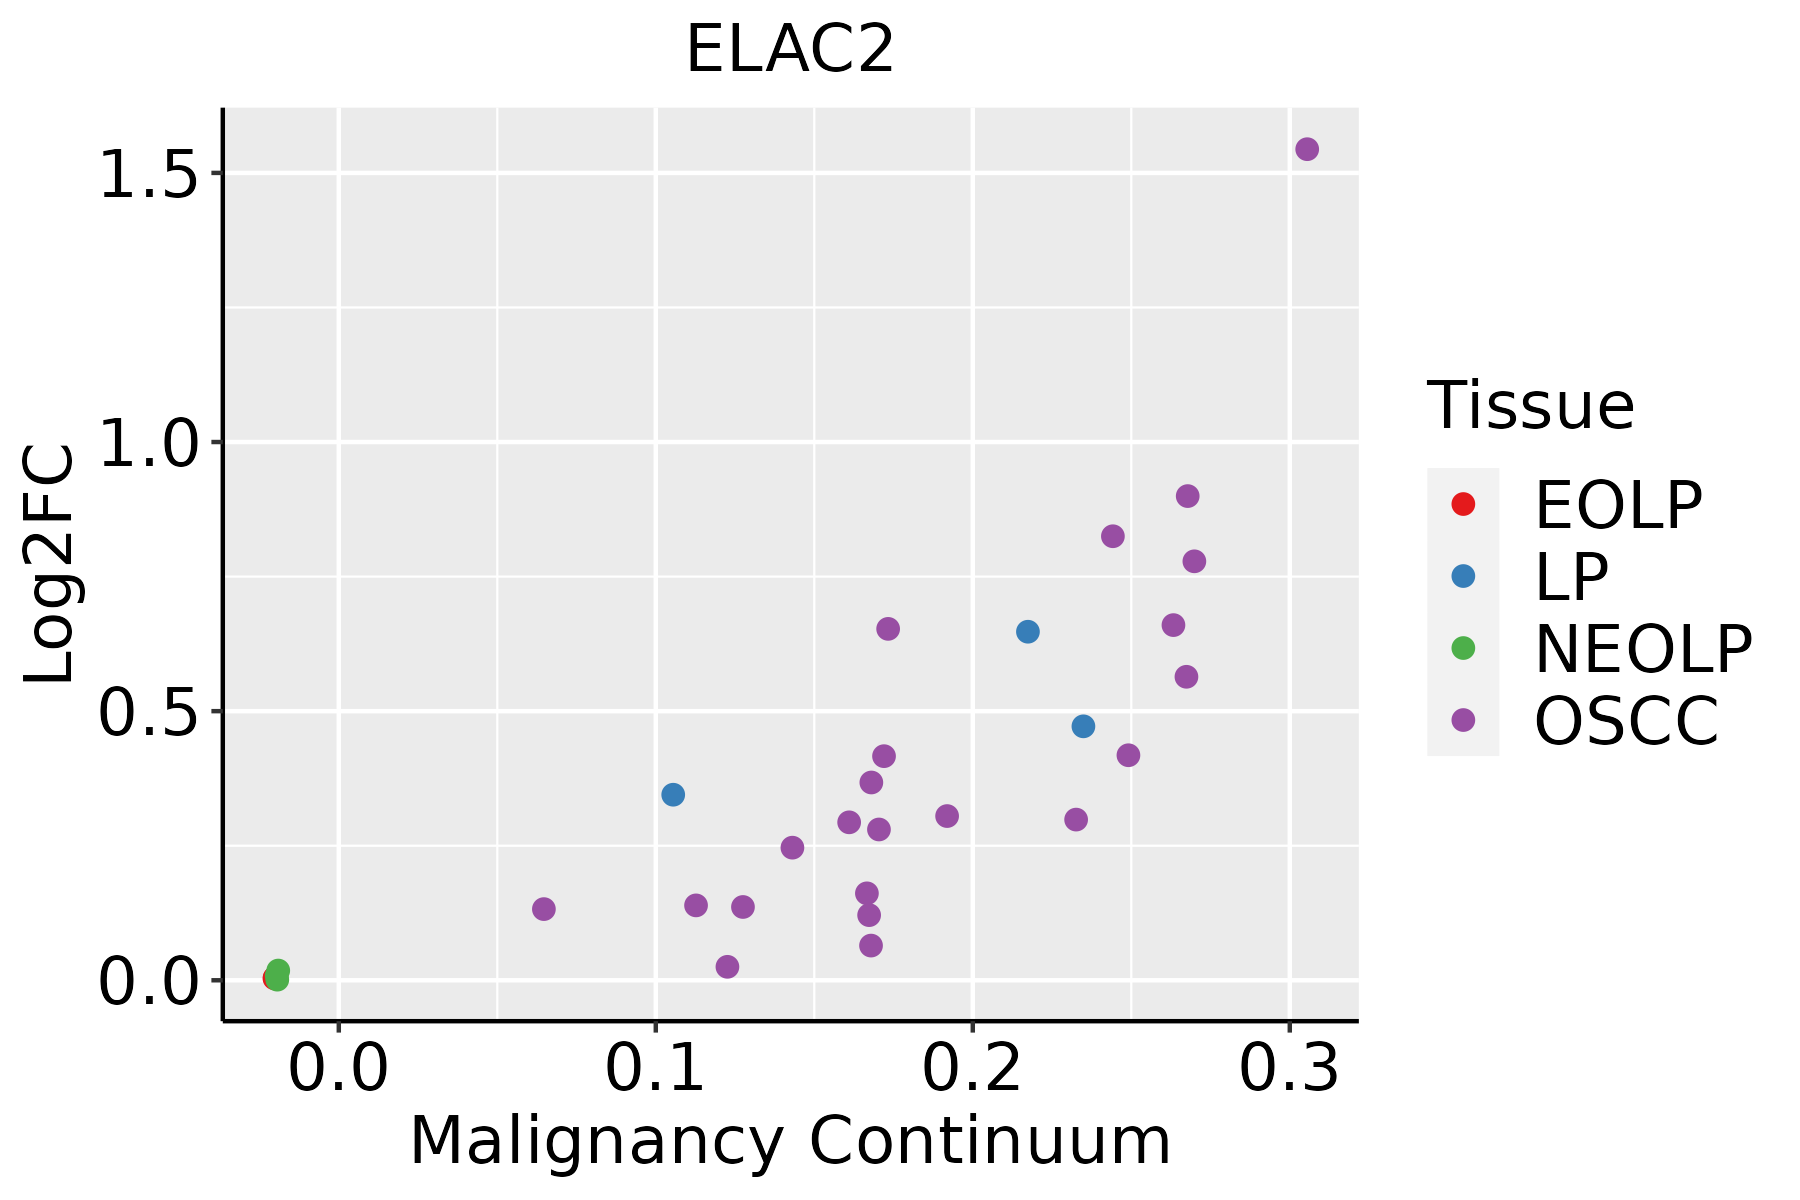 | EOLP: Erosive Oral lichen planus |
| LP: leukoplakia | ||
| NEOLP: Non-erosive oral lichen planus | ||
| OSCC: Oral squamous cell carcinoma | ||
| Skin | 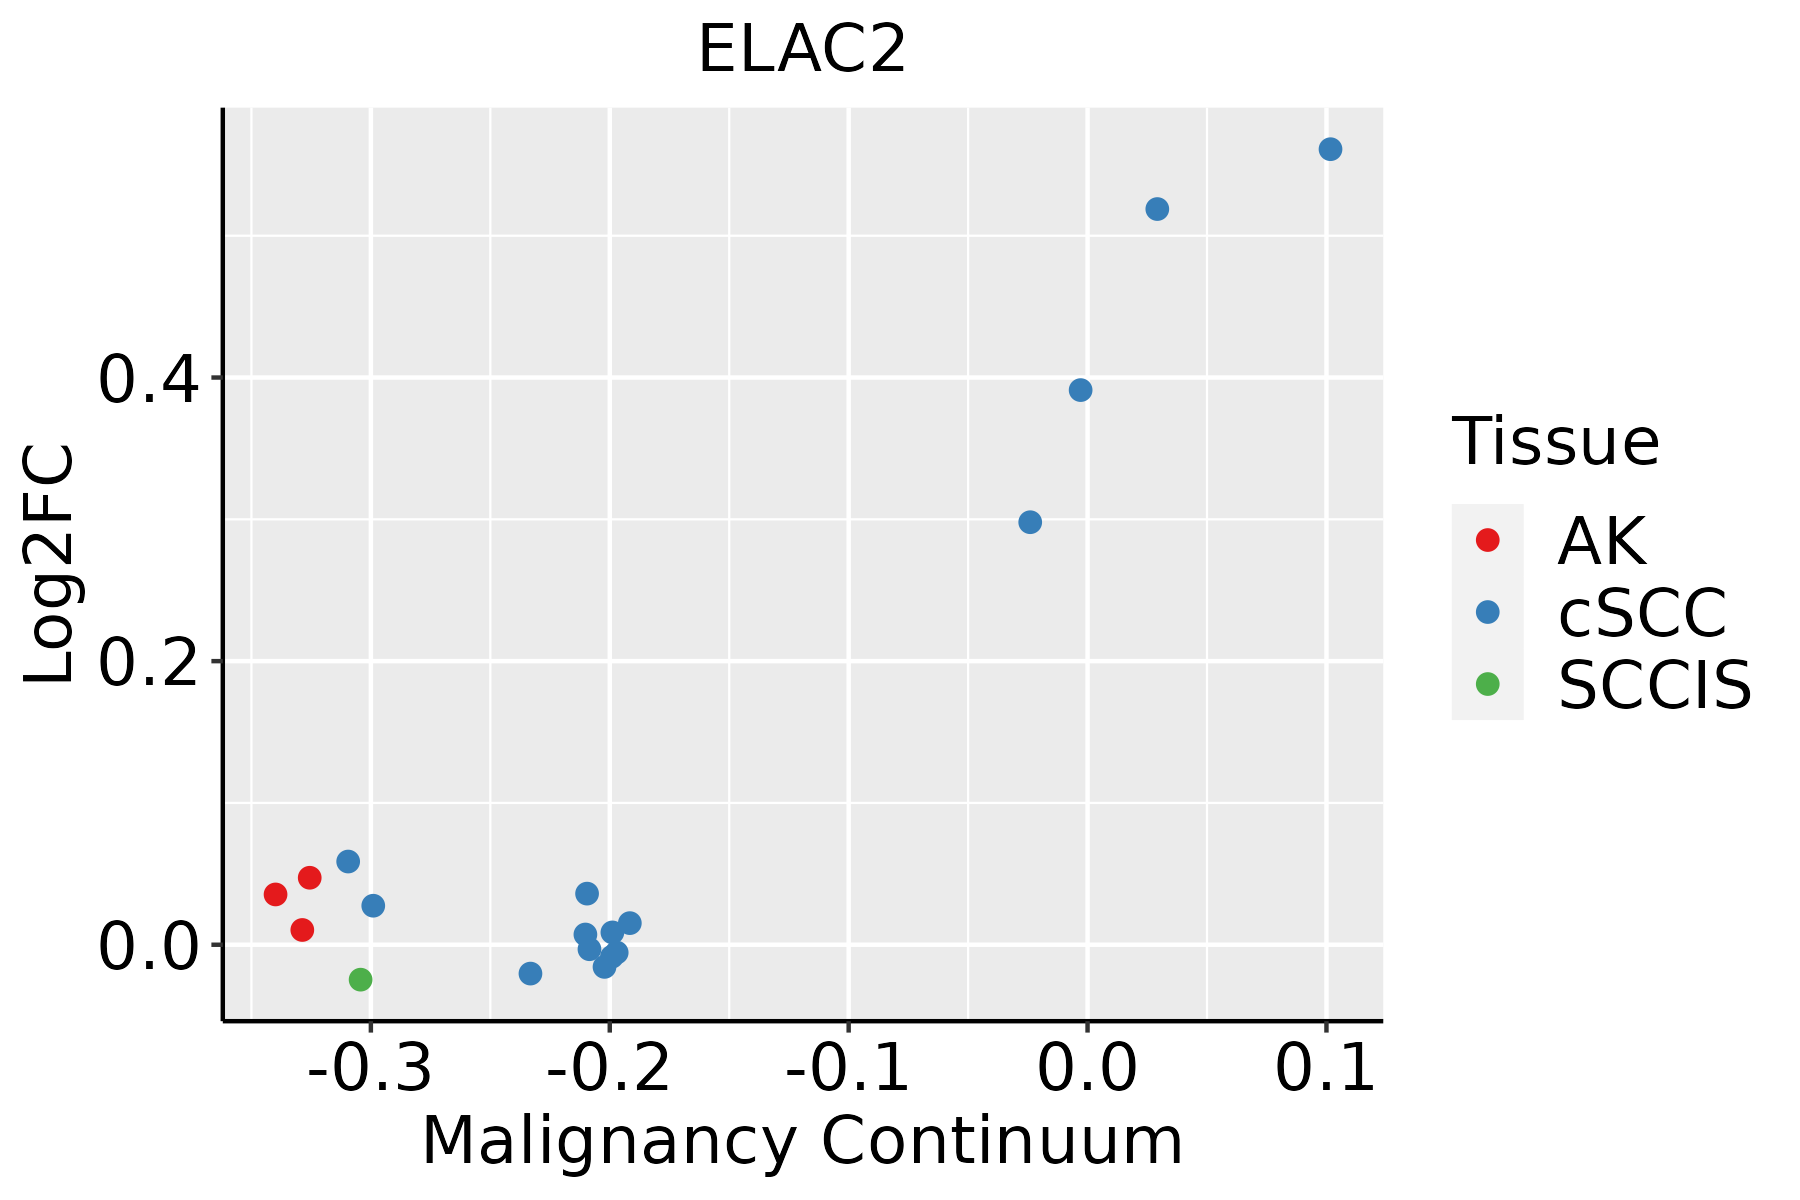 | AK: Actinic keratosis |
| cSCC: Cutaneous squamous cell carcinoma | ||
| SCCIS:squamous cell carcinoma in situ |
| ∗log2FC in expression of this searched gene in stem-like cells from each diseased tissue sample relative to stem-like cells in normal samples in each tissue plotted against the malignancy continuum. Samples are colored based on if they are from different disease stage. |
Top |
Malignant transformation related pathway analysis |
| Find out the enriched GO biological processes and KEGG pathways involved in transition from healthy to precancer to cancer |
| Tissue | Disease Stage | Enriched GO biological Processes |
| Colorectum | AD |  |
| Colorectum | SER |  |
| Colorectum | MSS |  |
| Colorectum | MSI-H |  |
| Colorectum | FAP |  |
| ∗Top 15 enriched GO BP terms are showed in the bar plot of each disease state in each tissue. Each row represents a significant GO biological process which is colored according to the -log10(p.adjust). |
| Page: 1 2 3 4 5 6 7 8 9 |
| GO ID | Tissue | Disease Stage | Description | Gene Ratio | Bg Ratio | pvalue | p.adjust | Count |
| GO:00344702 | Liver | HCC | ncRNA processing | 293/7958 | 395/18723 | 4.26e-38 | 6.76e-35 | 293 |
| GO:00346601 | Liver | HCC | ncRNA metabolic process | 332/7958 | 485/18723 | 1.48e-31 | 7.80e-29 | 332 |
| GO:004427021 | Liver | HCC | cellular nitrogen compound catabolic process | 303/7958 | 451/18723 | 9.76e-27 | 3.64e-24 | 303 |
| GO:004670021 | Liver | HCC | heterocycle catabolic process | 299/7958 | 445/18723 | 2.07e-26 | 7.29e-24 | 299 |
| GO:190136121 | Liver | HCC | organic cyclic compound catabolic process | 325/7958 | 495/18723 | 6.52e-26 | 2.18e-23 | 325 |
| GO:001943921 | Liver | HCC | aromatic compound catabolic process | 309/7958 | 467/18723 | 1.56e-25 | 4.94e-23 | 309 |
| GO:000640121 | Liver | HCC | RNA catabolic process | 201/7958 | 278/18723 | 3.88e-24 | 1.02e-21 | 201 |
| GO:003465521 | Liver | HCC | nucleobase-containing compound catabolic process | 273/7958 | 407/18723 | 4.84e-24 | 1.23e-21 | 273 |
| GO:01400531 | Liver | HCC | mitochondrial gene expression | 82/7958 | 108/18723 | 1.49e-12 | 7.20e-11 | 82 |
| GO:00905011 | Liver | HCC | RNA phosphodiester bond hydrolysis | 101/7958 | 152/18723 | 1.99e-09 | 5.63e-08 | 101 |
| GO:00311231 | Liver | HCC | RNA 3'-end processing | 81/7958 | 116/18723 | 2.27e-09 | 6.32e-08 | 81 |
| GO:0008033 | Liver | HCC | tRNA processing | 87/7958 | 127/18723 | 2.66e-09 | 7.23e-08 | 87 |
| GO:0090305 | Liver | HCC | nucleic acid phosphodiester bond hydrolysis | 152/7958 | 261/18723 | 1.90e-07 | 3.46e-06 | 152 |
| GO:0006399 | Liver | HCC | tRNA metabolic process | 108/7958 | 179/18723 | 1.07e-06 | 1.59e-05 | 108 |
| GO:00346611 | Liver | HCC | ncRNA catabolic process | 31/7958 | 43/18723 | 8.13e-05 | 7.19e-04 | 31 |
| GO:0090502 | Liver | HCC | RNA phosphodiester bond hydrolysis, endonucleolytic | 52/7958 | 82/18723 | 1.06e-04 | 9.08e-04 | 52 |
| GO:0000959 | Liver | HCC | mitochondrial RNA metabolic process | 30/7958 | 49/18723 | 6.31e-03 | 2.57e-02 | 30 |
| GO:0016078 | Liver | HCC | tRNA catabolic process | 10/7958 | 13/18723 | 1.28e-02 | 4.61e-02 | 10 |
| GO:00344709 | Oral cavity | OSCC | ncRNA processing | 263/7305 | 395/18723 | 4.38e-29 | 2.78e-26 | 263 |
| GO:00346605 | Oral cavity | OSCC | ncRNA metabolic process | 296/7305 | 485/18723 | 2.94e-23 | 6.65e-21 | 296 |
| Page: 1 2 3 4 5 |
| Pathway ID | Tissue | Disease Stage | Description | Gene Ratio | Bg Ratio | pvalue | p.adjust | qvalue | Count |
| Page: 1 |
Top |
Cell-cell communication analysis |
| Identification of potential cell-cell interactions between two cell types and their ligand-receptor pairs for different disease states |
| Ligand | Receptor | LRpair | Pathway | Tissue | Disease Stage |
| Page: 1 |
Top |
Single-cell gene regulatory network inference analysis |
| Find out the significant the regulons (TFs) and the target genes of each regulon across cell types for different disease states |
| TF | Cell Type | Tissue | Disease Stage | Target Gene | RSS | Regulon Activity |
| ∗The dot plots of a searched regulon are shown for all cell subpopulations in each disease state of each tissue based on the regulon specific score inferred using pySCENIC and by calculating the average expression. |
| Page: 1 |
Top |
Somatic mutation of malignant transformation related genes |
| Annotation of somatic variants for genes involved in malignant transformation |
| Hugo Symbol | Variant Class | Variant Classification | dbSNP RS | HGVSc | HGVSp | HGVSp Short | SWISSPROT | BIOTYPE | SIFT | PolyPhen | Tumor Sample Barcode | Tissue | Histology | Sex | Age | Stage | Therapy Types | Drugs | Outcome |
| ELAC2 | SNV | Missense_Mutation | rs756803645 | c.1142N>C | p.Arg381Pro | p.R381P | Q9BQ52 | protein_coding | deleterious(0.01) | probably_damaging(0.997) | TCGA-A8-A06R-01 | Breast | breast invasive carcinoma | Female | >=65 | I/II | Chemotherapy | 5-fluorouracil | CR |
| ELAC2 | SNV | Missense_Mutation | novel | c.701N>C | p.Val234Ala | p.V234A | Q9BQ52 | protein_coding | tolerated(0.85) | benign(0) | TCGA-AO-A128-01 | Breast | breast invasive carcinoma | Female | <65 | I/II | Chemotherapy | doxorubicin | SD |
| ELAC2 | SNV | Missense_Mutation | rs749460308 | c.1400C>T | p.Ala467Val | p.A467V | Q9BQ52 | protein_coding | tolerated(1) | benign(0) | TCGA-AR-A1AK-01 | Breast | breast invasive carcinoma | Female | >=65 | I/II | Hormone Therapy | anastrozole | SD |
| ELAC2 | SNV | Missense_Mutation | rs759606875 | c.2326G>C | p.Glu776Gln | p.E776Q | Q9BQ52 | protein_coding | tolerated(0.05) | possibly_damaging(0.867) | TCGA-BH-A5IZ-01 | Breast | breast invasive carcinoma | Female | <65 | I/II | Chemotherapy | adriamycin | CR |
| ELAC2 | SNV | Missense_Mutation | rs756803645 | c.1142N>C | p.Arg381Pro | p.R381P | Q9BQ52 | protein_coding | deleterious(0.01) | probably_damaging(0.997) | TCGA-C8-A12X-01 | Breast | breast invasive carcinoma | Female | <65 | I/II | Unknown | Unknown | SD |
| ELAC2 | insertion | In_Frame_Ins | novel | c.1409_1410insGCACAGGCTTTGGAA | p.Gly470_Pro471insHisArgLeuTrpAsn | p.G470_P471insHRLWN | Q9BQ52 | protein_coding | TCGA-A2-A0CT-01 | Breast | breast invasive carcinoma | Female | >=65 | I/II | Chemotherapy | cytoxan | SD | ||
| ELAC2 | insertion | Frame_Shift_Ins | novel | c.767_768insAAGTGATAAAATGGCCTCTTTTATCTGTGTTTGTCCCGCATGTC | p.Leu257SerfsTer68 | p.L257Sfs*68 | Q9BQ52 | protein_coding | TCGA-A7-A0CE-01 | Breast | breast invasive carcinoma | Female | <65 | I/II | Chemotherapy | adriamycin | SD | ||
| ELAC2 | insertion | Frame_Shift_Ins | novel | c.886_887insCTTGGTGGTTCACATG | p.Leu296ProfsTer24 | p.L296Pfs*24 | Q9BQ52 | protein_coding | TCGA-AO-A0JM-01 | Breast | breast invasive carcinoma | Female | <65 | I/II | Chemotherapy | doxorubicin | SD | ||
| ELAC2 | insertion | Frame_Shift_Ins | novel | c.884_885insCCAAGGAAAGGCAGATGCCCCCGTG | p.Glu295AspfsTer28 | p.E295Dfs*28 | Q9BQ52 | protein_coding | TCGA-AO-A0JM-01 | Breast | breast invasive carcinoma | Female | <65 | I/II | Chemotherapy | doxorubicin | SD | ||
| ELAC2 | insertion | Frame_Shift_Ins | novel | c.632_633insGATTG | p.Ser212IlefsTer32 | p.S212Ifs*32 | Q9BQ52 | protein_coding | TCGA-B6-A0RE-01 | Breast | breast invasive carcinoma | Female | <65 | I/II | Unknown | Unknown | SD |
| Page: 1 2 3 4 5 6 7 8 |
Top |
Related drugs of malignant transformation related genes |
| Identification of chemicals and drugs interact with genes involved in malignant transfromation |
| (DGIdb 4.0) |
| Entrez ID | Symbol | Category | Interaction Types | Drug Claim Name | Drug Name | PMIDs |
| Page: 1 |

Copyright 2023-Present -The University of Texas Health Science Center at Houston |