
|
|||||
|
 | |
| |
| |
| |
| |
| |
|
Gene: EIF2S3 |
Gene summary for EIF2S3 |
| Gene information | Species | Human | Gene symbol | EIF2S3 | Gene ID | 1968 |
| Gene name | eukaryotic translation initiation factor 2 subunit gamma | |
| Gene Alias | EIF2 | |
| Cytomap | Xp22.11 | |
| Gene Type | protein-coding | GO ID | GO:0001731 | UniProtAcc | P41091 |
Top |
Malignant transformation analysis |
| Identification of the aberrant gene expression in precancerous and cancerous lesions by comparing the gene expression of stem-like cells in diseased tissues with normal stem cells |
| Entrez ID | Symbol | Replicates | Species | Organ | Tissue | Adj P-value | Log2FC | Malignancy |
| 1968 | EIF2S3 | HTA11_1938_2000001011 | Human | Colorectum | AD | 6.44e-10 | 6.61e-01 | -0.0811 |
| 1968 | EIF2S3 | HTA11_78_2000001011 | Human | Colorectum | AD | 4.87e-02 | 4.19e-01 | -0.1088 |
| 1968 | EIF2S3 | HTA11_347_2000001011 | Human | Colorectum | AD | 7.47e-15 | 5.65e-01 | -0.1954 |
| 1968 | EIF2S3 | HTA11_1391_2000001011 | Human | Colorectum | AD | 9.28e-06 | 4.67e-01 | -0.059 |
| 1968 | EIF2S3 | HTA11_866_3004761011 | Human | Colorectum | AD | 5.30e-04 | 3.76e-01 | 0.096 |
| 1968 | EIF2S3 | HTA11_7663_2000001011 | Human | Colorectum | SER | 4.74e-02 | 5.18e-01 | 0.0131 |
| 1968 | EIF2S3 | HTA11_99999970781_79442 | Human | Colorectum | MSS | 1.92e-20 | 7.72e-01 | 0.294 |
| 1968 | EIF2S3 | HTA11_99999965062_69753 | Human | Colorectum | MSI-H | 2.44e-03 | 8.94e-01 | 0.3487 |
| 1968 | EIF2S3 | HTA11_99999965104_69814 | Human | Colorectum | MSS | 2.35e-20 | 1.23e+00 | 0.281 |
| 1968 | EIF2S3 | HTA11_99999971662_82457 | Human | Colorectum | MSS | 8.57e-18 | 8.45e-01 | 0.3859 |
| 1968 | EIF2S3 | HTA11_99999973899_84307 | Human | Colorectum | MSS | 3.79e-02 | 4.67e-01 | 0.2585 |
| 1968 | EIF2S3 | HTA11_99999974143_84620 | Human | Colorectum | MSS | 1.31e-04 | 3.39e-01 | 0.3005 |
| 1968 | EIF2S3 | A015-C-203 | Human | Colorectum | FAP | 8.02e-04 | -1.06e-01 | -0.1294 |
| 1968 | EIF2S3 | A002-C-114 | Human | Colorectum | FAP | 2.42e-02 | -1.59e-01 | -0.1561 |
| 1968 | EIF2S3 | A015-C-104 | Human | Colorectum | FAP | 1.87e-04 | -1.04e-01 | -0.1899 |
| 1968 | EIF2S3 | A002-C-116 | Human | Colorectum | FAP | 2.37e-06 | -1.39e-01 | -0.0452 |
| 1968 | EIF2S3 | AEH-subject1 | Human | Endometrium | AEH | 2.63e-07 | -3.28e-01 | -0.3059 |
| 1968 | EIF2S3 | AEH-subject2 | Human | Endometrium | AEH | 1.53e-10 | -2.62e-01 | -0.2525 |
| 1968 | EIF2S3 | AEH-subject3 | Human | Endometrium | AEH | 7.34e-06 | -2.47e-01 | -0.2576 |
| 1968 | EIF2S3 | AEH-subject4 | Human | Endometrium | AEH | 2.31e-04 | -9.44e-02 | -0.2657 |
| Page: 1 2 3 4 5 6 7 8 |
| Tissue | Expression Dynamics | Abbreviation |
| Colorectum (GSE201348) |  | FAP: Familial adenomatous polyposis |
| CRC: Colorectal cancer | ||
| Colorectum (HTA11) |  | AD: Adenomas |
| SER: Sessile serrated lesions | ||
| MSI-H: Microsatellite-high colorectal cancer | ||
| MSS: Microsatellite stable colorectal cancer | ||
| Endometrium | 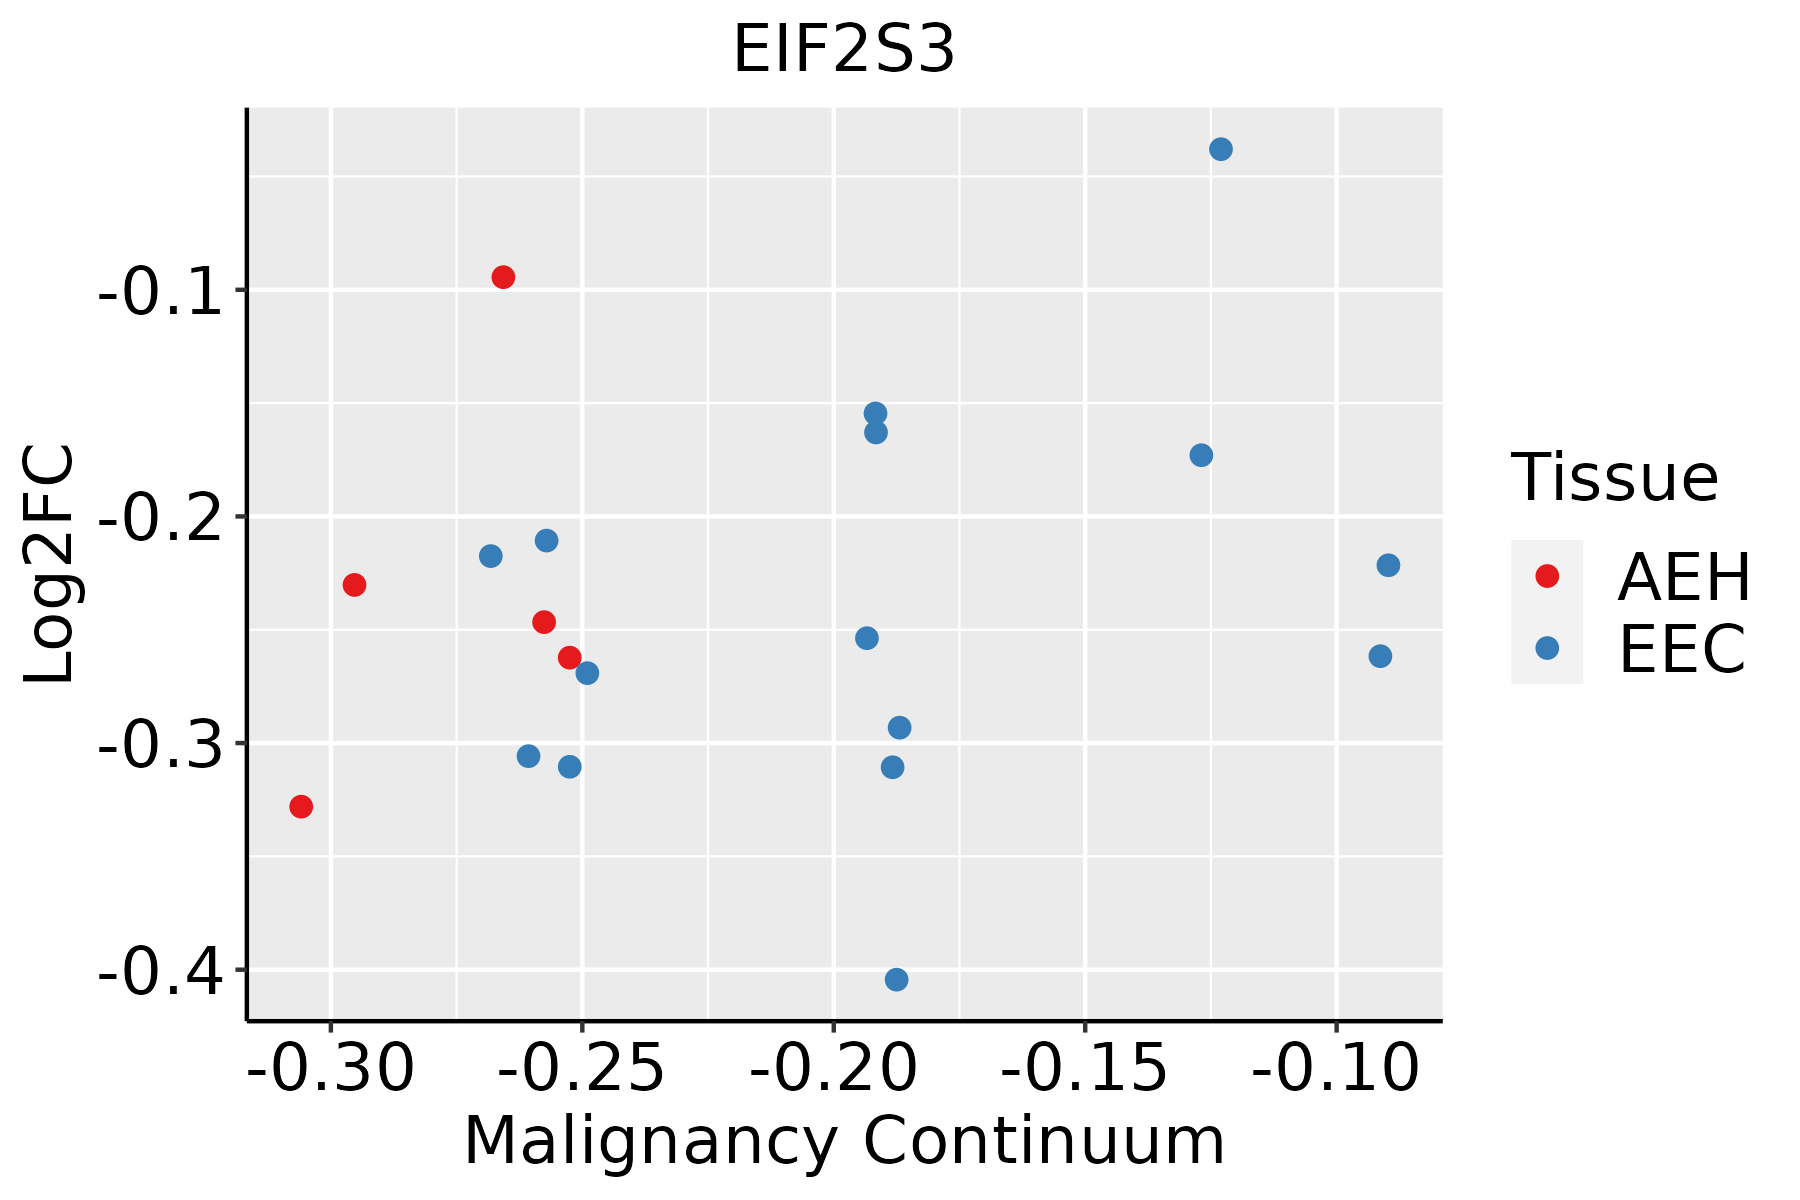 | AEH: Atypical endometrial hyperplasia |
| EEC: Endometrioid Cancer | ||
| Esophagus | 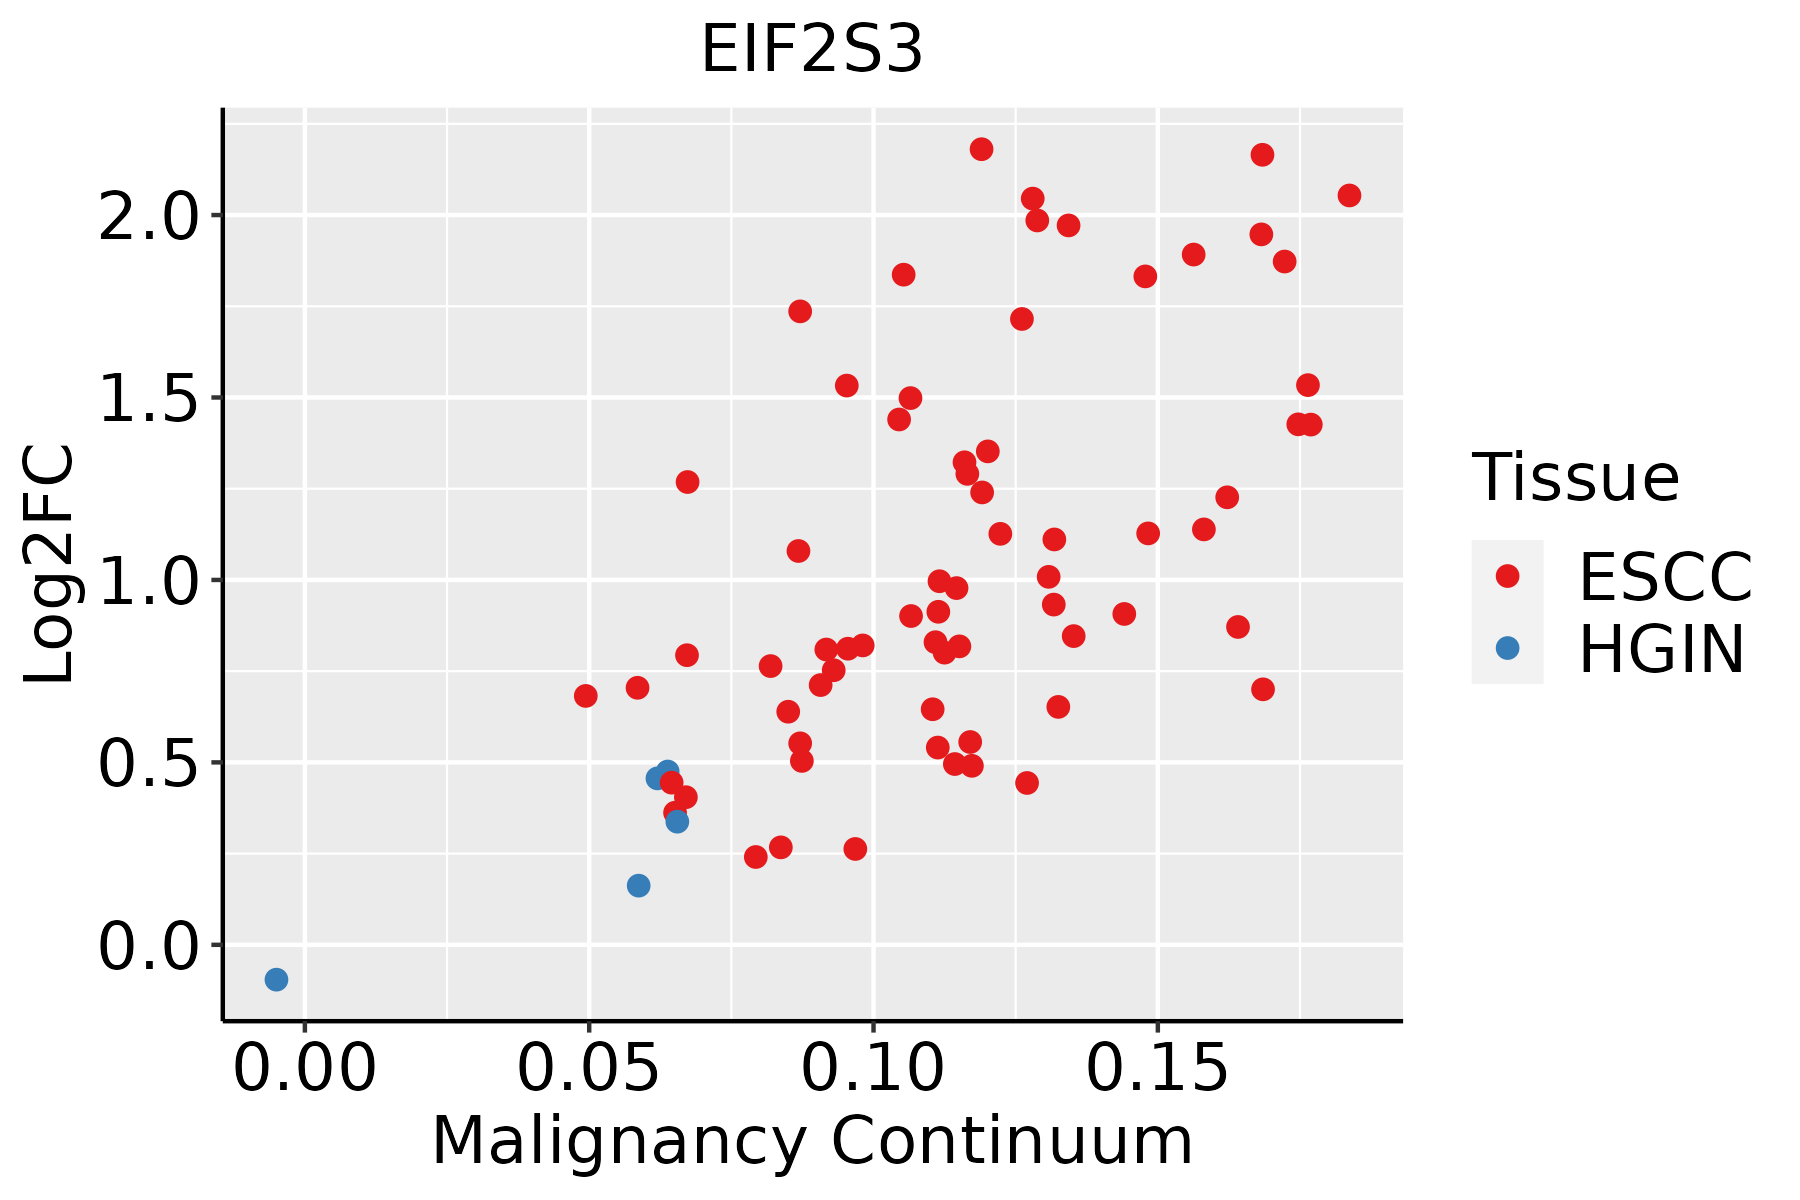 | ESCC: Esophageal squamous cell carcinoma |
| HGIN: High-grade intraepithelial neoplasias | ||
| LGIN: Low-grade intraepithelial neoplasias | ||
| Liver | 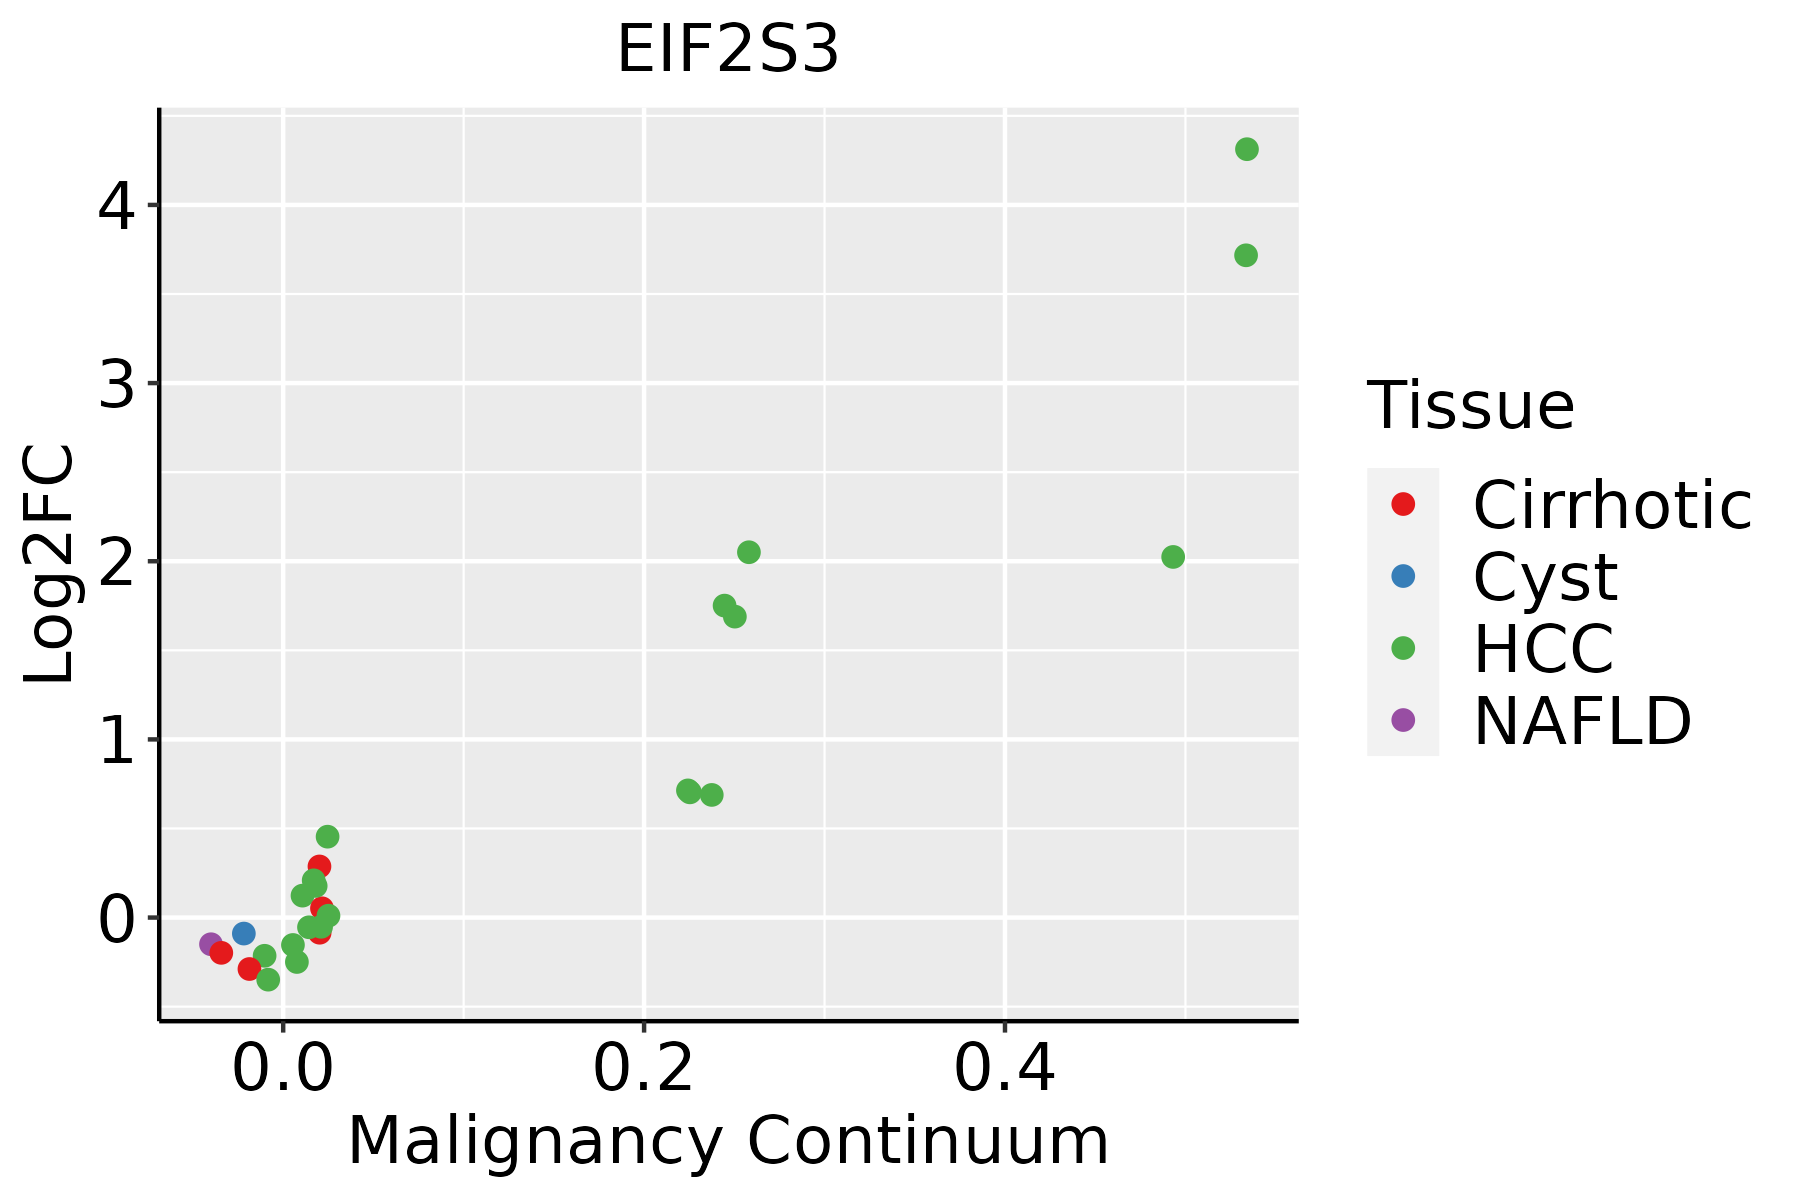 | HCC: Hepatocellular carcinoma |
| NAFLD: Non-alcoholic fatty liver disease | ||
| Oral Cavity | 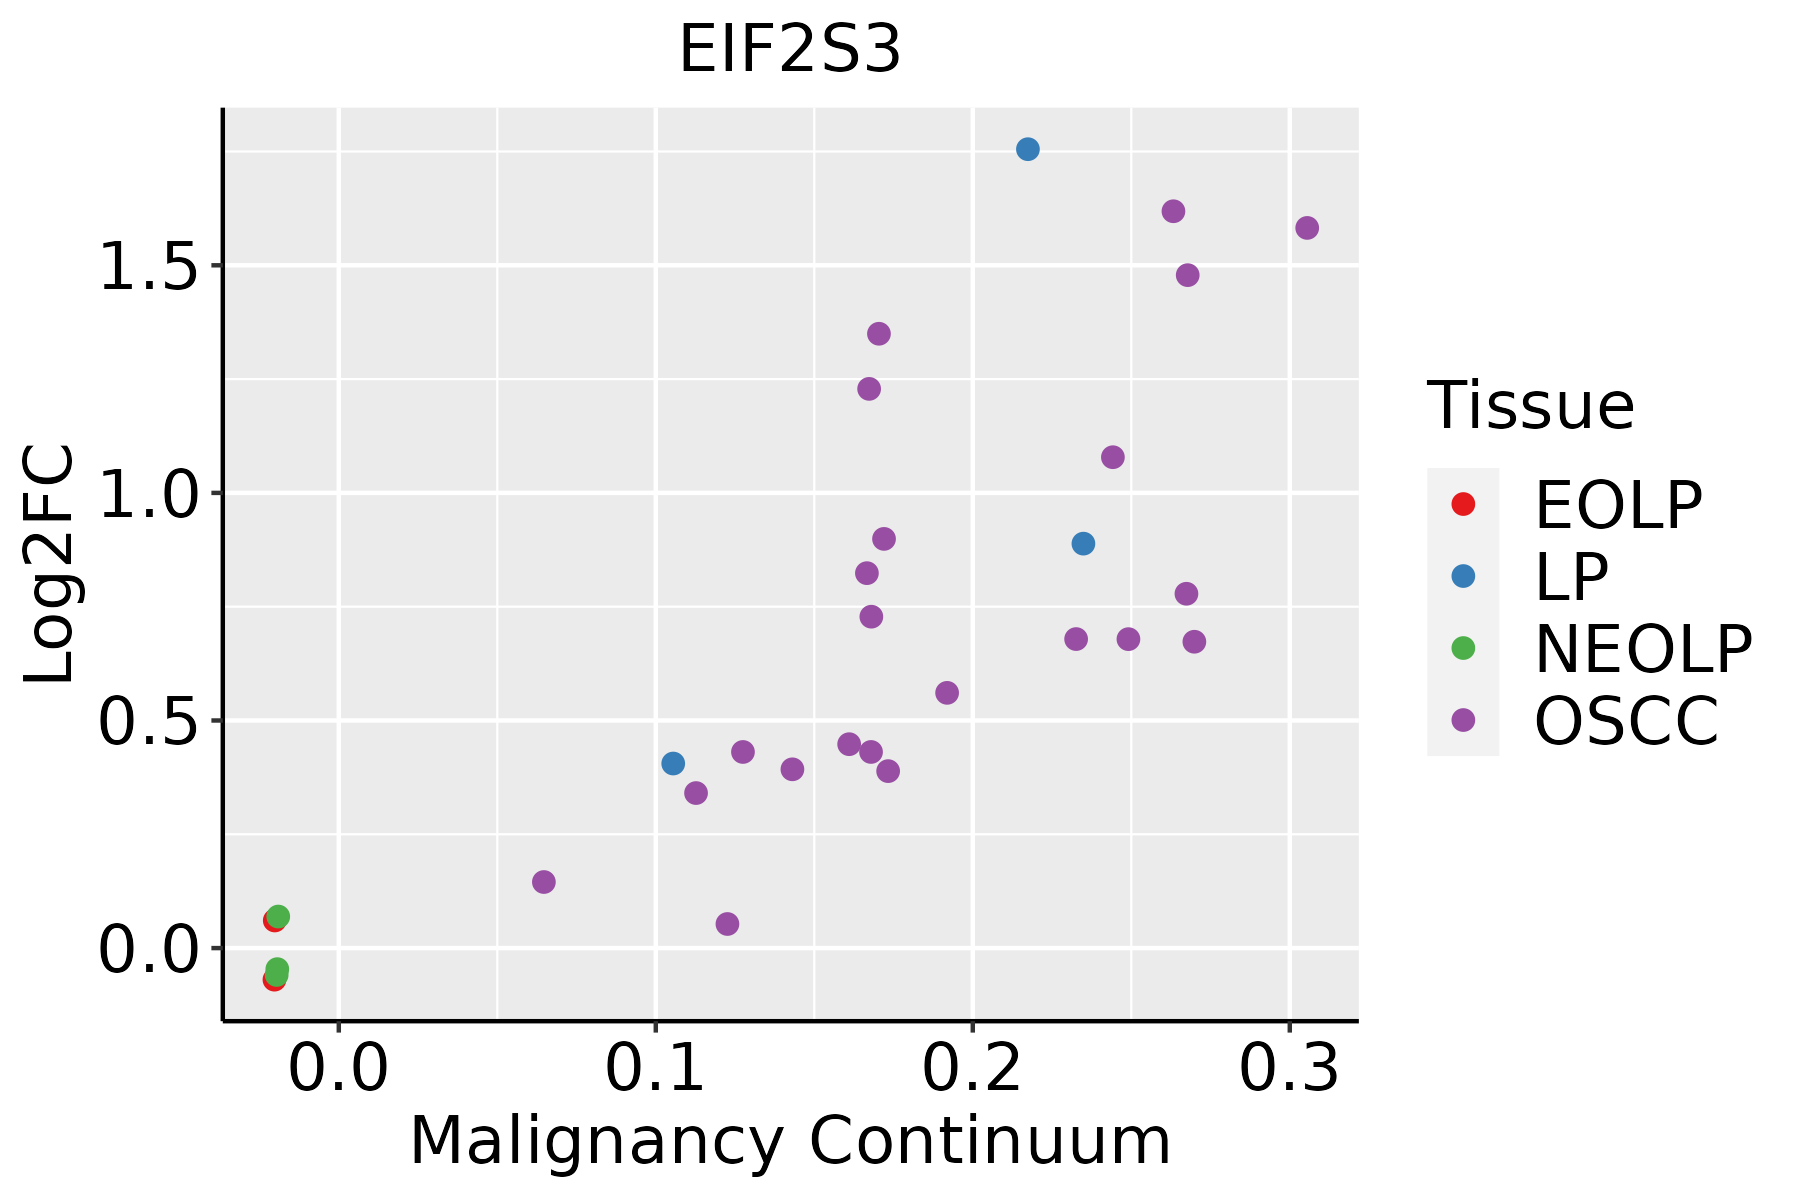 | EOLP: Erosive Oral lichen planus |
| LP: leukoplakia | ||
| NEOLP: Non-erosive oral lichen planus | ||
| OSCC: Oral squamous cell carcinoma | ||
| Skin | 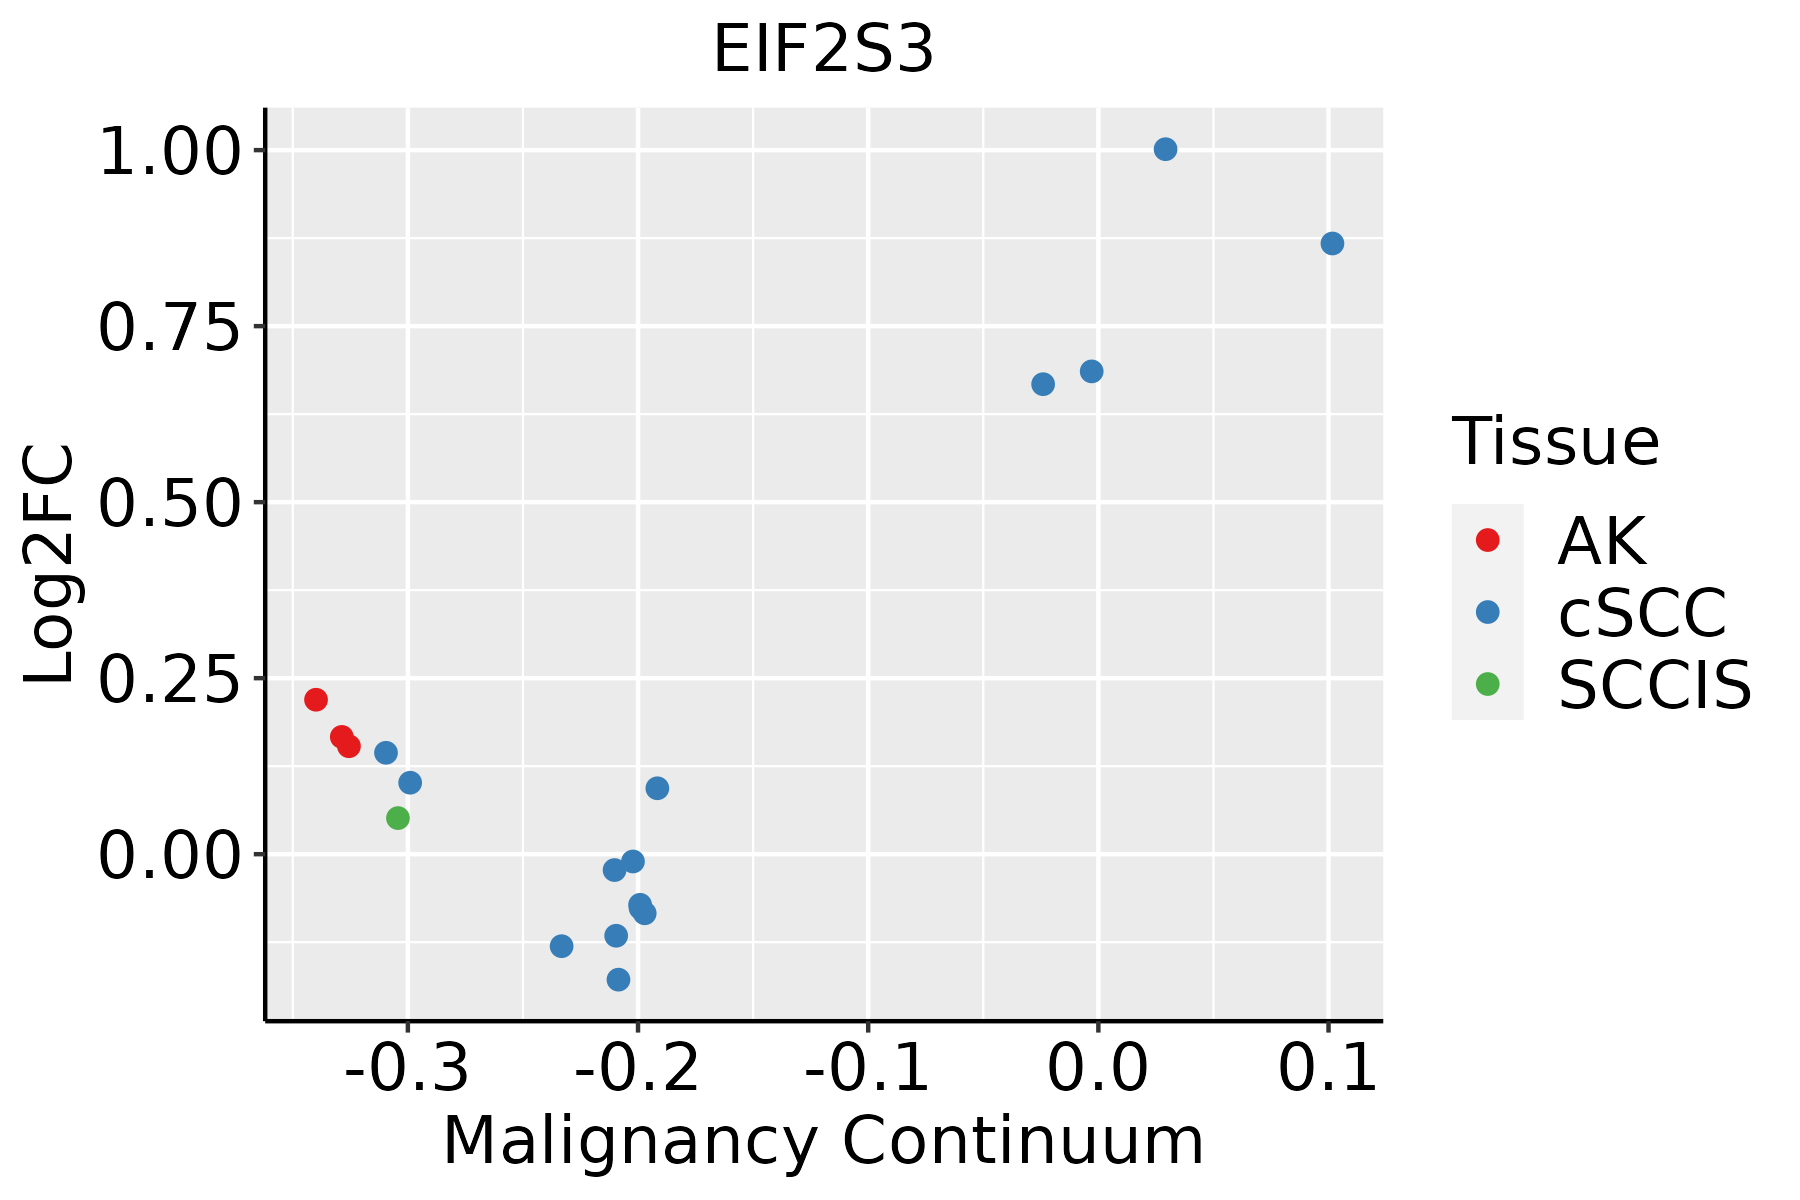 | AK: Actinic keratosis |
| cSCC: Cutaneous squamous cell carcinoma | ||
| SCCIS:squamous cell carcinoma in situ | ||
| Thyroid | 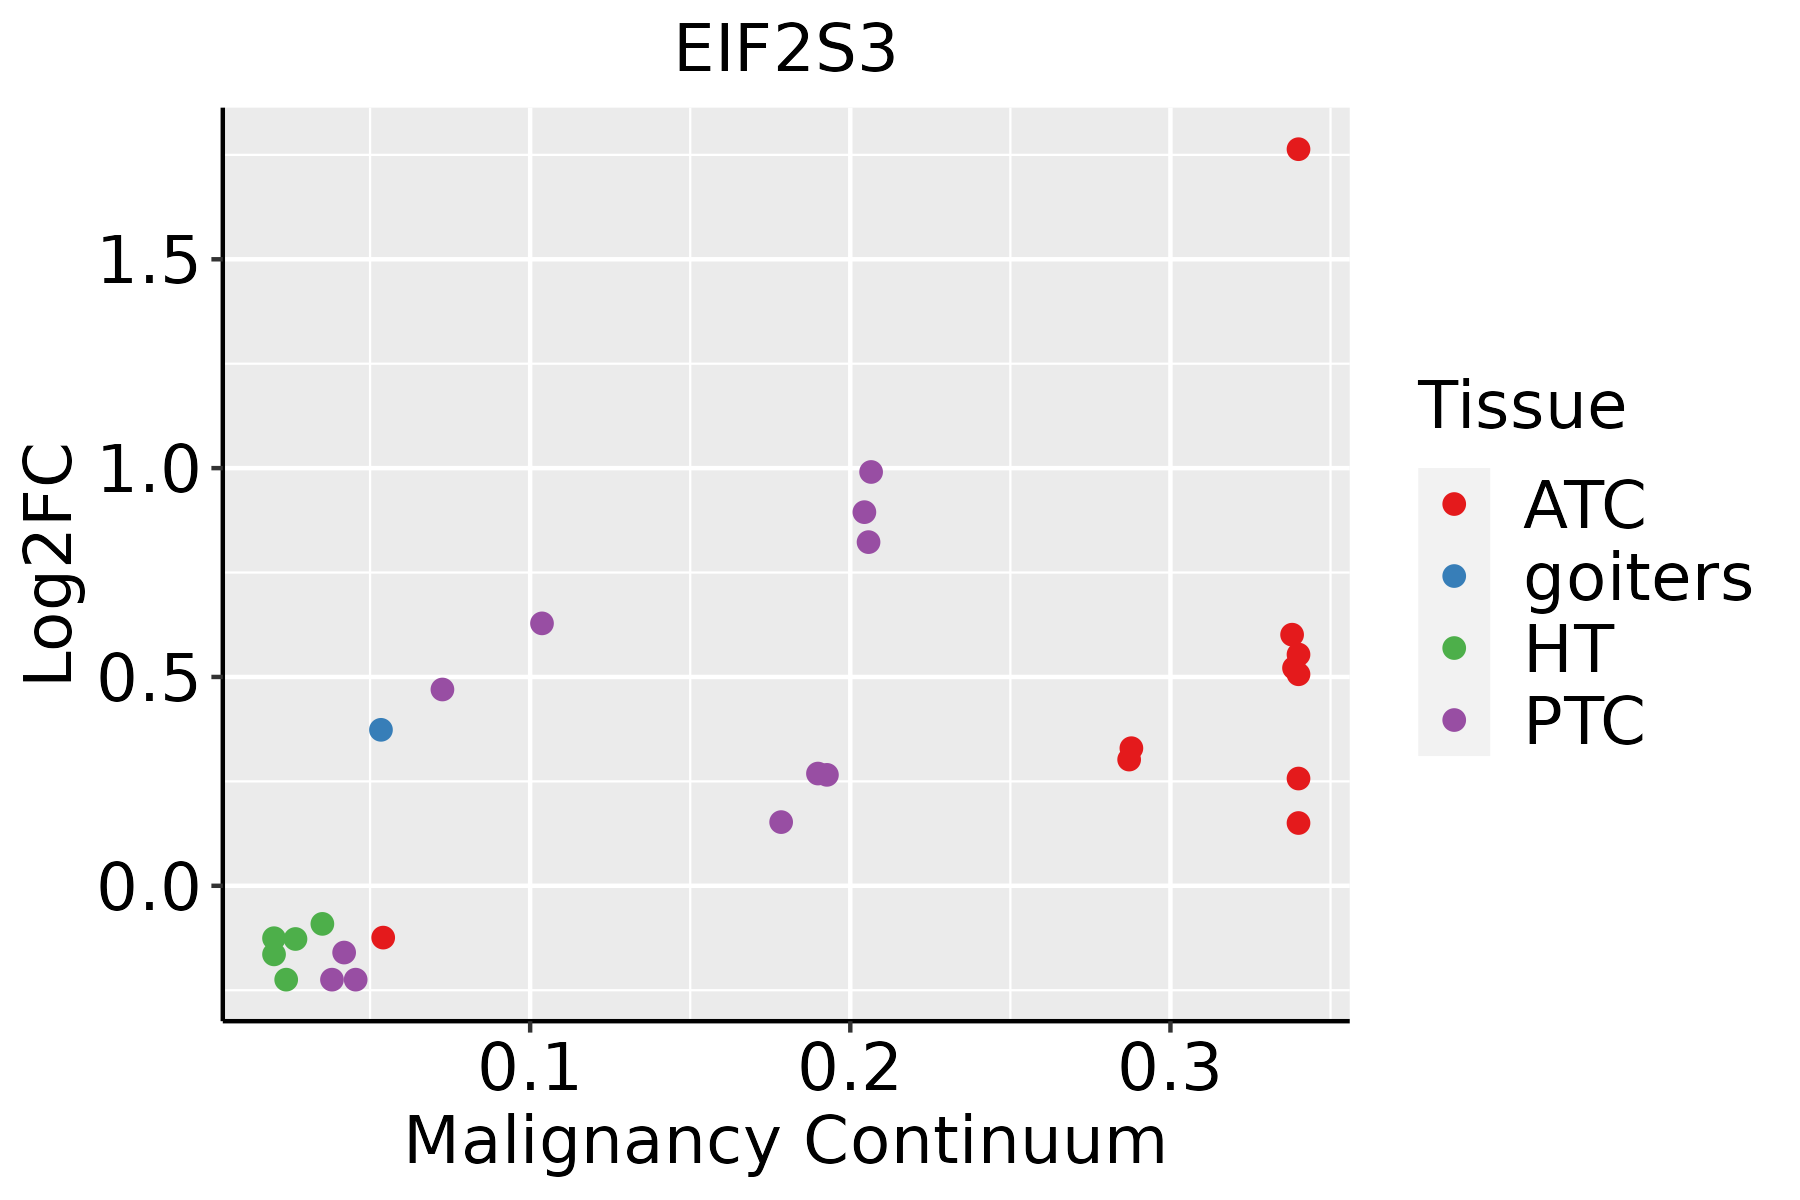 | ATC: Anaplastic thyroid cancer |
| HT: Hashimoto's thyroiditis | ||
| PTC: Papillary thyroid cancer |
| ∗log2FC in expression of this searched gene in stem-like cells from each diseased tissue sample relative to stem-like cells in normal samples in each tissue plotted against the malignancy continuum. Samples are colored based on if they are from different disease stage. |
Top |
Malignant transformation related pathway analysis |
| Find out the enriched GO biological processes and KEGG pathways involved in transition from healthy to precancer to cancer |
| Tissue | Disease Stage | Enriched GO biological Processes |
| Colorectum | AD |  |
| Colorectum | SER |  |
| Colorectum | MSS |  |
| Colorectum | MSI-H |  |
| Colorectum | FAP |  |
| ∗Top 15 enriched GO BP terms are showed in the bar plot of each disease state in each tissue. Each row represents a significant GO biological process which is colored according to the -log10(p.adjust). |
| Page: 1 2 3 4 5 6 7 8 9 |
| GO ID | Tissue | Disease Stage | Description | Gene Ratio | Bg Ratio | pvalue | p.adjust | Count |
| GO:00021812 | Colorectum | MSS | cytoplasmic translation | 108/3467 | 148/18723 | 1.78e-47 | 1.11e-43 | 108 |
| GO:00718262 | Colorectum | MSS | ribonucleoprotein complex subunit organization | 90/3467 | 227/18723 | 6.88e-14 | 1.78e-11 | 90 |
| GO:00226182 | Colorectum | MSS | ribonucleoprotein complex assembly | 88/3467 | 220/18723 | 7.12e-14 | 1.78e-11 | 88 |
| GO:00226132 | Colorectum | MSS | ribonucleoprotein complex biogenesis | 144/3467 | 463/18723 | 2.76e-11 | 3.67e-09 | 144 |
| GO:00021832 | Colorectum | MSS | cytoplasmic translational initiation | 21/3467 | 34/18723 | 2.99e-08 | 1.67e-06 | 21 |
| GO:00064172 | Colorectum | MSS | regulation of translation | 134/3467 | 468/18723 | 4.43e-08 | 2.38e-06 | 134 |
| GO:00064132 | Colorectum | MSS | translational initiation | 43/3467 | 118/18723 | 3.19e-06 | 9.38e-05 | 43 |
| GO:00342502 | Colorectum | MSS | positive regulation of cellular amide metabolic process | 51/3467 | 162/18723 | 4.70e-05 | 8.60e-04 | 51 |
| GO:00457272 | Colorectum | MSS | positive regulation of translation | 43/3467 | 136/18723 | 1.60e-04 | 2.29e-03 | 43 |
| GO:00017312 | Colorectum | MSS | formation of translation preinitiation complex | 7/3467 | 11/18723 | 1.21e-03 | 1.17e-02 | 7 |
| GO:00021813 | Colorectum | MSI-H | cytoplasmic translation | 100/1319 | 148/18723 | 1.50e-79 | 8.31e-76 | 100 |
| GO:00226183 | Colorectum | MSI-H | ribonucleoprotein complex assembly | 62/1319 | 220/18723 | 7.13e-22 | 8.32e-19 | 62 |
| GO:00718263 | Colorectum | MSI-H | ribonucleoprotein complex subunit organization | 63/1319 | 227/18723 | 8.08e-22 | 8.32e-19 | 63 |
| GO:00226133 | Colorectum | MSI-H | ribonucleoprotein complex biogenesis | 95/1319 | 463/18723 | 1.04e-21 | 8.32e-19 | 95 |
| GO:00064133 | Colorectum | MSI-H | translational initiation | 37/1319 | 118/18723 | 3.18e-15 | 8.83e-13 | 37 |
| GO:00021833 | Colorectum | MSI-H | cytoplasmic translational initiation | 19/1319 | 34/18723 | 7.60e-14 | 1.84e-11 | 19 |
| GO:00064173 | Colorectum | MSI-H | regulation of translation | 73/1319 | 468/18723 | 9.89e-11 | 1.66e-08 | 73 |
| GO:00457273 | Colorectum | MSI-H | positive regulation of translation | 33/1319 | 136/18723 | 2.28e-10 | 3.60e-08 | 33 |
| GO:00342503 | Colorectum | MSI-H | positive regulation of cellular amide metabolic process | 34/1319 | 162/18723 | 7.07e-09 | 8.93e-07 | 34 |
| GO:00017313 | Colorectum | MSI-H | formation of translation preinitiation complex | 6/1319 | 11/18723 | 4.10e-05 | 1.51e-03 | 6 |
| Page: 1 2 3 4 5 6 7 8 9 |
| Pathway ID | Tissue | Disease Stage | Description | Gene Ratio | Bg Ratio | pvalue | p.adjust | qvalue | Count |
| Page: 1 |
Top |
Cell-cell communication analysis |
| Identification of potential cell-cell interactions between two cell types and their ligand-receptor pairs for different disease states |
| Ligand | Receptor | LRpair | Pathway | Tissue | Disease Stage |
| Page: 1 |
Top |
Single-cell gene regulatory network inference analysis |
| Find out the significant the regulons (TFs) and the target genes of each regulon across cell types for different disease states |
| TF | Cell Type | Tissue | Disease Stage | Target Gene | RSS | Regulon Activity |
| ∗The dot plots of a searched regulon are shown for all cell subpopulations in each disease state of each tissue based on the regulon specific score inferred using pySCENIC and by calculating the average expression. |
| Page: 1 |
Top |
Somatic mutation of malignant transformation related genes |
| Annotation of somatic variants for genes involved in malignant transformation |
| Hugo Symbol | Variant Class | Variant Classification | dbSNP RS | HGVSc | HGVSp | HGVSp Short | SWISSPROT | BIOTYPE | SIFT | PolyPhen | Tumor Sample Barcode | Tissue | Histology | Sex | Age | Stage | Therapy Types | Drugs | Outcome |
| EIF2S3 | SNV | Missense_Mutation | c.760C>A | p.Pro254Thr | p.P254T | P41091 | protein_coding | deleterious(0) | possibly_damaging(0.606) | TCGA-AR-A0TY-01 | Breast | breast invasive carcinoma | Female | <65 | I/II | Unspecific | Paclitaxel | PD | |
| EIF2S3 | SNV | Missense_Mutation | c.757G>A | p.Glu253Lys | p.E253K | P41091 | protein_coding | tolerated(0.21) | benign(0) | TCGA-E9-A1R4-01 | Breast | breast invasive carcinoma | Female | >=65 | I/II | Chemotherapy | 5-fluorouracil | SD | |
| EIF2S3 | SNV | Missense_Mutation | c.1108N>A | p.Glu370Lys | p.E370K | P41091 | protein_coding | tolerated(0.09) | benign(0.019) | TCGA-DS-A1OC-01 | Cervix | cervical & endocervical cancer | Female | <65 | I/II | Chemotherapy | gemcitabine | SD | |
| EIF2S3 | SNV | Missense_Mutation | novel | c.521N>C | p.Leu174Pro | p.L174P | P41091 | protein_coding | deleterious(0) | probably_damaging(0.996) | TCGA-AA-3947-01 | Colorectum | colon adenocarcinoma | Female | <65 | I/II | Unknown | Unknown | SD |
| EIF2S3 | SNV | Missense_Mutation | c.1189N>G | p.Lys397Glu | p.K397E | P41091 | protein_coding | deleterious(0.03) | possibly_damaging(0.772) | TCGA-CA-6718-01 | Colorectum | colon adenocarcinoma | Male | <65 | I/II | Unknown | Unknown | PD | |
| EIF2S3 | SNV | Missense_Mutation | c.728T>C | p.Ile243Thr | p.I243T | P41091 | protein_coding | deleterious(0) | benign(0.182) | TCGA-AG-3885-01 | Colorectum | rectum adenocarcinoma | Female | >=65 | III/IV | Ancillary | zoledronic | SD | |
| EIF2S3 | SNV | Missense_Mutation | novel | c.1190A>G | p.Lys397Arg | p.K397R | P41091 | protein_coding | deleterious(0.05) | benign(0.151) | TCGA-AG-A002-01 | Colorectum | rectum adenocarcinoma | Male | <65 | I/II | Unknown | Unknown | SD |
| EIF2S3 | SNV | Missense_Mutation | c.1003N>A | p.Gly335Ser | p.G335S | P41091 | protein_coding | deleterious(0.05) | possibly_damaging(0.641) | TCGA-F5-6814-01 | Colorectum | rectum adenocarcinoma | Male | <65 | I/II | Unknown | Unknown | SD | |
| EIF2S3 | insertion | Frame_Shift_Ins | novel | c.1321dupA | p.Ile441AsnfsTer4 | p.I441Nfs*4 | P41091 | protein_coding | TCGA-AA-3966-01 | Colorectum | colon adenocarcinoma | Female | >=65 | I/II | Unknown | Unknown | SD | ||
| EIF2S3 | SNV | Missense_Mutation | novel | c.311C>T | p.Ser104Phe | p.S104F | P41091 | protein_coding | deleterious(0.04) | possibly_damaging(0.786) | TCGA-A5-A1OF-01 | Endometrium | uterine corpus endometrioid carcinoma | Female | <65 | I/II | Unknown | Unknown | SD |
| Page: 1 2 3 4 |
Top |
Related drugs of malignant transformation related genes |
| Identification of chemicals and drugs interact with genes involved in malignant transfromation |
| (DGIdb 4.0) |
| Entrez ID | Symbol | Category | Interaction Types | Drug Claim Name | Drug Name | PMIDs |
| Page: 1 |

Copyright 2023-Present -The University of Texas Health Science Center at Houston |