Schematic overview of the cellular and molecular mechanisms involved in the cancer progression, including the proposed cellular and molecular mechanisms in cancer cells trajectory. AT1: alveolar type 1 cells; AT2: alveolar type 2 cells; AAH: atypical adenomatous hyperplasia; AIS: adenocarcinoma in situ; MIA: minimally invasive adenocarcinoma; IA: invasive adenocarcinoma; EMT: epithelial-mesenchymal transition

Home

Download

Statistics

Help

Contact

Center for Computational Systems Medicine
leaf

Gene summary

leaf

Malignant transformation analysis

leaf

Malignant transformation related pathway analysis

leaf

Cell-cell communication analysis

leaf

Single-cell gene regulatory network inference analysis

leaf

Somatic mutation of malignant transformation related genes

leaf

Related drugs of malignant transformation related genes

Gene: DOCK5

Gene summary for DOCK5

check button Gene summary.

Gene informationSpeciesHuman
Gene symbol

DOCK5

Gene ID

80005

Gene namededicator of cytokinesis 5
Gene AliasDOCK5
Cytomap8p21.2
Gene Typeprotein-coding
GO ID

GO:0000902

UniProtAcc

B9A015


Top

Malignant transformation analysis

check button Identification of the aberrant gene expression in precancerous and cancerous lesions by comparing the gene expression of stem-like cells in diseased tissues with normal stem cells
check button Malignant transformation involving gene list.
Entrez IDSymbolReplicatesSpeciesOrganTissueAdj P-valueLog2FCMalignancy
80005DOCK5HTA11_3410_2000001011HumanColorectumAD1.40e-19-6.06e-010.0155
80005DOCK5HTA11_347_2000001011HumanColorectumAD1.15e-126.09e-01-0.1954
80005DOCK5HTA11_411_2000001011HumanColorectumSER1.98e-037.91e-01-0.2602
80005DOCK5HTA11_866_3004761011HumanColorectumAD4.24e-10-4.60e-010.096
80005DOCK5HTA11_8622_2000001021HumanColorectumSER1.60e-03-6.47e-010.0528
80005DOCK5HTA11_99999970781_79442HumanColorectumMSS1.21e-05-3.52e-010.294
80005DOCK5HTA11_99999965104_69814HumanColorectumMSS1.84e-09-5.84e-010.281
80005DOCK5HTA11_99999971662_82457HumanColorectumMSS2.06e-17-5.92e-010.3859
80005DOCK5HTA11_99999973899_84307HumanColorectumMSS3.00e-04-5.32e-010.2585
80005DOCK5HTA11_99999974143_84620HumanColorectumMSS3.79e-22-5.61e-010.3005
80005DOCK5F007HumanColorectumFAP2.38e-03-4.21e-010.1176
80005DOCK5A015-C-203HumanColorectumFAP1.63e-36-5.05e-01-0.1294
80005DOCK5A015-C-204HumanColorectumFAP6.33e-05-3.36e-01-0.0228
80005DOCK5A014-C-040HumanColorectumFAP6.25e-07-6.59e-01-0.1184
80005DOCK5A002-C-201HumanColorectumFAP1.17e-13-3.44e-010.0324
80005DOCK5A002-C-203HumanColorectumFAP1.87e-03-1.56e-010.2786
80005DOCK5A001-C-119HumanColorectumFAP2.89e-11-5.00e-01-0.1557
80005DOCK5A001-C-108HumanColorectumFAP5.45e-20-2.92e-01-0.0272
80005DOCK5A002-C-205HumanColorectumFAP2.48e-24-4.71e-01-0.1236
80005DOCK5A001-C-104HumanColorectumFAP2.57e-02-1.72e-010.0184
Page: 1 2 3 4 5 6 7 8 

check button Transcriptomic changes along malignancy continuum.
TissueExpression DynamicsAbbreviation
Colorectum (GSE201348)The image shows the transcriptomic changes along malignancy continuum.log2FC in expression of this searched gene in stem-like cells from each diseased tissue sample relative to stem-like cells in normal samples in each tissue plotted against the malignancy continuum. Samples are colored based on if they are from different disease stage.FAP: Familial adenomatous polyposis
CRC: Colorectal cancer
Colorectum (HTA11)The image shows the transcriptomic changes along malignancy continuum.log2FC in expression of this searched gene in stem-like cells from each diseased tissue sample relative to stem-like cells in normal samples in each tissue plotted against the malignancy continuum. Samples are colored based on if they are from different disease stage.AD: Adenomas
SER: Sessile serrated lesions
MSI-H: Microsatellite-high colorectal cancer
MSS: Microsatellite stable colorectal cancer
EndometriumThe image shows the transcriptomic changes along malignancy continuum.log2FC in expression of this searched gene in stem-like cells from each diseased tissue sample relative to stem-like cells in normal samples in each tissue plotted against the malignancy continuum. Samples are colored based on if they are from different disease stage.
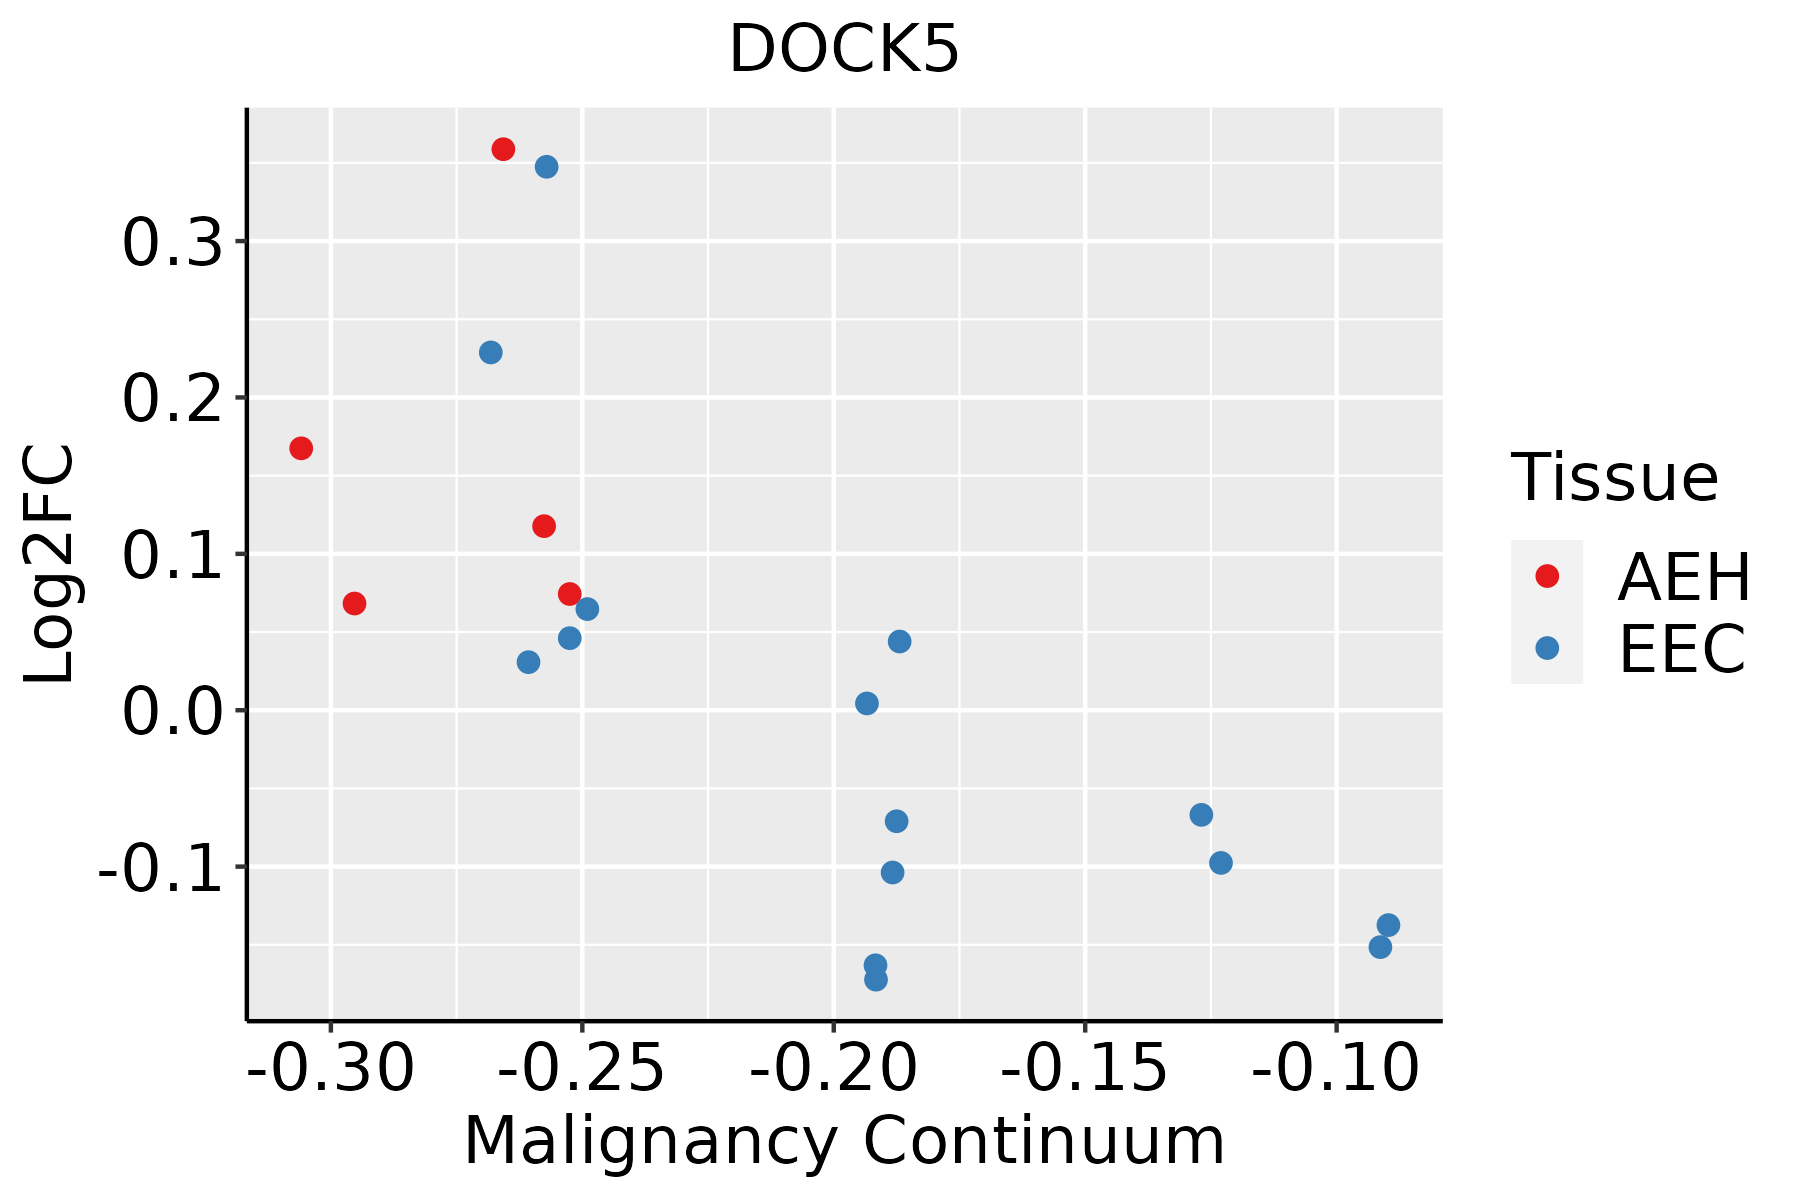
AEH: Atypical endometrial hyperplasia
EEC: Endometrioid Cancer
EsophagusThe image shows the transcriptomic changes along malignancy continuum.log2FC in expression of this searched gene in stem-like cells from each diseased tissue sample relative to stem-like cells in normal samples in each tissue plotted against the malignancy continuum. Samples are colored based on if they are from different disease stage.
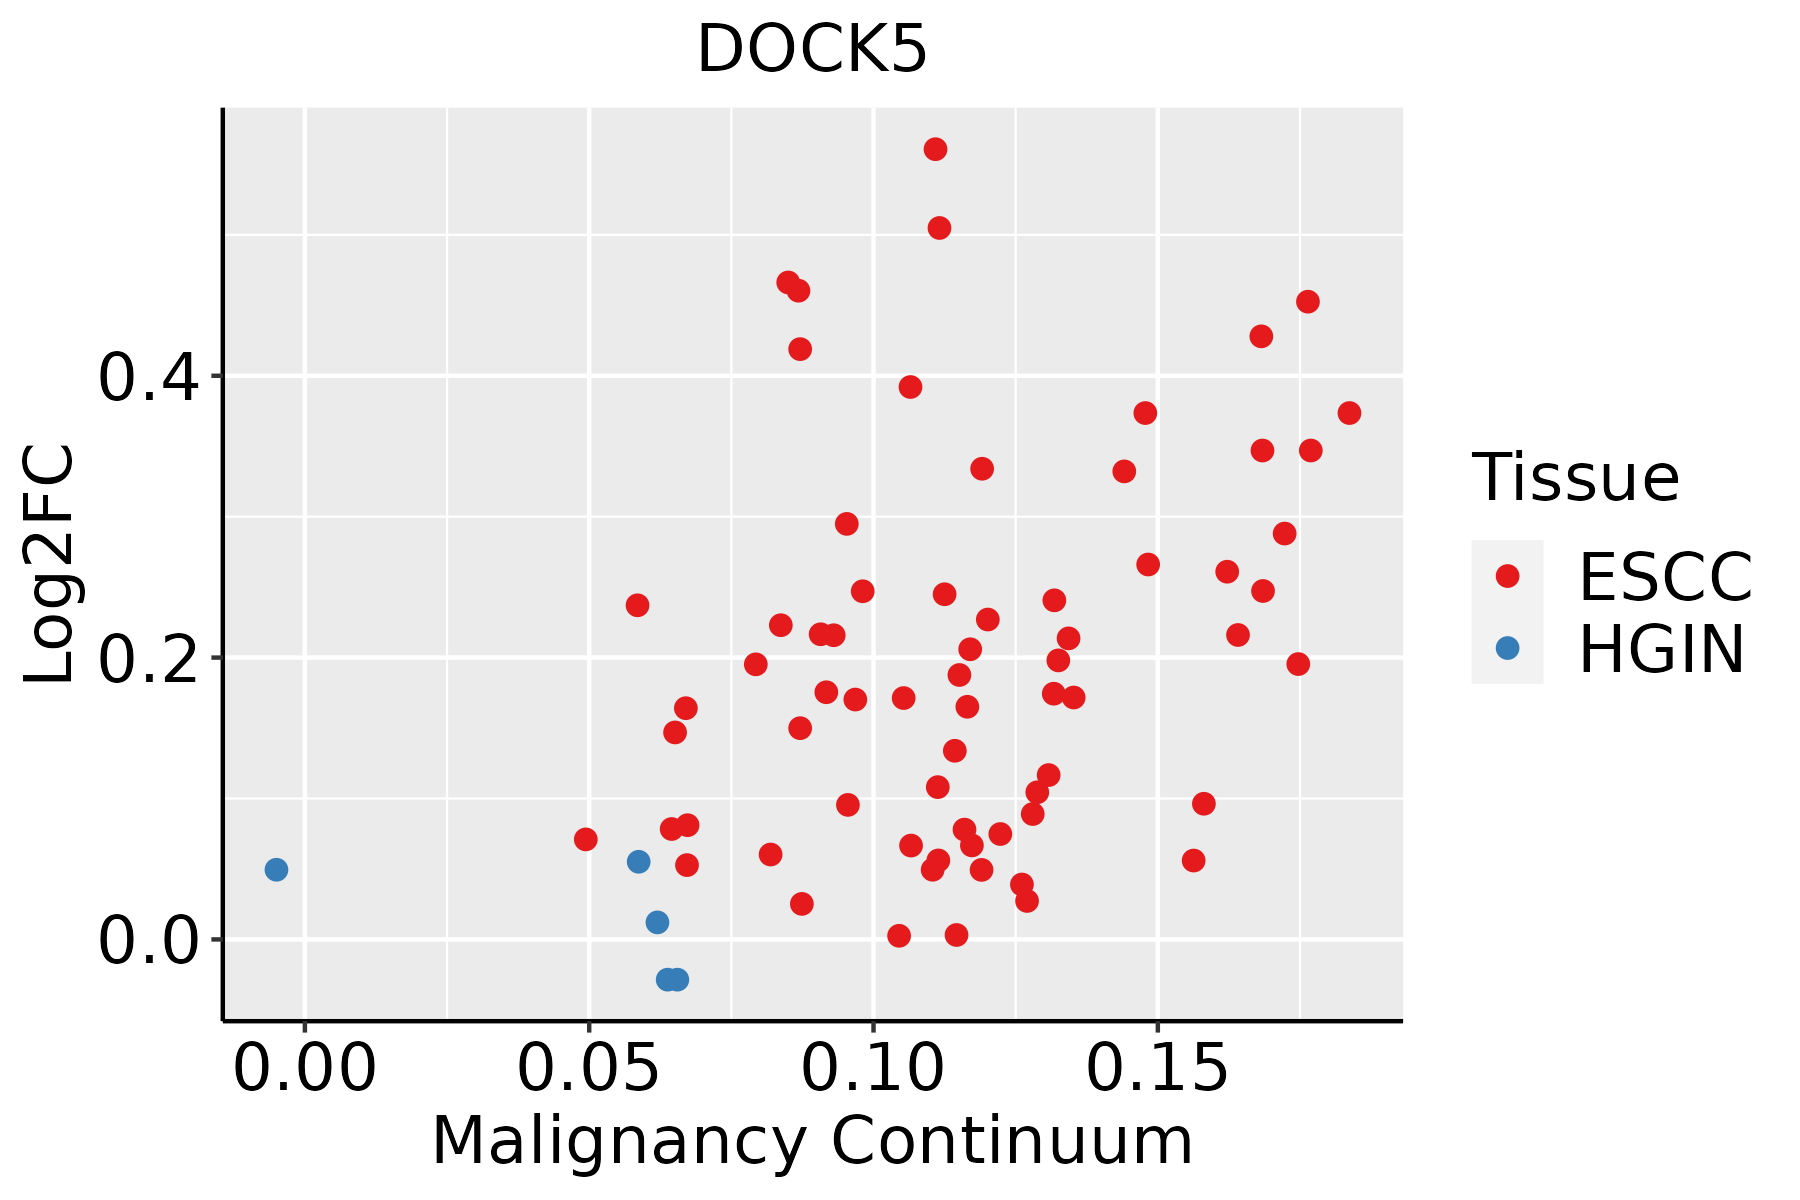
ESCC: Esophageal squamous cell carcinoma
HGIN: High-grade intraepithelial neoplasias
LGIN: Low-grade intraepithelial neoplasias
LiverThe image shows the transcriptomic changes along malignancy continuum.log2FC in expression of this searched gene in stem-like cells from each diseased tissue sample relative to stem-like cells in normal samples in each tissue plotted against the malignancy continuum. Samples are colored based on if they are from different disease stage.
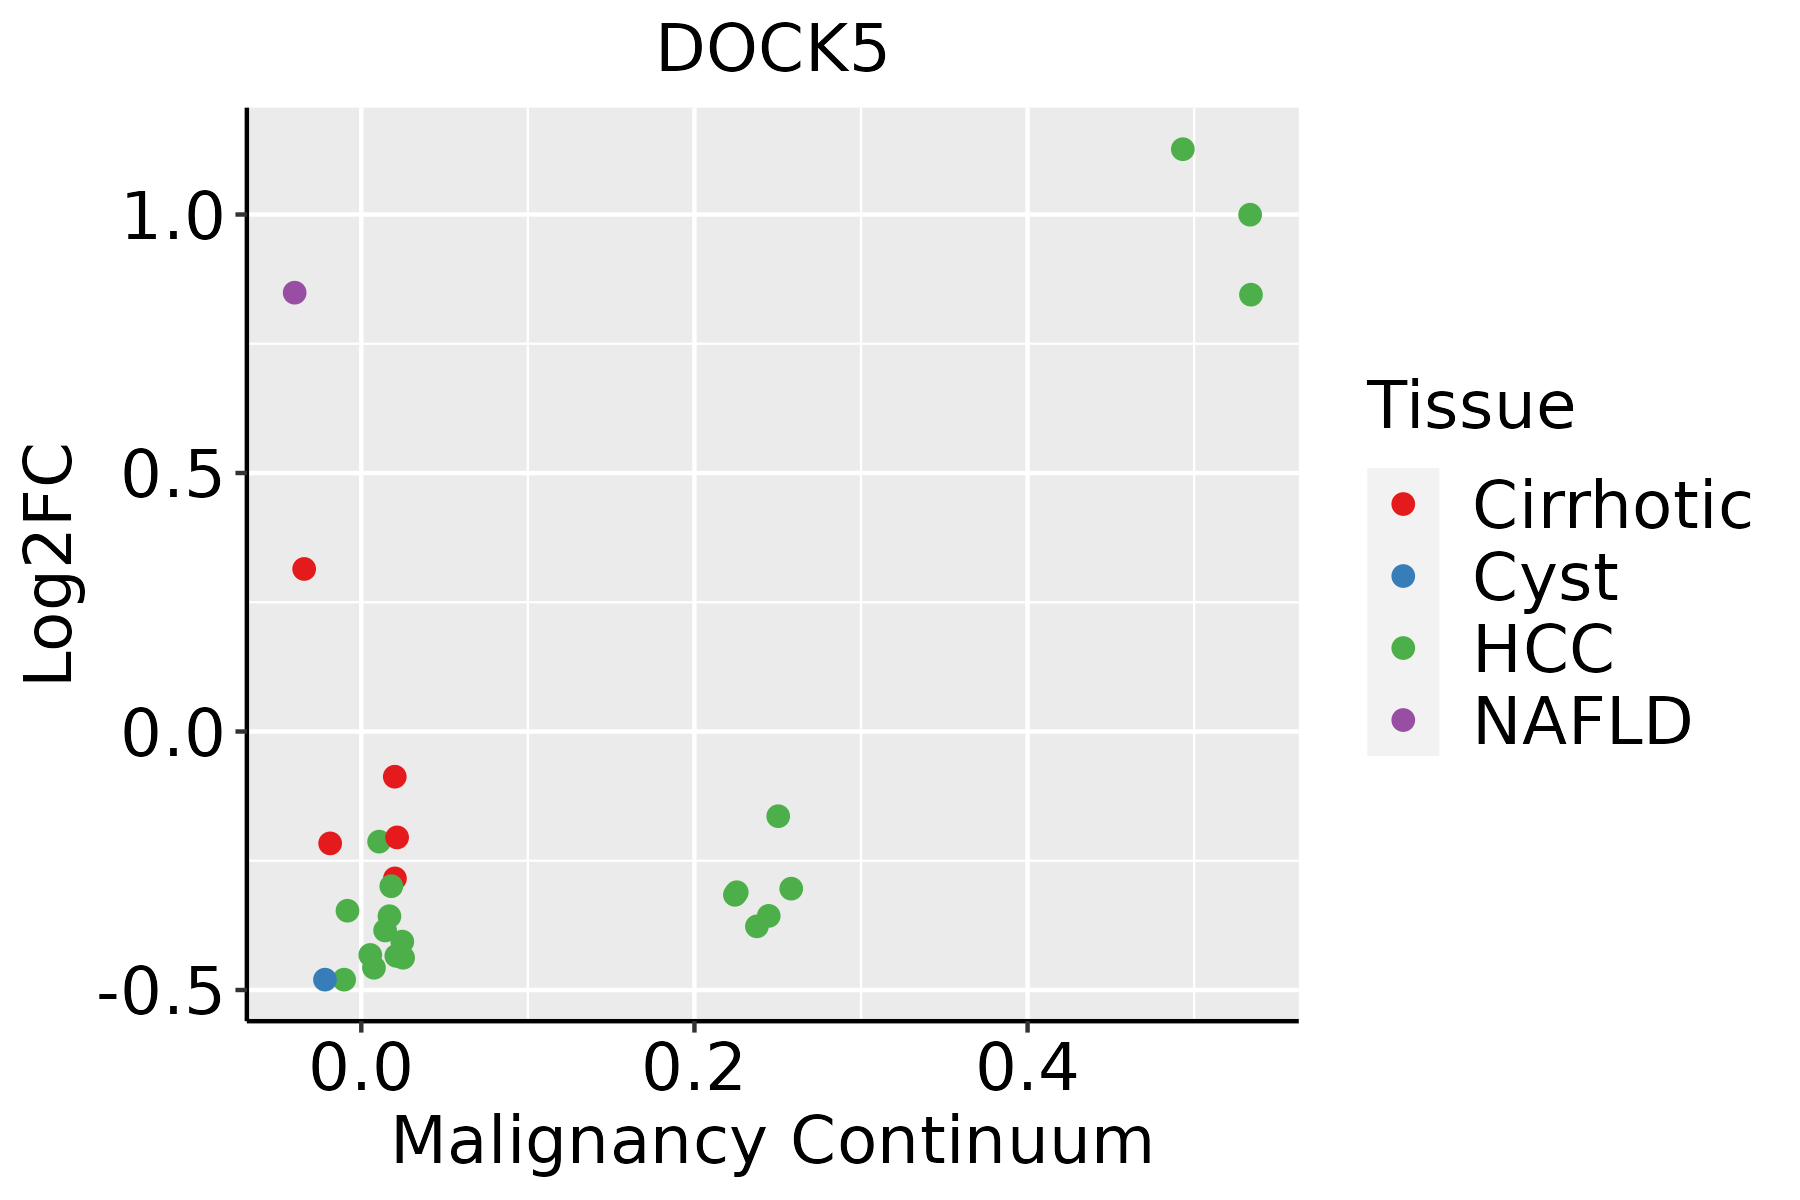
HCC: Hepatocellular carcinoma
NAFLD: Non-alcoholic fatty liver disease
LungThe image shows the transcriptomic changes along malignancy continuum.log2FC in expression of this searched gene in stem-like cells from each diseased tissue sample relative to stem-like cells in normal samples in each tissue plotted against the malignancy continuum. Samples are colored based on if they are from different disease stage.AAH: Atypical adenomatous hyperplasia
AIS: Adenocarcinoma in situ
IAC: Invasive lung adenocarcinoma
MIA: Minimally invasive adenocarcinoma
Oral CavityThe image shows the transcriptomic changes along malignancy continuum.log2FC in expression of this searched gene in stem-like cells from each diseased tissue sample relative to stem-like cells in normal samples in each tissue plotted against the malignancy continuum. Samples are colored based on if they are from different disease stage.
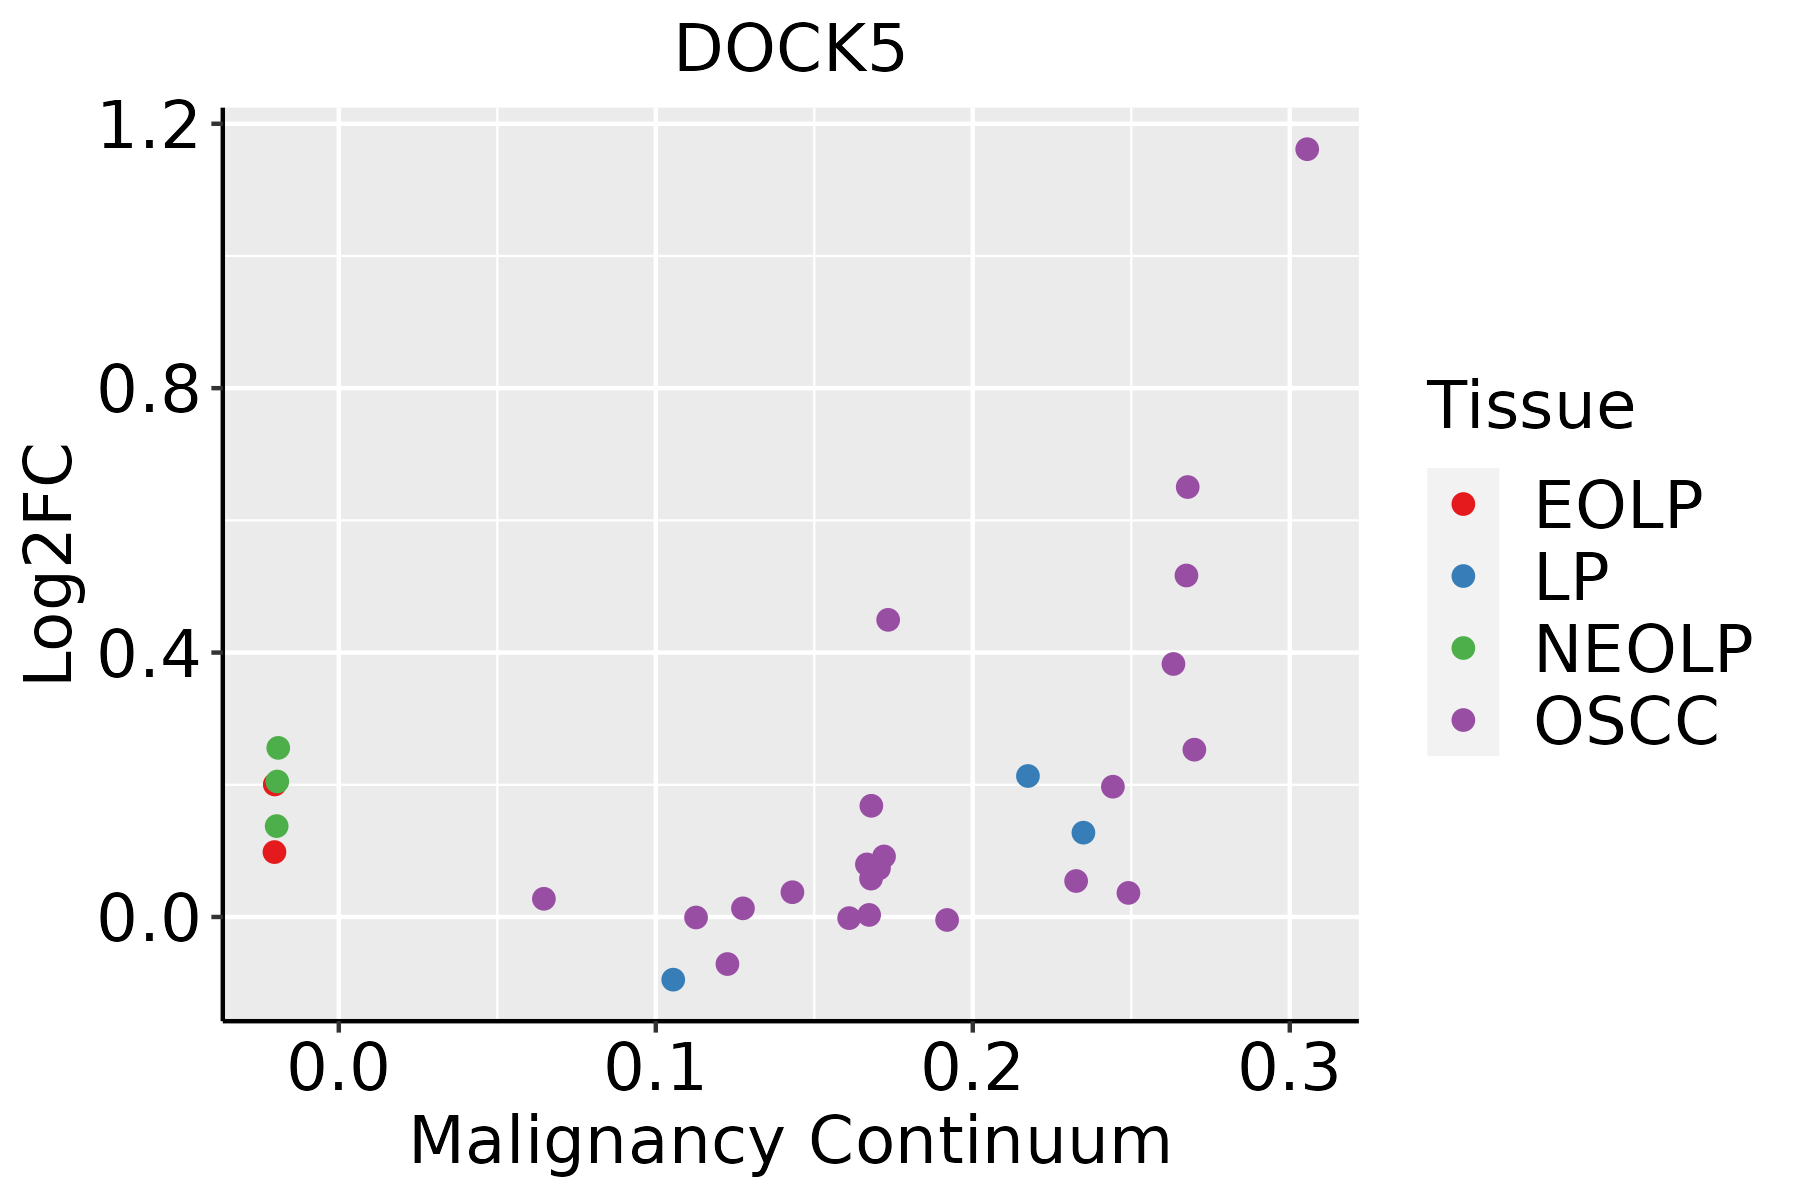
EOLP: Erosive Oral lichen planus
LP: leukoplakia
NEOLP: Non-erosive oral lichen planus
OSCC: Oral squamous cell carcinoma
ProstateThe image shows the transcriptomic changes along malignancy continuum.log2FC in expression of this searched gene in stem-like cells from each diseased tissue sample relative to stem-like cells in normal samples in each tissue plotted against the malignancy continuum. Samples are colored based on if they are from different disease stage.
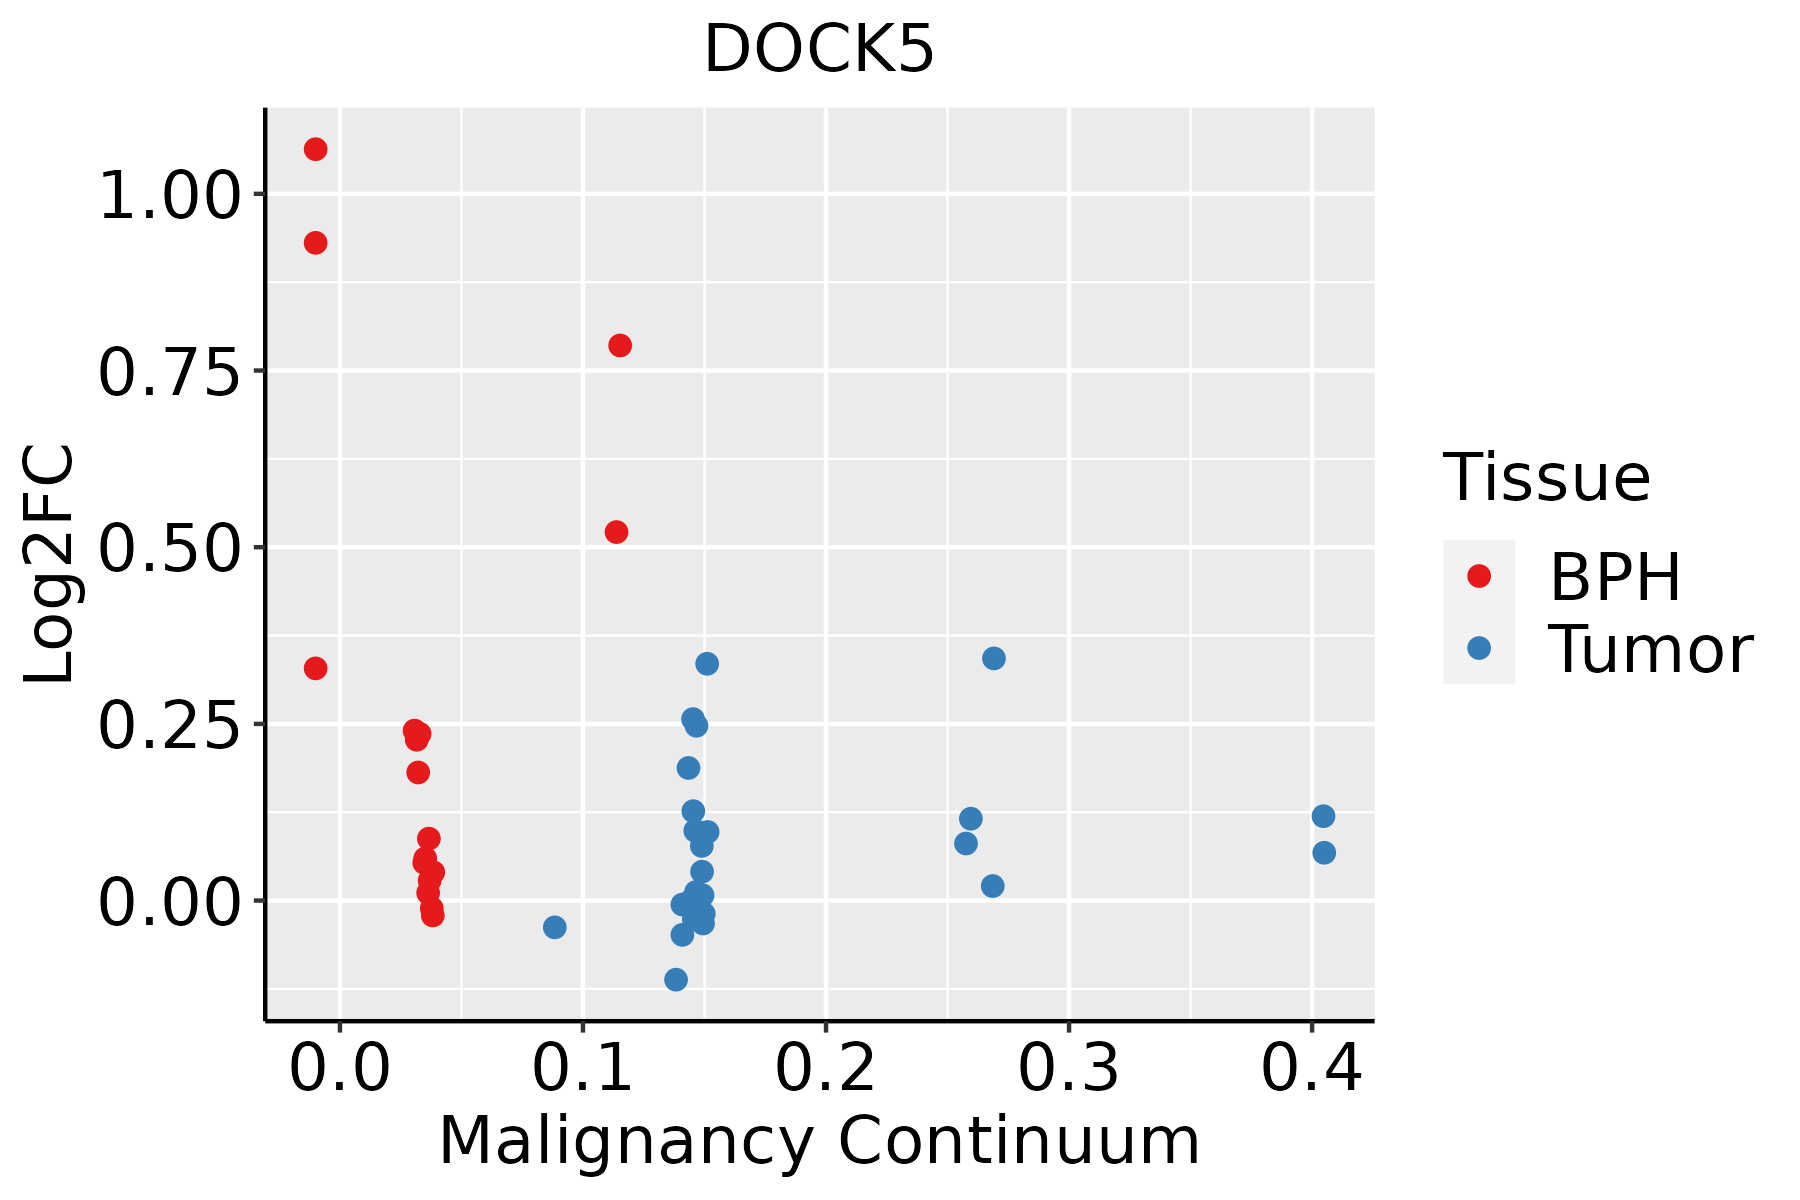
BPH: Benign Prostatic Hyperplasia
ThyroidThe image shows the transcriptomic changes along malignancy continuum.log2FC in expression of this searched gene in stem-like cells from each diseased tissue sample relative to stem-like cells in normal samples in each tissue plotted against the malignancy continuum. Samples are colored based on if they are from different disease stage.
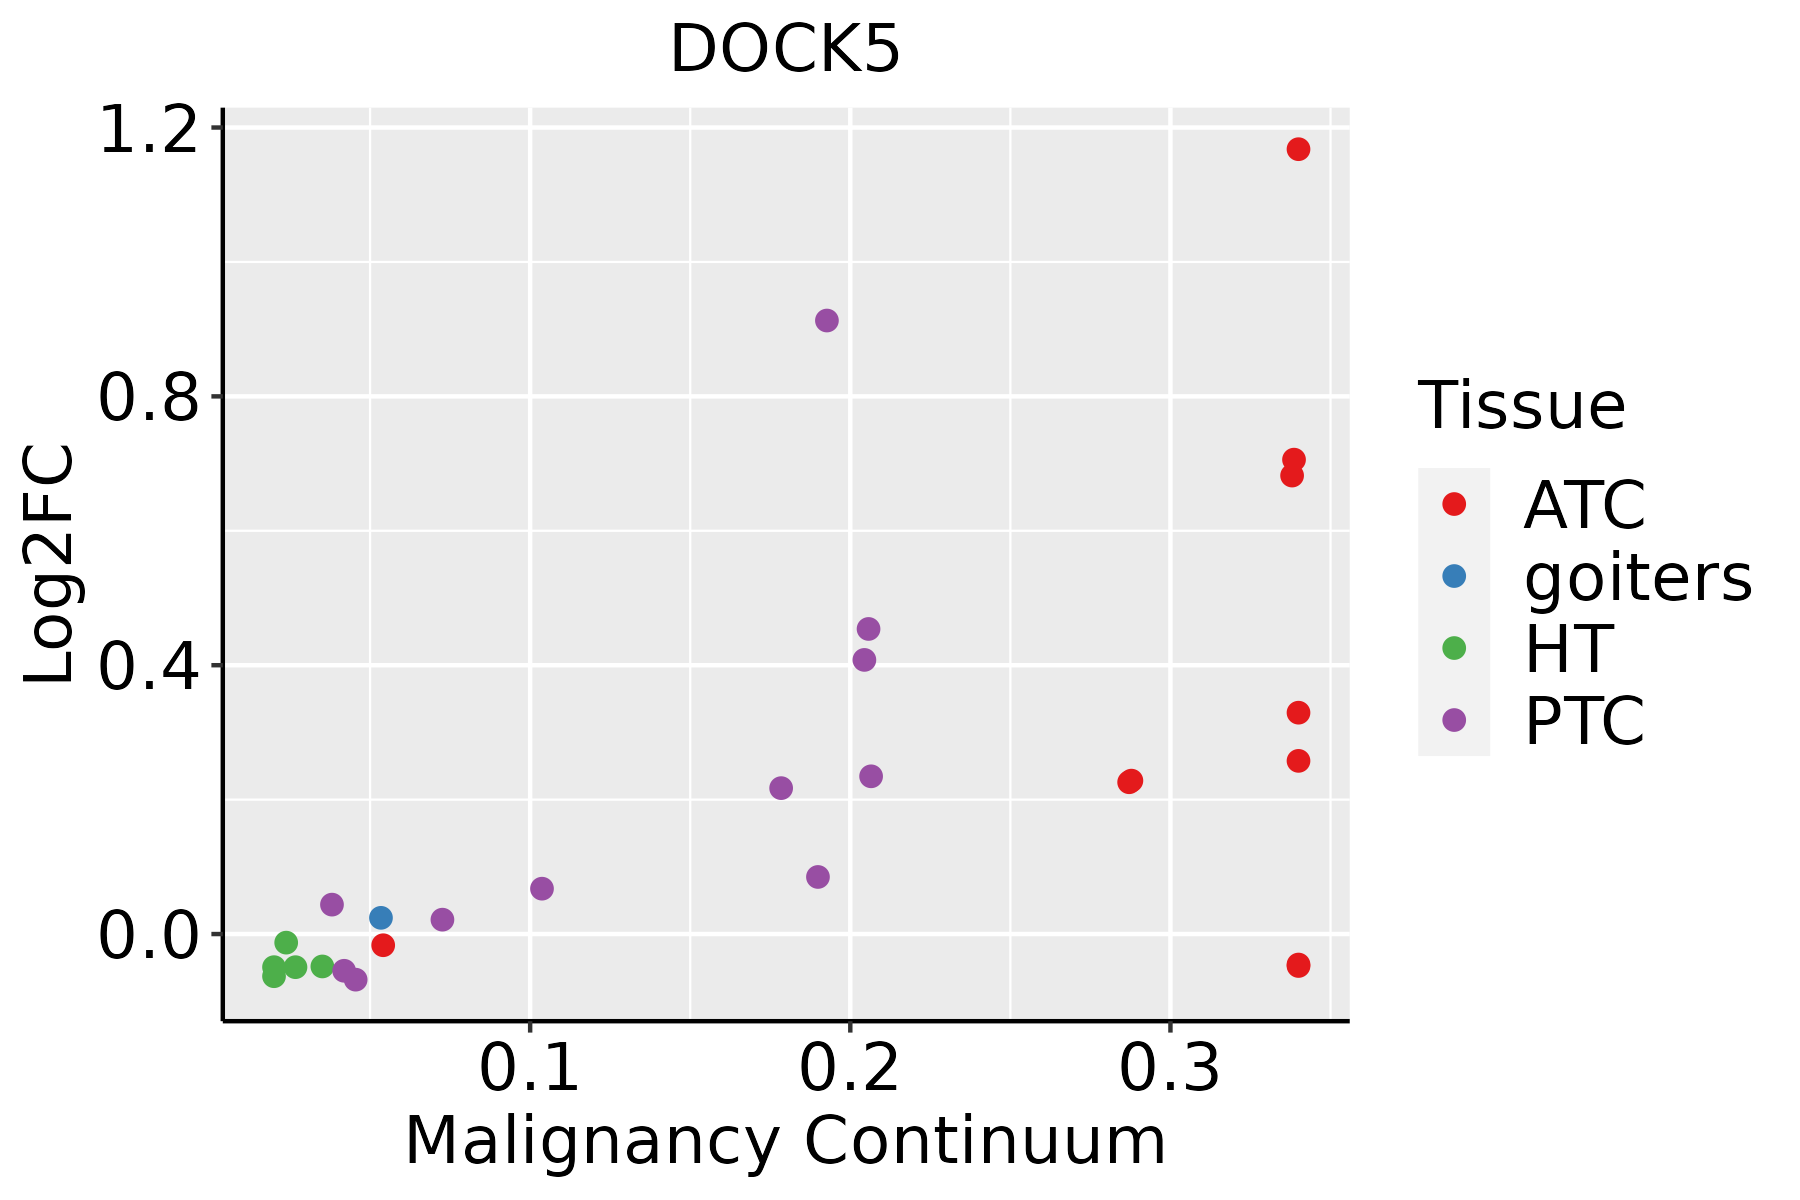
ATC: Anaplastic thyroid cancer
HT: Hashimoto's thyroiditis
PTC: Papillary thyroid cancer
∗log2FC in expression of this searched gene in stem-like cells from each diseased tissue sample relative to stem-like cells in normal samples in each tissue plotted against the malignancy continuum. Samples are colored based on if they are from different disease stage.

Top

Malignant transformation related pathway analysis

check buttonFind out the enriched GO biological processes and KEGG pathways involved in transition from healthy to precancer to cancer
check button Figure of enriched GO biological processes.
TissueDisease StageEnriched GO biological Processes
ColorectumADGO analysis - Figure of enriched GO biological processes: Top 15 enriched GO BP terms are showed in the bar plot of each disease state in each tissue. Each row represents a significant GO biological process which is colored according to the -log10(p.adjust).
ColorectumSERGO analysis - Figure of enriched GO biological processes: Top 15 enriched GO BP terms are showed in the bar plot of each disease state in each tissue. Each row represents a significant GO biological process which is colored according to the -log10(p.adjust).
ColorectumMSSGO analysis - Figure of enriched GO biological processes: Top 15 enriched GO BP terms are showed in the bar plot of each disease state in each tissue. Each row represents a significant GO biological process which is colored according to the -log10(p.adjust).
ColorectumMSI-HGO analysis - Figure of enriched GO biological processes: Top 15 enriched GO BP terms are showed in the bar plot of each disease state in each tissue. Each row represents a significant GO biological process which is colored according to the -log10(p.adjust).
ColorectumFAPGO analysis - Figure of enriched GO biological processes: Top 15 enriched GO BP terms are showed in the bar plot of each disease state in each tissue. Each row represents a significant GO biological process which is colored according to the -log10(p.adjust).
∗Top 15 enriched GO BP terms are showed in the bar plot of each disease state in each tissue. Each row represents a significant GO biological process which is colored according to the -log10(p.adjust).
Page: 1 2 3 4 5 6 7 8 9 

check button Enriched GO biological processes.
GO IDTissueDisease StageDescriptionGene RatioBg Ratiopvaluep.adjustCount
GO:00108111ColorectumSERpositive regulation of cell-substrate adhesion41/2897123/187236.52e-073.15e-0541
GO:00315891ColorectumSERcell-substrate adhesion86/2897363/187232.36e-056.64e-0486
GO:00107691ColorectumSERregulation of cell morphogenesis involved in differentiation31/289796/187232.95e-057.89e-0431
GO:19000241ColorectumSERregulation of substrate adhesion-dependent cell spreading21/289757/187236.59e-051.51e-0321
GO:00016671ColorectumSERameboidal-type cell migration105/2897475/187236.97e-051.59e-03105
GO:00107701ColorectumSERpositive regulation of cell morphogenesis involved in differentiation26/289779/187238.81e-051.91e-0326
GO:00344461ColorectumSERsubstrate adhesion-dependent cell spreading32/2897108/187231.42e-042.82e-0332
GO:00901321ColorectumSERepithelium migration82/2897360/187231.50e-042.93e-0382
GO:00106311ColorectumSERepithelial cell migration81/2897357/187231.87e-043.44e-0381
GO:19000261ColorectumSERpositive regulation of substrate adhesion-dependent cell spreading16/289741/187232.21e-043.89e-0316
GO:00901301ColorectumSERtissue migration82/2897365/187232.40e-044.12e-0382
GO:00106321ColorectumSERregulation of epithelial cell migration68/2897292/187232.72e-044.53e-0368
GO:00902571ColorectumSERregulation of muscle system process60/2897252/187233.28e-045.22e-0360
GO:00457851ColorectumSERpositive regulation of cell adhesion93/2897437/187236.78e-049.04e-0393
GO:00107201ColorectumSERpositive regulation of cell development66/2897298/187231.36e-031.50e-0266
GO:0003012ColorectumSERmuscle system process92/2897452/187232.98e-032.63e-0292
GO:00106341ColorectumSERpositive regulation of epithelial cell migration41/2897176/187234.03e-033.30e-0241
GO:00226042ColorectumMSSregulation of cell morphogenesis103/3467309/187232.70e-102.56e-08103
GO:00108102ColorectumMSSregulation of cell-substrate adhesion73/3467221/187231.56e-077.16e-0673
GO:00108112ColorectumMSSpositive regulation of cell-substrate adhesion47/3467123/187232.28e-079.79e-0647
Page: 1 2 3 4 5 6 7 8 9 10 11 12 13 14 15 16 17 18 

check button Enriched KEGG pathways.
Pathway IDTissueDisease StageDescriptionGene RatioBg Ratiopvaluep.adjustqvalueCount
Page: 1 

Top

Cell-cell communication analysis

check buttonIdentification of potential cell-cell interactions between two cell types and their ligand-receptor pairs for different disease states
LigandReceptorLRpairPathwayTissueDisease Stage
Page: 1 

Top

Single-cell gene regulatory network inference analysis

check buttonFind out the significant the regulons (TFs) and the target genes of each regulon across cell types for different disease states
TFCell TypeTissueDisease StageTarget GeneRSSRegulon Activity
∗The dot plots of a searched regulon are shown for all cell subpopulations in each disease state of each tissue based on the regulon specific score inferred using pySCENIC and by calculating the average expression.
Page: 1 

Top

Somatic mutation of malignant transformation related genes

check buttonAnnotation of somatic variants for genes involved in malignant transformation
Hugo SymbolVariant ClassVariant ClassificationdbSNP RSHGVScHGVSpHGVSp ShortSWISSPROTBIOTYPESIFTPolyPhenTumor Sample BarcodeTissueHistologySexAgeStageTherapy TypesDrugsOutcome
DOCK5SNVMissense_Mutationc.3478N>Cp.Glu1160Glnp.E1160QQ9H7D0protein_codingdeleterious(0)probably_damaging(0.987)TCGA-A2-A0EQ-01Breastbreast invasive carcinomaFemale<65I/IIChemotherapyadriamycinSD
DOCK5SNVMissense_Mutationnovelc.5007N>Tp.Arg1669Serp.R1669SQ9H7D0protein_codingtolerated(0.11)possibly_damaging(0.468)TCGA-AO-A0J5-01Breastbreast invasive carcinomaFemale<65III/IVOther, specify in notesBisphosphonatezoledronicPD
DOCK5SNVMissense_Mutationc.4037C>Gp.Ala1346Glyp.A1346GQ9H7D0protein_codingdeleterious(0)possibly_damaging(0.817)TCGA-AR-A251-01Breastbreast invasive carcinomaFemale<65III/IVChemotherapydoxorubicinSD
DOCK5SNVMissense_Mutationc.360N>Ap.Met120Ilep.M120IQ9H7D0protein_codingdeleterious(0)benign(0.14)TCGA-B6-A0IJ-01Breastbreast invasive carcinomaFemale<65I/IIUnknownUnknownSD
DOCK5SNVMissense_Mutationnovelc.5390N>Tp.Ala1797Valp.A1797VQ9H7D0protein_codingtolerated(0.11)benign(0.01)TCGA-BH-A0EE-01Breastbreast invasive carcinomaFemale>=65I/IIChemotherapydocetaxelSD
DOCK5SNVMissense_Mutationc.1960N>Ap.Leu654Ilep.L654IQ9H7D0protein_codingdeleterious(0)probably_damaging(0.974)TCGA-E2-A1IE-01Breastbreast invasive carcinomaFemale<65I/IIChemotherapydoxorubicinPD
DOCK5SNVMissense_Mutationnovelc.2394N>Ap.Phe798Leup.F798LQ9H7D0protein_codingtolerated(0.35)benign(0.001)TCGA-EW-A3E8-01Breastbreast invasive carcinomaFemale<65I/IIHormone TherapyanastrozoleSD
DOCK5SNVMissense_Mutationnovelc.5558C>Tp.Pro1853Leup.P1853LQ9H7D0protein_codingtolerated_low_confidence(0.13)probably_damaging(0.987)TCGA-OL-A66K-01Breastbreast invasive carcinomaFemale>=65I/IIUnknownUnknownSD
DOCK5insertionNonsense_Mutationnovelc.4501_4502insCACGCACCTGTAGTCCCAGCTACTCGGGAGGCTGAGGCACp.Trp1501SerfsTer12p.W1501Sfs*12Q9H7D0protein_codingTCGA-A8-A07U-01Breastbreast invasive carcinomaFemale>=65III/IVChemotherapy5-fluorouracilSD
DOCK5insertionFrame_Shift_Insnovelc.5031_5032insCTATCAGTTGCTCATCCACGGAAGTGCCCCAGGACTCCGTTAGAp.Ser1678LeufsTer77p.S1678Lfs*77Q9H7D0protein_codingTCGA-B6-A0IK-01Breastbreast invasive carcinomaFemale<65III/IVUnknownUnknownPD
Page: 1 2 3 4 5 6 7 8 9 10 11 12 13 14 15 16 17 18 19 20 21 

Top

Related drugs of malignant transformation related genes

check buttonIdentification of chemicals and drugs interact with genes involved in malignant transfromation
(DGIdb 4.0)
Entrez IDSymbolCategoryInteraction TypesDrug Claim NameDrug NamePMIDs
Page: 1