Schematic overview of the cellular and molecular mechanisms involved in the cancer progression, including the proposed cellular and molecular mechanisms in cancer cells trajectory. AT1: alveolar type 1 cells; AT2: alveolar type 2 cells; AAH: atypical adenomatous hyperplasia; AIS: adenocarcinoma in situ; MIA: minimally invasive adenocarcinoma; IA: invasive adenocarcinoma; EMT: epithelial-mesenchymal transition

Home

Download

Statistics

Help

Contact

Center for Computational Systems Medicine
leaf

Gene summary

leaf

Malignant transformation analysis

leaf

Malignant transformation related pathway analysis

leaf

Cell-cell communication analysis

leaf

Single-cell gene regulatory network inference analysis

leaf

Somatic mutation of malignant transformation related genes

leaf

Related drugs of malignant transformation related genes

Gene: DLGAP5

Gene summary for DLGAP5

check button Gene summary.

Gene informationSpeciesHuman
Gene symbol

DLGAP5

Gene ID

9787

Gene nameDLG associated protein 5
Gene AliasDLG7
Cytomap14q22.3
Gene Typeprotein-coding
GO ID

GO:0000070

UniProtAcc

Q15398


Top

Malignant transformation analysis

check button Identification of the aberrant gene expression in precancerous and cancerous lesions by comparing the gene expression of stem-like cells in diseased tissues with normal stem cells
check button Malignant transformation involving gene list.
Entrez IDSymbolReplicatesSpeciesOrganTissueAdj P-valueLog2FCMalignancy
9787DLGAP5P2T-EHumanEsophagusESCC4.17e-052.95e-010.1177
9787DLGAP5P4T-EHumanEsophagusESCC3.48e-083.22e-010.1323
9787DLGAP5P5T-EHumanEsophagusESCC4.41e-071.91e-010.1327
9787DLGAP5P9T-EHumanEsophagusESCC1.11e-031.56e-010.1131
9787DLGAP5P10T-EHumanEsophagusESCC8.84e-052.60e-010.116
9787DLGAP5P15T-EHumanEsophagusESCC3.38e-043.10e-010.1149
9787DLGAP5P17T-EHumanEsophagusESCC8.50e-054.01e-010.1278
9787DLGAP5P19T-EHumanEsophagusESCC5.57e-055.72e-010.1662
9787DLGAP5P20T-EHumanEsophagusESCC1.51e-021.78e-010.1124
9787DLGAP5P21T-EHumanEsophagusESCC4.31e-062.54e-010.1617
9787DLGAP5P24T-EHumanEsophagusESCC3.60e-134.44e-010.1287
9787DLGAP5P26T-EHumanEsophagusESCC1.88e-042.85e-010.1276
9787DLGAP5P28T-EHumanEsophagusESCC3.50e-029.61e-020.1149
9787DLGAP5P30T-EHumanEsophagusESCC1.02e-023.43e-010.137
9787DLGAP5P31T-EHumanEsophagusESCC1.96e-052.52e-010.1251
9787DLGAP5P32T-EHumanEsophagusESCC4.12e-112.93e-010.1666
9787DLGAP5P36T-EHumanEsophagusESCC2.11e-032.27e-010.1187
9787DLGAP5P37T-EHumanEsophagusESCC4.26e-125.49e-010.1371
9787DLGAP5P38T-EHumanEsophagusESCC1.30e-064.85e-010.127
9787DLGAP5P42T-EHumanEsophagusESCC2.93e-032.26e-010.1175
Page: 1 2 3 

check button Transcriptomic changes along malignancy continuum.
TissueExpression DynamicsAbbreviation
EsophagusThe image shows the transcriptomic changes along malignancy continuum.log2FC in expression of this searched gene in stem-like cells from each diseased tissue sample relative to stem-like cells in normal samples in each tissue plotted against the malignancy continuum. Samples are colored based on if they are from different disease stage.ESCC: Esophageal squamous cell carcinoma
HGIN: High-grade intraepithelial neoplasias
LGIN: Low-grade intraepithelial neoplasias
Oral CavityThe image shows the transcriptomic changes along malignancy continuum.log2FC in expression of this searched gene in stem-like cells from each diseased tissue sample relative to stem-like cells in normal samples in each tissue plotted against the malignancy continuum. Samples are colored based on if they are from different disease stage.
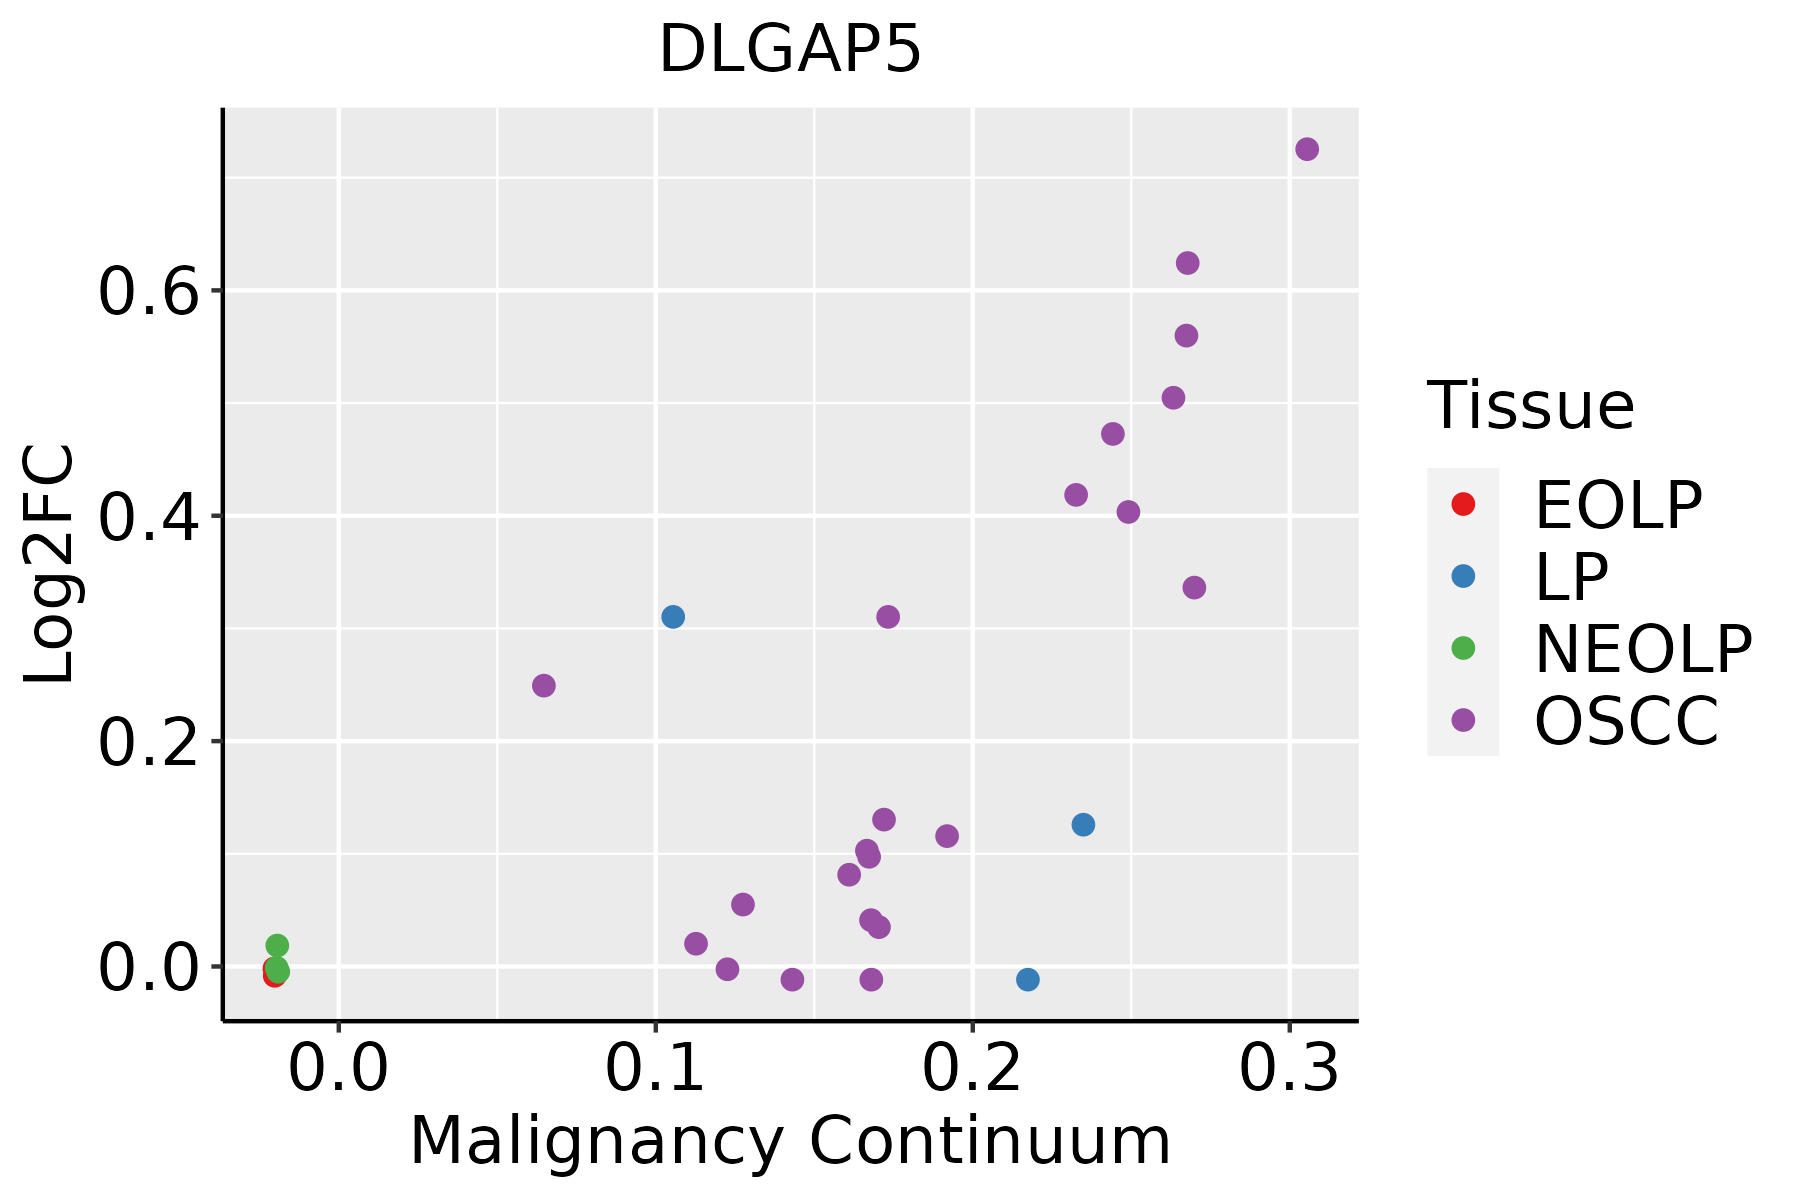
EOLP: Erosive Oral lichen planus
LP: leukoplakia
NEOLP: Non-erosive oral lichen planus
OSCC: Oral squamous cell carcinoma
SkinThe image shows the transcriptomic changes along malignancy continuum.log2FC in expression of this searched gene in stem-like cells from each diseased tissue sample relative to stem-like cells in normal samples in each tissue plotted against the malignancy continuum. Samples are colored based on if they are from different disease stage.
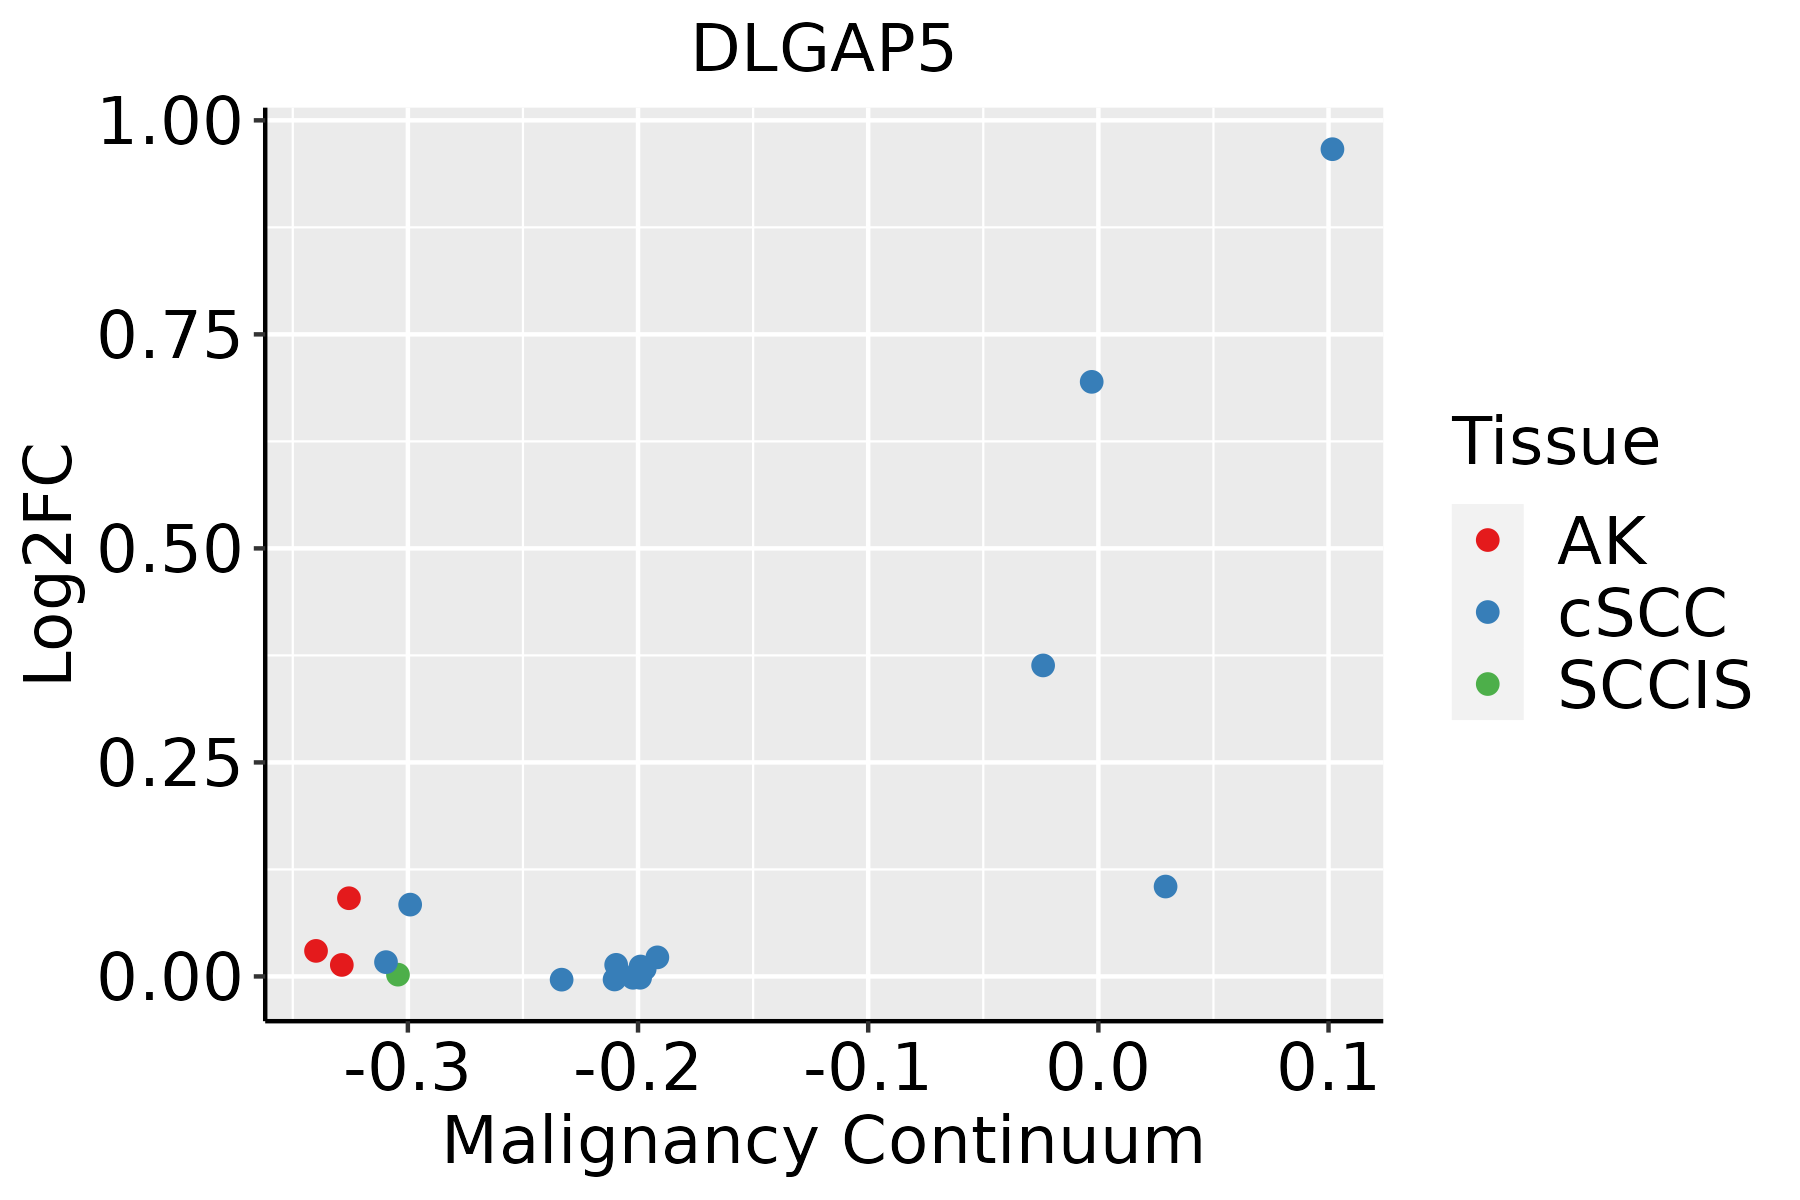
AK: Actinic keratosis
cSCC: Cutaneous squamous cell carcinoma
SCCIS:squamous cell carcinoma in situ
ThyroidThe image shows the transcriptomic changes along malignancy continuum.log2FC in expression of this searched gene in stem-like cells from each diseased tissue sample relative to stem-like cells in normal samples in each tissue plotted against the malignancy continuum. Samples are colored based on if they are from different disease stage.
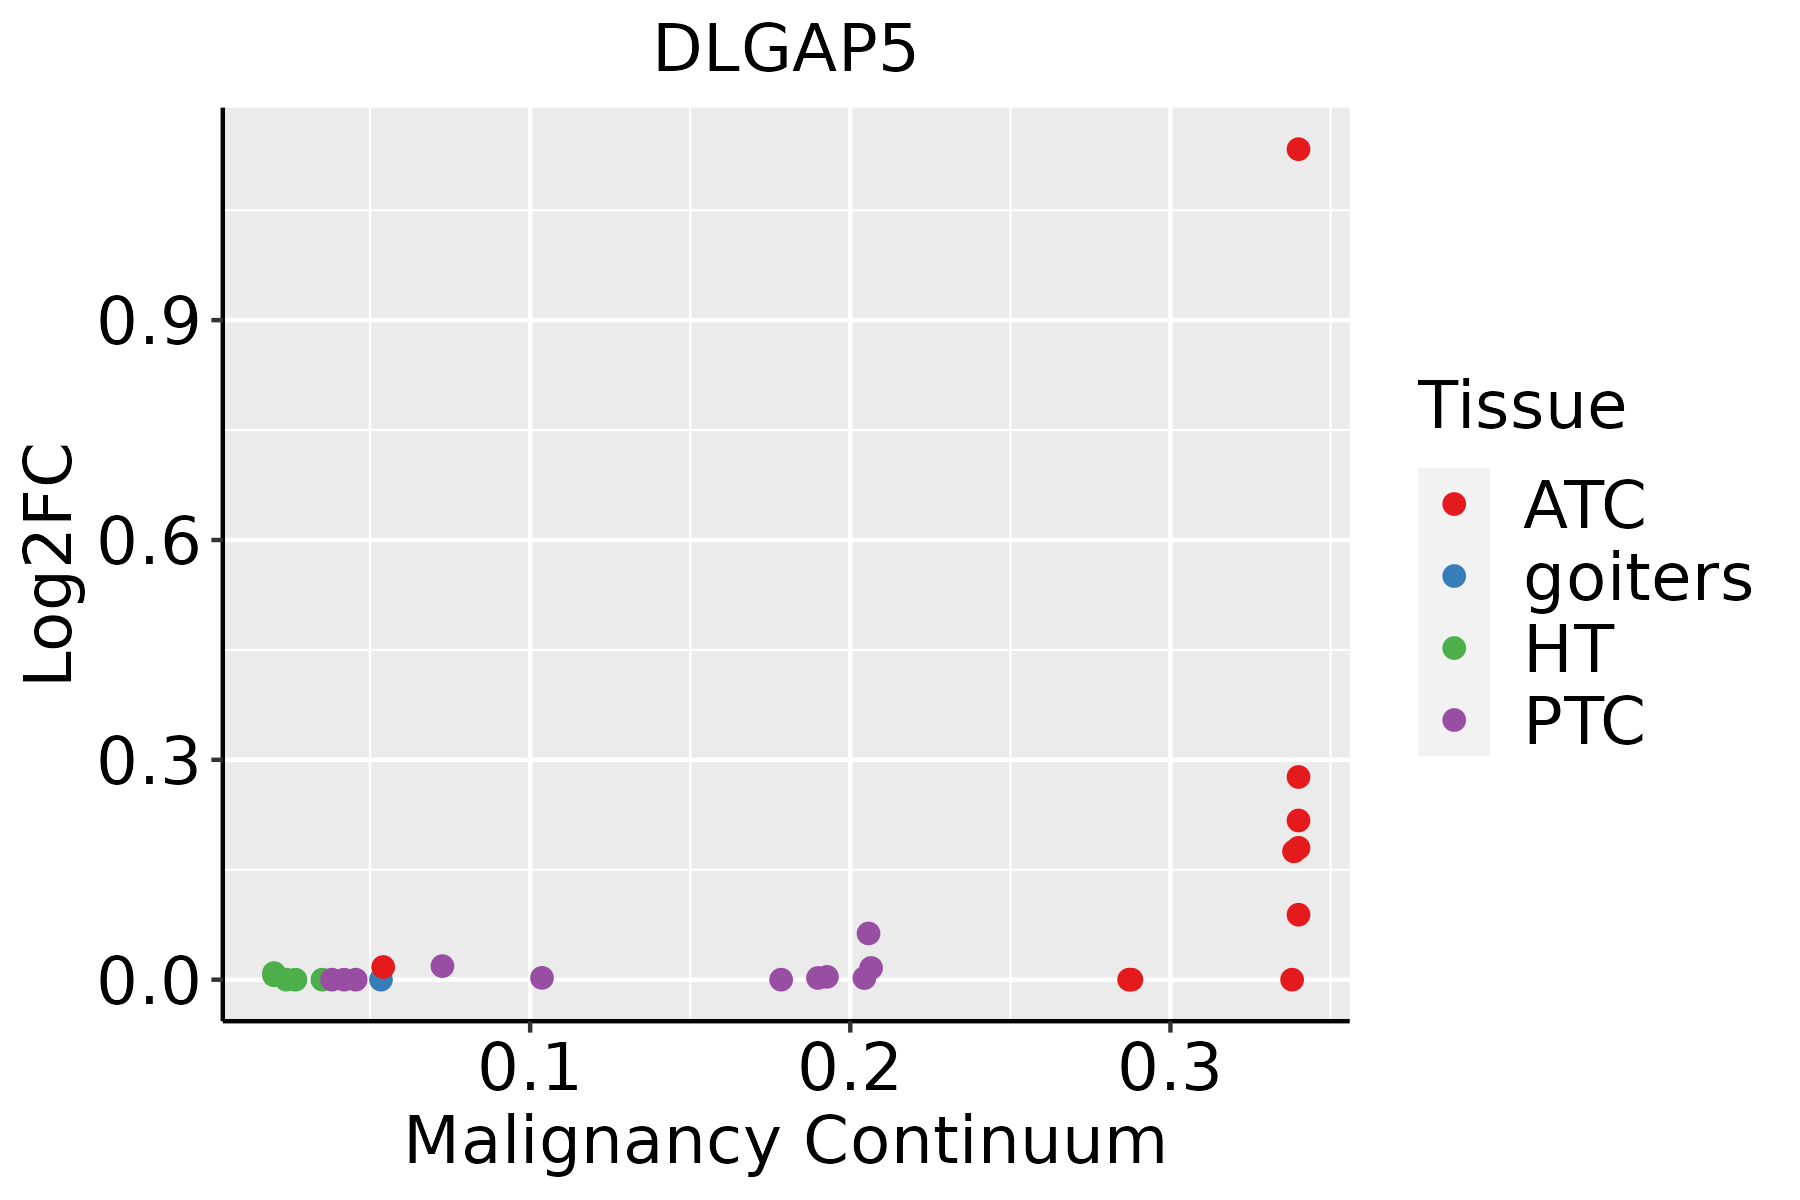
ATC: Anaplastic thyroid cancer
HT: Hashimoto's thyroiditis
PTC: Papillary thyroid cancer
∗log2FC in expression of this searched gene in stem-like cells from each diseased tissue sample relative to stem-like cells in normal samples in each tissue plotted against the malignancy continuum. Samples are colored based on if they are from different disease stage.

Top

Malignant transformation related pathway analysis

check buttonFind out the enriched GO biological processes and KEGG pathways involved in transition from healthy to precancer to cancer
check button Figure of enriched GO biological processes.
TissueDisease StageEnriched GO biological Processes
ColorectumADGO analysis - Figure of enriched GO biological processes: Top 15 enriched GO BP terms are showed in the bar plot of each disease state in each tissue. Each row represents a significant GO biological process which is colored according to the -log10(p.adjust).
ColorectumSERGO analysis - Figure of enriched GO biological processes: Top 15 enriched GO BP terms are showed in the bar plot of each disease state in each tissue. Each row represents a significant GO biological process which is colored according to the -log10(p.adjust).
ColorectumMSSGO analysis - Figure of enriched GO biological processes: Top 15 enriched GO BP terms are showed in the bar plot of each disease state in each tissue. Each row represents a significant GO biological process which is colored according to the -log10(p.adjust).
ColorectumMSI-HGO analysis - Figure of enriched GO biological processes: Top 15 enriched GO BP terms are showed in the bar plot of each disease state in each tissue. Each row represents a significant GO biological process which is colored according to the -log10(p.adjust).
ColorectumFAPGO analysis - Figure of enriched GO biological processes: Top 15 enriched GO BP terms are showed in the bar plot of each disease state in each tissue. Each row represents a significant GO biological process which is colored according to the -log10(p.adjust).
∗Top 15 enriched GO BP terms are showed in the bar plot of each disease state in each tissue. Each row represents a significant GO biological process which is colored according to the -log10(p.adjust).
Page: 1 2 3 4 5 6 7 8 9 

check button Enriched GO biological processes.
GO IDTissueDisease StageDescriptionGene RatioBg Ratiopvaluep.adjustCount
GO:00070883EsophagusESCCregulation of mitotic nuclear division78/8552110/187236.96e-081.21e-0678
GO:00070912EsophagusESCCmetaphase/anaphase transition of mitotic cell cycle49/855262/187237.65e-081.33e-0649
GO:00513062EsophagusESCCmitotic sister chromatid separation52/855267/187239.14e-081.52e-0652
GO:00330452EsophagusESCCregulation of sister chromatid segregation55/855272/187231.03e-071.69e-0655
GO:00300712EsophagusESCCregulation of mitotic metaphase/anaphase transition47/855260/187232.32e-073.53e-0647
GO:00109652EsophagusESCCregulation of mitotic sister chromatid separation50/855265/187232.67e-073.97e-0650
GO:00447842EsophagusESCCmetaphase/anaphase transition of cell cycle50/855265/187232.67e-073.97e-0650
GO:004593116EsophagusESCCpositive regulation of mitotic cell cycle83/8552121/187232.78e-074.08e-0683
GO:19058182EsophagusESCCregulation of chromosome separation54/855272/187233.85e-075.32e-0654
GO:19020992EsophagusESCCregulation of metaphase/anaphase transition of cell cycle48/855263/187237.67e-079.95e-0648
GO:19019896EsophagusESCCpositive regulation of cell cycle phase transition77/8552115/187233.20e-063.58e-0577
GO:00618428EsophagusESCCmicrotubule organizing center localization28/855233/187233.80e-064.12e-0528
GO:00517831EsophagusESCCregulation of nuclear division90/8552139/187234.30e-064.60e-0590
GO:00900689EsophagusESCCpositive regulation of cell cycle process142/8552236/187234.79e-065.08e-05142
GO:00513831EsophagusESCCkinetochore organization21/855223/187235.69e-065.90e-0521
GO:00516428EsophagusESCCcentrosome localization27/855232/187237.10e-067.12e-0527
GO:00345081EsophagusESCCcentromere complex assembly25/855230/187232.45e-052.09e-0425
GO:00513042EsophagusESCCchromosome separation64/855296/187232.61e-052.20e-0464
GO:19019925EsophagusESCCpositive regulation of mitotic cell cycle phase transition62/855293/187233.47e-052.83e-0462
GO:00513821EsophagusESCCkinetochore assembly16/855218/187231.78e-041.15e-0316
Page: 1 2 3 4 5 6 7 8 9 

check button Enriched KEGG pathways.
Pathway IDTissueDisease StageDescriptionGene RatioBg Ratiopvaluep.adjustqvalueCount
Page: 1 

Top

Cell-cell communication analysis

check buttonIdentification of potential cell-cell interactions between two cell types and their ligand-receptor pairs for different disease states
LigandReceptorLRpairPathwayTissueDisease Stage
Page: 1 

Top

Single-cell gene regulatory network inference analysis

check buttonFind out the significant the regulons (TFs) and the target genes of each regulon across cell types for different disease states
TFCell TypeTissueDisease StageTarget GeneRSSRegulon Activity
∗The dot plots of a searched regulon are shown for all cell subpopulations in each disease state of each tissue based on the regulon specific score inferred using pySCENIC and by calculating the average expression.
Page: 1 

Top

Somatic mutation of malignant transformation related genes

check buttonAnnotation of somatic variants for genes involved in malignant transformation
Hugo SymbolVariant ClassVariant ClassificationdbSNP RSHGVScHGVSpHGVSp ShortSWISSPROTBIOTYPESIFTPolyPhenTumor Sample BarcodeTissueHistologySexAgeStageTherapy TypesDrugsOutcome
DLGAP5SNVMissense_Mutationnovelc.1922N>Cp.Lys641Thrp.K641TQ15398protein_codingtolerated(0.2)benign(0.003)TCGA-AN-A046-01Breastbreast invasive carcinomaFemale>=65I/IIUnknownUnknownSD
DLGAP5SNVMissense_Mutationc.992N>Ap.Arg331Lysp.R331KQ15398protein_codingtolerated(0.07)benign(0.151)TCGA-D8-A1JA-01Breastbreast invasive carcinomaFemale<65III/IVChemotherapyadriamycinPD
DLGAP5SNVMissense_Mutationc.1978N>Gp.Thr660Alap.T660AQ15398protein_codingtolerated(0.61)benign(0.007)TCGA-E2-A1LL-01Breastbreast invasive carcinomaFemale>=65III/IVChemotherapydocetaxelPD
DLGAP5deletionFrame_Shift_Delc.124_160delAATAGACACTTTGGTTTGAAAGATGTAAACATTCCAAp.Asn42ProfsTer10p.N42Pfs*10Q15398protein_codingTCGA-A1-A0SO-01Breastbreast invasive carcinomaFemale>=65I/IIChemotherapySD
DLGAP5deletionFrame_Shift_Delnovelc.1773delNp.Glu591AspfsTer9p.E591Dfs*9Q15398protein_codingTCGA-EW-A2FV-01Breastbreast invasive carcinomaFemale<65III/IVChemotherapydocetaxelSD
DLGAP5deletionFrame_Shift_Delnovelc.1519delNp.Asp507MetfsTer11p.D507Mfs*11Q15398protein_codingTCGA-EW-A2FV-01Breastbreast invasive carcinomaFemale<65III/IVChemotherapydocetaxelSD
DLGAP5SNVMissense_Mutationc.326N>Gp.Gln109Argp.Q109RQ15398protein_codingdeleterious(0)probably_damaging(0.909)TCGA-C5-A3HL-01Cervixcervical & endocervical cancerFemale>=65I/IIUnknownUnknownSD
DLGAP5SNVMissense_Mutationc.1045N>Ap.Glu349Lysp.E349KQ15398protein_codingtolerated(0.1)benign(0.173)TCGA-LP-A4AV-01Cervixcervical & endocervical cancerFemale<65I/IIUnknownUnknownSD
DLGAP5SNVMissense_Mutationnovelc.673N>Tp.Ala225Serp.A225SQ15398protein_codingtolerated(0.28)benign(0.003)TCGA-MA-AA3W-01Cervixcervical & endocervical cancerFemale<65I/IIChemotherapycisplatinCR
DLGAP5SNVMissense_Mutationnovelc.322G>Cp.Glu108Glnp.E108QQ15398protein_codingdeleterious(0)probably_damaging(0.999)TCGA-VS-A9UZ-01Cervixcervical & endocervical cancerFemale<65I/IIUnknownUnknownSD
Page: 1 2 3 4 5 6 7 8 

Top

Related drugs of malignant transformation related genes

check buttonIdentification of chemicals and drugs interact with genes involved in malignant transfromation
(DGIdb 4.0)
Entrez IDSymbolCategoryInteraction TypesDrug Claim NameDrug NamePMIDs
Page: 1