
|
|||||
|
 | |
| |
| |
| |
| |
| |
|
Gene: DLG2 |
Gene summary for DLG2 |
| Gene information | Species | Human | Gene symbol | DLG2 | Gene ID | 1740 |
| Gene name | discs large MAGUK scaffold protein 2 | |
| Gene Alias | PPP1R58 | |
| Cytomap | 11q14.1 | |
| Gene Type | protein-coding | GO ID | GO:0006139 | UniProtAcc | Q15700 |
Top |
Malignant transformation analysis |
| Identification of the aberrant gene expression in precancerous and cancerous lesions by comparing the gene expression of stem-like cells in diseased tissues with normal stem cells |
| Entrez ID | Symbol | Replicates | Species | Organ | Tissue | Adj P-value | Log2FC | Malignancy |
| 1740 | DLG2 | HTA11_1938_2000001011 | Human | Colorectum | AD | 3.44e-02 | 1.82e-01 | -0.0811 |
| 1740 | DLG2 | HTA11_347_2000001011 | Human | Colorectum | AD | 1.24e-10 | 4.45e-01 | -0.1954 |
| 1740 | DLG2 | HTA11_3361_2000001011 | Human | Colorectum | AD | 3.60e-07 | 4.38e-01 | -0.1207 |
| 1740 | DLG2 | HTA11_83_2000001011 | Human | Colorectum | SER | 3.86e-03 | 2.86e-01 | -0.1526 |
| 1740 | DLG2 | HTA11_696_2000001011 | Human | Colorectum | AD | 4.24e-18 | 5.60e-01 | -0.1464 |
| 1740 | DLG2 | HTA11_866_2000001011 | Human | Colorectum | AD | 3.85e-24 | 6.91e-01 | -0.1001 |
| 1740 | DLG2 | HTA11_1391_2000001011 | Human | Colorectum | AD | 4.42e-10 | 5.07e-01 | -0.059 |
| 1740 | DLG2 | HTA11_2992_2000001011 | Human | Colorectum | SER | 4.58e-03 | 4.94e-01 | -0.1706 |
| 1740 | DLG2 | HTA11_7696_3000711011 | Human | Colorectum | AD | 1.56e-05 | 8.18e-02 | 0.0674 |
| 1740 | DLG2 | HTA11_6818_2000001011 | Human | Colorectum | AD | 7.70e-11 | 8.35e-01 | 0.0112 |
| 1740 | DLG2 | HTA11_99999965104_69814 | Human | Colorectum | MSS | 6.04e-06 | 3.67e-01 | 0.281 |
| 1740 | DLG2 | HTA11_99999974143_84620 | Human | Colorectum | MSS | 2.68e-02 | 2.13e-01 | 0.3005 |
| 1740 | DLG2 | AEH-subject1 | Human | Endometrium | AEH | 2.52e-03 | 2.13e-01 | -0.3059 |
| 1740 | DLG2 | AEH-subject5 | Human | Endometrium | AEH | 1.81e-06 | 3.05e-01 | -0.2953 |
| 1740 | DLG2 | EEC-subject1 | Human | Endometrium | EEC | 3.26e-07 | 3.33e-01 | -0.2682 |
| 1740 | DLG2 | EEC-subject4 | Human | Endometrium | EEC | 2.44e-07 | 4.62e-01 | -0.2571 |
| 1740 | DLG2 | TD9 | Human | Lung | IAC | 7.74e-04 | 8.94e-01 | 0.088 |
| 1740 | DLG2 | RNA-P10T1-P10T1-2 | Human | Lung | AIS | 3.16e-04 | 1.27e+00 | -0.1028 |
| 1740 | DLG2 | RNA-P10T1-P10T1-4 | Human | Lung | AIS | 1.15e-03 | 1.36e+00 | -0.1173 |
| 1740 | DLG2 | RNA-P10T2-P10T2-1 | Human | Lung | AAH | 2.33e-12 | 1.57e+00 | -0.1271 |
| Page: 1 2 3 |
| Tissue | Expression Dynamics | Abbreviation |
| Colorectum (GSE201348) |  | FAP: Familial adenomatous polyposis |
| CRC: Colorectal cancer | ||
| Colorectum (HTA11) |  | AD: Adenomas |
| SER: Sessile serrated lesions | ||
| MSI-H: Microsatellite-high colorectal cancer | ||
| MSS: Microsatellite stable colorectal cancer | ||
| Endometrium | 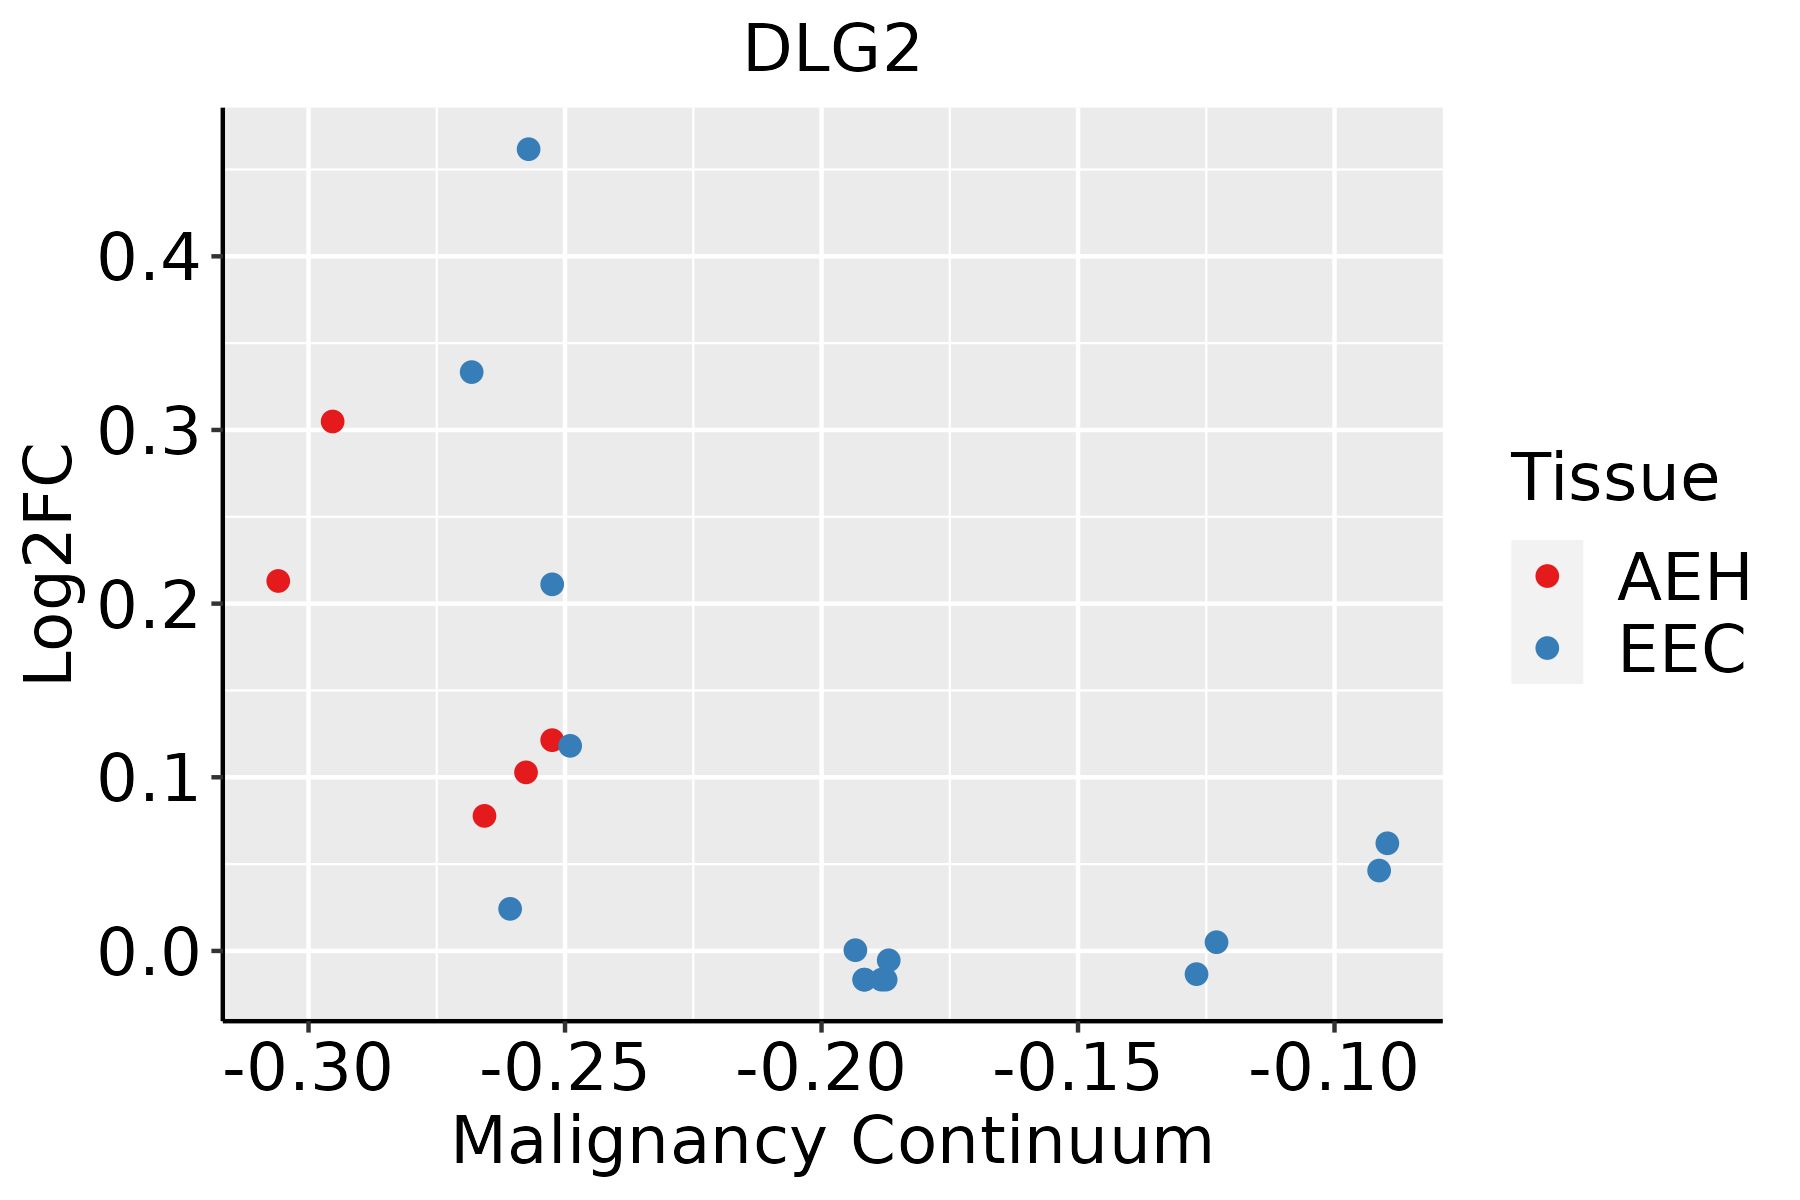 | AEH: Atypical endometrial hyperplasia |
| EEC: Endometrioid Cancer | ||
| Lung | 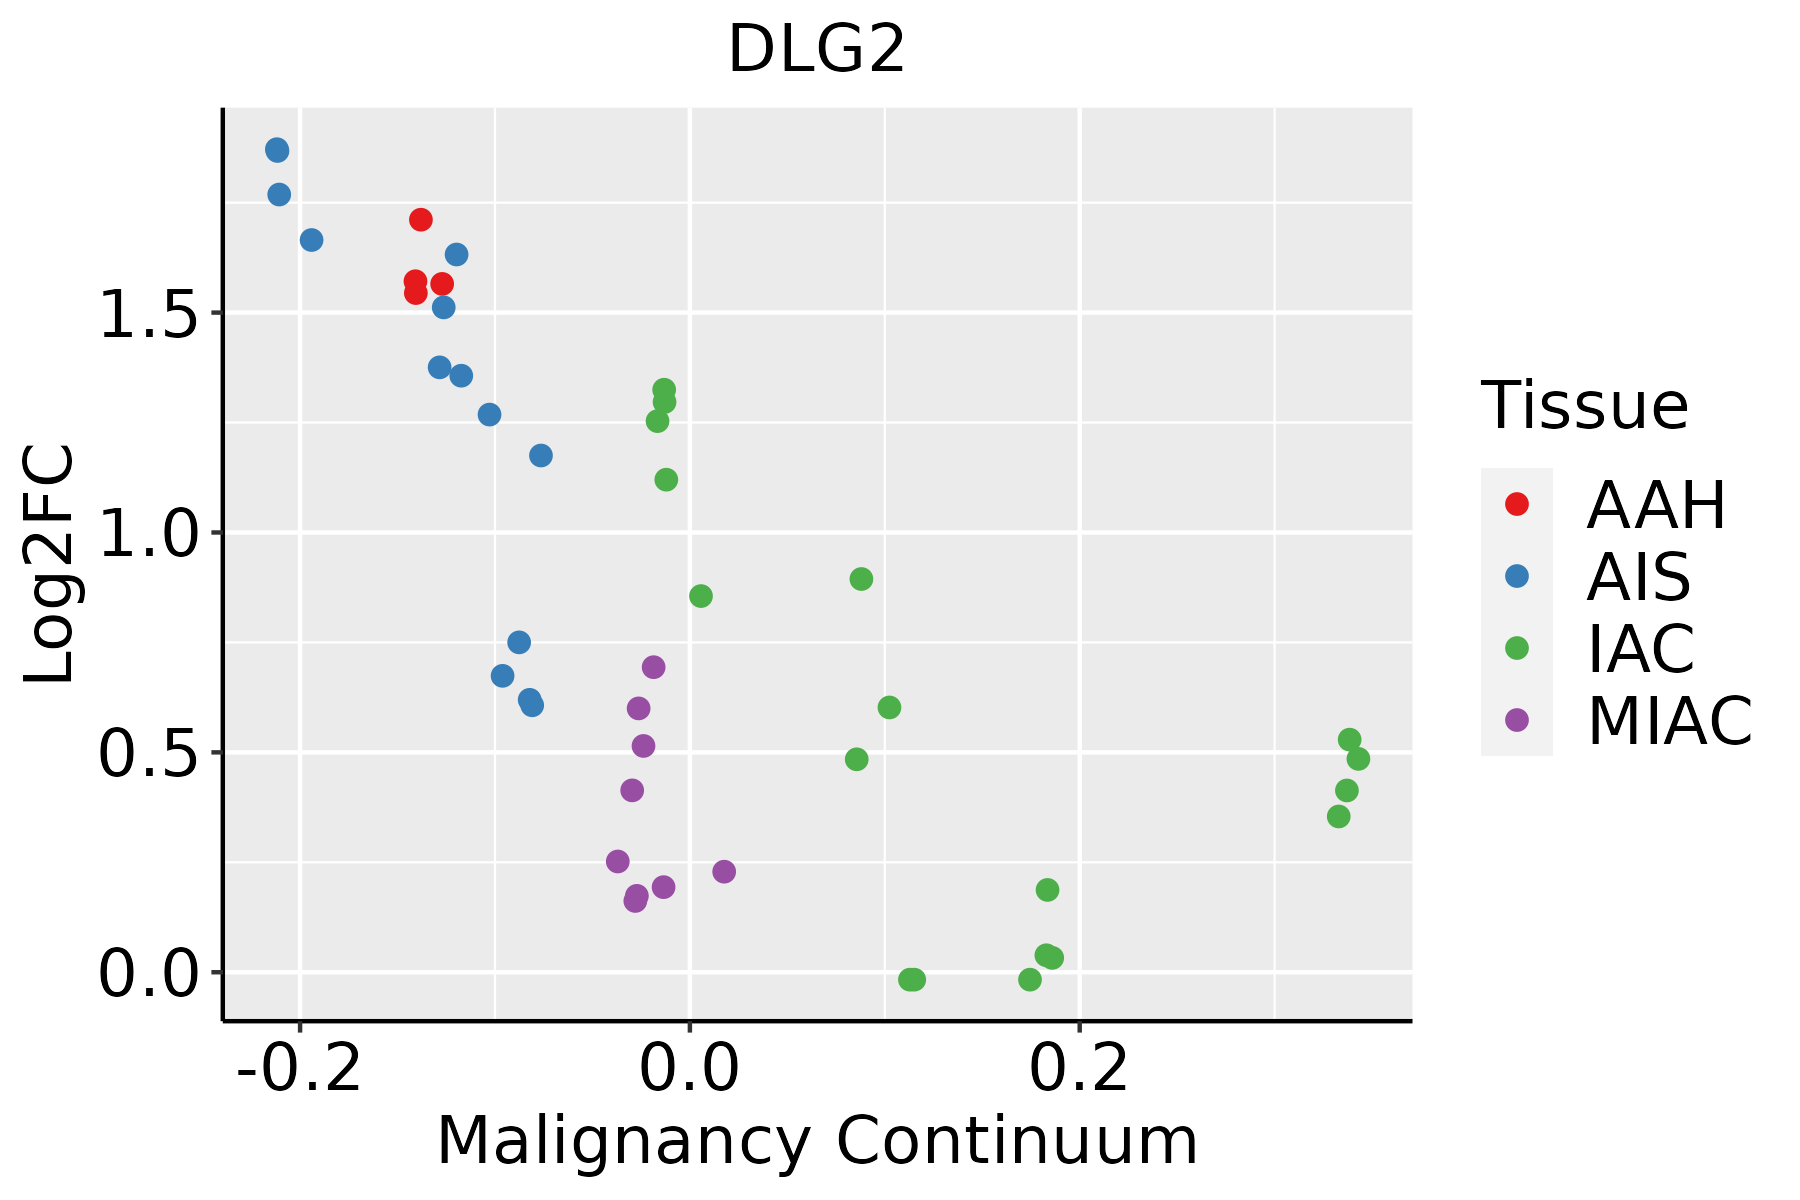 | AAH: Atypical adenomatous hyperplasia |
| AIS: Adenocarcinoma in situ | ||
| IAC: Invasive lung adenocarcinoma | ||
| MIA: Minimally invasive adenocarcinoma | ||
| Prostate |  | BPH: Benign Prostatic Hyperplasia |
| Thyroid |  | ATC: Anaplastic thyroid cancer |
| HT: Hashimoto's thyroiditis | ||
| PTC: Papillary thyroid cancer |
| ∗log2FC in expression of this searched gene in stem-like cells from each diseased tissue sample relative to stem-like cells in normal samples in each tissue plotted against the malignancy continuum. Samples are colored based on if they are from different disease stage. |
Top |
Malignant transformation related pathway analysis |
| Find out the enriched GO biological processes and KEGG pathways involved in transition from healthy to precancer to cancer |
| Tissue | Disease Stage | Enriched GO biological Processes |
| Colorectum | AD |  |
| Colorectum | SER |  |
| Colorectum | MSS |  |
| Colorectum | MSI-H |  |
| Colorectum | FAP |  |
| ∗Top 15 enriched GO BP terms are showed in the bar plot of each disease state in each tissue. Each row represents a significant GO biological process which is colored according to the -log10(p.adjust). |
| Page: 1 2 3 4 5 6 7 8 9 |
| GO ID | Tissue | Disease Stage | Description | Gene Ratio | Bg Ratio | pvalue | p.adjust | Count |
| GO:0009167 | Colorectum | AD | purine ribonucleoside monophosphate metabolic process | 18/3918 | 41/18723 | 7.71e-04 | 7.73e-03 | 18 |
| GO:0046037 | Colorectum | AD | GMP metabolic process | 9/3918 | 16/18723 | 2.06e-03 | 1.64e-02 | 9 |
| GO:1902414 | Colorectum | AD | protein localization to cell junction | 31/3918 | 94/18723 | 4.30e-03 | 2.95e-02 | 31 |
| GO:00061631 | Colorectum | SER | purine nucleotide metabolic process | 109/2897 | 396/18723 | 4.26e-10 | 5.44e-08 | 109 |
| GO:00091501 | Colorectum | SER | purine ribonucleotide metabolic process | 103/2897 | 368/18723 | 4.69e-10 | 5.68e-08 | 103 |
| GO:00725211 | Colorectum | SER | purine-containing compound metabolic process | 113/2897 | 416/18723 | 4.80e-10 | 5.68e-08 | 113 |
| GO:00092591 | Colorectum | SER | ribonucleotide metabolic process | 104/2897 | 385/18723 | 3.27e-09 | 3.04e-07 | 104 |
| GO:00196931 | Colorectum | SER | ribose phosphate metabolic process | 105/2897 | 396/18723 | 8.15e-09 | 7.14e-07 | 105 |
| GO:00091171 | Colorectum | SER | nucleotide metabolic process | 122/2897 | 489/18723 | 2.50e-08 | 1.76e-06 | 122 |
| GO:00067531 | Colorectum | SER | nucleoside phosphate metabolic process | 122/2897 | 497/18723 | 6.64e-08 | 4.33e-06 | 122 |
| GO:00071631 | Colorectum | SER | establishment or maintenance of cell polarity | 60/2897 | 218/18723 | 3.45e-06 | 1.33e-04 | 60 |
| GO:00091351 | Colorectum | SER | purine nucleoside diphosphate metabolic process | 32/2897 | 103/18723 | 5.21e-05 | 1.25e-03 | 32 |
| GO:00091791 | Colorectum | SER | purine ribonucleoside diphosphate metabolic process | 32/2897 | 103/18723 | 5.21e-05 | 1.25e-03 | 32 |
| GO:00091851 | Colorectum | SER | ribonucleoside diphosphate metabolic process | 32/2897 | 106/18723 | 9.63e-05 | 2.04e-03 | 32 |
| GO:00100381 | Colorectum | SER | response to metal ion | 84/2897 | 373/18723 | 1.87e-04 | 3.44e-03 | 84 |
| GO:00460371 | Colorectum | SER | GMP metabolic process | 9/2897 | 16/18723 | 2.03e-04 | 3.68e-03 | 9 |
| GO:00091321 | Colorectum | SER | nucleoside diphosphate metabolic process | 34/2897 | 124/18723 | 4.53e-04 | 6.60e-03 | 34 |
| GO:00451971 | Colorectum | SER | establishment or maintenance of epithelial cell apical/basal polarity | 16/2897 | 44/18723 | 5.64e-04 | 7.83e-03 | 16 |
| GO:00350881 | Colorectum | SER | establishment or maintenance of apical/basal cell polarity | 17/2897 | 49/18723 | 7.17e-04 | 9.44e-03 | 17 |
| GO:00612451 | Colorectum | SER | establishment or maintenance of bipolar cell polarity | 17/2897 | 49/18723 | 7.17e-04 | 9.44e-03 | 17 |
| Page: 1 2 3 4 5 6 7 8 9 10 11 12 13 14 |
| Pathway ID | Tissue | Disease Stage | Description | Gene Ratio | Bg Ratio | pvalue | p.adjust | qvalue | Count |
| hsa04530 | Colorectum | AD | Tight junction | 76/2092 | 169/8465 | 5.49e-09 | 9.69e-08 | 6.18e-08 | 76 |
| hsa045301 | Colorectum | AD | Tight junction | 76/2092 | 169/8465 | 5.49e-09 | 9.69e-08 | 6.18e-08 | 76 |
| hsa045302 | Colorectum | SER | Tight junction | 59/1580 | 169/8465 | 3.24e-07 | 5.98e-06 | 4.34e-06 | 59 |
| hsa045303 | Colorectum | SER | Tight junction | 59/1580 | 169/8465 | 3.24e-07 | 5.98e-06 | 4.34e-06 | 59 |
| hsa045304 | Colorectum | MSS | Tight junction | 66/1875 | 169/8465 | 4.10e-07 | 6.25e-06 | 3.83e-06 | 66 |
| hsa04390 | Colorectum | MSS | Hippo signaling pathway | 48/1875 | 157/8465 | 8.32e-03 | 3.10e-02 | 1.90e-02 | 48 |
| hsa045305 | Colorectum | MSS | Tight junction | 66/1875 | 169/8465 | 4.10e-07 | 6.25e-06 | 3.83e-06 | 66 |
| hsa043901 | Colorectum | MSS | Hippo signaling pathway | 48/1875 | 157/8465 | 8.32e-03 | 3.10e-02 | 1.90e-02 | 48 |
| hsa0453026 | Endometrium | AEH | Tight junction | 54/1197 | 169/8465 | 1.99e-09 | 3.80e-08 | 2.78e-08 | 54 |
| hsa043909 | Endometrium | AEH | Hippo signaling pathway | 38/1197 | 157/8465 | 4.79e-04 | 3.38e-03 | 2.47e-03 | 38 |
| hsa04530112 | Endometrium | AEH | Tight junction | 54/1197 | 169/8465 | 1.99e-09 | 3.80e-08 | 2.78e-08 | 54 |
| hsa0439014 | Endometrium | AEH | Hippo signaling pathway | 38/1197 | 157/8465 | 4.79e-04 | 3.38e-03 | 2.47e-03 | 38 |
| hsa0453027 | Endometrium | EEC | Tight junction | 54/1237 | 169/8465 | 6.56e-09 | 1.27e-07 | 9.46e-08 | 54 |
| hsa0439023 | Endometrium | EEC | Hippo signaling pathway | 39/1237 | 157/8465 | 4.54e-04 | 3.47e-03 | 2.59e-03 | 39 |
| hsa0453036 | Endometrium | EEC | Tight junction | 54/1237 | 169/8465 | 6.56e-09 | 1.27e-07 | 9.46e-08 | 54 |
| hsa0439033 | Endometrium | EEC | Hippo signaling pathway | 39/1237 | 157/8465 | 4.54e-04 | 3.47e-03 | 2.59e-03 | 39 |
| hsa051656 | Lung | IAC | Human papillomavirus infection | 71/1053 | 331/8465 | 1.88e-06 | 7.63e-05 | 5.06e-05 | 71 |
| hsa0453016 | Lung | IAC | Tight junction | 43/1053 | 169/8465 | 2.44e-06 | 8.81e-05 | 5.85e-05 | 43 |
| hsa043907 | Lung | IAC | Hippo signaling pathway | 35/1053 | 157/8465 | 3.60e-04 | 3.45e-03 | 2.29e-03 | 35 |
| hsa0516511 | Lung | IAC | Human papillomavirus infection | 71/1053 | 331/8465 | 1.88e-06 | 7.63e-05 | 5.06e-05 | 71 |
| Page: 1 2 3 |
Top |
Cell-cell communication analysis |
| Identification of potential cell-cell interactions between two cell types and their ligand-receptor pairs for different disease states |
| Ligand | Receptor | LRpair | Pathway | Tissue | Disease Stage |
| Page: 1 |
Top |
Single-cell gene regulatory network inference analysis |
| Find out the significant the regulons (TFs) and the target genes of each regulon across cell types for different disease states |
| TF | Cell Type | Tissue | Disease Stage | Target Gene | RSS | Regulon Activity |
| ∗The dot plots of a searched regulon are shown for all cell subpopulations in each disease state of each tissue based on the regulon specific score inferred using pySCENIC and by calculating the average expression. |
| Page: 1 |
Top |
Somatic mutation of malignant transformation related genes |
| Annotation of somatic variants for genes involved in malignant transformation |
| Hugo Symbol | Variant Class | Variant Classification | dbSNP RS | HGVSc | HGVSp | HGVSp Short | SWISSPROT | BIOTYPE | SIFT | PolyPhen | Tumor Sample Barcode | Tissue | Histology | Sex | Age | Stage | Therapy Types | Drugs | Outcome |
| DLG2 | SNV | Missense_Mutation | c.664G>A | p.Asp222Asn | p.D222N | Q15700 | protein_coding | deleterious(0.01) | probably_damaging(0.995) | TCGA-AC-A23H-01 | Breast | breast invasive carcinoma | Female | >=65 | I/II | Unknown | Unknown | PD | |
| DLG2 | SNV | Missense_Mutation | novel | c.1121C>T | p.Ser374Leu | p.S374L | Q15700 | protein_coding | tolerated(0.06) | probably_damaging(0.995) | TCGA-D8-A73U-01 | Breast | breast invasive carcinoma | Female | >=65 | I/II | Hormone Therapy | tamoxiphen | SD |
| DLG2 | insertion | Nonsense_Mutation | novel | c.625-1_625insCCAGCATAGCCAAACCCCATCTCTA | p.Gly209ProfsTer3 | p.G209Pfs*3 | Q15700 | protein_coding | TCGA-A2-A0CP-01 | Breast | breast invasive carcinoma | Female | <65 | I/II | Chemotherapy | cytoxan | SD | ||
| DLG2 | SNV | Missense_Mutation | novel | c.1898N>T | p.Ser633Phe | p.S633F | Q15700 | protein_coding | deleterious(0) | probably_damaging(0.966) | TCGA-2W-A8YY-01 | Cervix | cervical & endocervical cancer | Female | <65 | I/II | Chemotherapy | cisplatin | CR |
| DLG2 | SNV | Missense_Mutation | novel | c.98N>C | p.Lys33Thr | p.K33T | Q15700 | protein_coding | deleterious_low_confidence(0.01) | probably_damaging(0.969) | TCGA-2W-A8YY-01 | Cervix | cervical & endocervical cancer | Female | <65 | I/II | Chemotherapy | cisplatin | CR |
| DLG2 | SNV | Missense_Mutation | c.2706A>C | p.Lys902Asn | p.K902N | Q15700 | protein_coding | deleterious(0) | possibly_damaging(0.676) | TCGA-C5-A2LY-01 | Cervix | cervical & endocervical cancer | Female | <65 | I/II | Chemotherapy | cisplatin | SD | |
| DLG2 | SNV | Missense_Mutation | c.106N>A | p.Glu36Lys | p.E36K | Q15700 | protein_coding | deleterious_low_confidence(0.04) | probably_damaging(0.953) | TCGA-EK-A2RN-01 | Cervix | cervical & endocervical cancer | Female | <65 | I/II | Unknown | Unknown | SD | |
| DLG2 | SNV | Missense_Mutation | rs150043290 | c.365N>A | p.Arg122Gln | p.R122Q | Q15700 | protein_coding | deleterious_low_confidence(0.04) | benign(0.226) | TCGA-FU-A3HZ-01 | Cervix | cervical & endocervical cancer | Female | <65 | I/II | Chemotherapy | cisplatin | CR |
| DLG2 | SNV | Missense_Mutation | novel | c.9N>G | p.Ile3Met | p.I3M | Q15700 | protein_coding | deleterious_low_confidence(0) | benign(0.248) | TCGA-VS-A8EL-01 | Cervix | cervical & endocervical cancer | Female | <65 | I/II | Chemotherapy | cisplatin | CR |
| DLG2 | SNV | Missense_Mutation | c.1567G>C | p.Glu523Gln | p.E523Q | Q15700 | protein_coding | deleterious(0.01) | probably_damaging(0.996) | TCGA-VS-A9UI-01 | Cervix | cervical & endocervical cancer | Female | >=65 | I/II | Unknown | Unknown | SD |
| Page: 1 2 3 4 5 6 7 8 9 10 11 12 13 14 15 16 17 18 19 20 |
Top |
Related drugs of malignant transformation related genes |
| Identification of chemicals and drugs interact with genes involved in malignant transfromation |
| (DGIdb 4.0) |
| Entrez ID | Symbol | Category | Interaction Types | Drug Claim Name | Drug Name | PMIDs |
| Page: 1 |

Copyright 2023-Present -The University of Texas Health Science Center at Houston |