
|
|||||
|
 | |
| |
| |
| |
| |
| |
|
Gene: DEFB1 |
Gene summary for DEFB1 |
| Gene information | Species | Human | Gene symbol | DEFB1 | Gene ID | 1672 |
| Gene name | defensin beta 1 | |
| Gene Alias | BD1 | |
| Cytomap | 8p23.1 | |
| Gene Type | protein-coding | GO ID | GO:0000003 | UniProtAcc | P60022 |
Top |
Malignant transformation analysis |
| Identification of the aberrant gene expression in precancerous and cancerous lesions by comparing the gene expression of stem-like cells in diseased tissues with normal stem cells |
| Entrez ID | Symbol | Replicates | Species | Organ | Tissue | Adj P-value | Log2FC | Malignancy |
| 1672 | DEFB1 | CA_HPV_1 | Human | Cervix | CC | 7.29e-24 | -7.52e-01 | 0.0264 |
| 1672 | DEFB1 | CA_HPV_2 | Human | Cervix | CC | 2.10e-20 | -7.15e-01 | 0.0391 |
| 1672 | DEFB1 | CA_HPV_3 | Human | Cervix | CC | 1.17e-13 | -6.12e-01 | 0.0414 |
| 1672 | DEFB1 | HSIL_HPV_1 | Human | Cervix | HSIL_HPV | 3.47e-08 | -5.99e-01 | 0.0116 |
| 1672 | DEFB1 | N_HPV_1 | Human | Cervix | N_HPV | 1.95e-17 | -6.85e-01 | 0.0079 |
| 1672 | DEFB1 | N_HPV_2 | Human | Cervix | N_HPV | 2.00e-03 | -2.12e-01 | -0.0131 |
| 1672 | DEFB1 | CCI_1 | Human | Cervix | CC | 2.66e-04 | -7.48e-01 | 0.528 |
| 1672 | DEFB1 | CCI_2 | Human | Cervix | CC | 8.74e-07 | -8.09e-01 | 0.5249 |
| 1672 | DEFB1 | CCI_3 | Human | Cervix | CC | 3.96e-08 | -7.93e-01 | 0.516 |
| 1672 | DEFB1 | CCII_1 | Human | Cervix | CC | 2.21e-11 | -7.86e-01 | 0.3249 |
| 1672 | DEFB1 | Tumor | Human | Cervix | CC | 1.03e-18 | 6.41e-01 | 0.1241 |
| 1672 | DEFB1 | sample1 | Human | Cervix | CC | 4.53e-04 | -6.02e-01 | 0.0959 |
| 1672 | DEFB1 | sample3 | Human | Cervix | CC | 2.86e-26 | 4.76e-01 | 0.1387 |
| 1672 | DEFB1 | H2 | Human | Cervix | HSIL_HPV | 1.20e-02 | 2.48e-01 | 0.0632 |
| 1672 | DEFB1 | T1 | Human | Cervix | CC | 4.06e-13 | -6.67e-01 | 0.0918 |
| 1672 | DEFB1 | T2 | Human | Cervix | CC | 7.94e-03 | 3.02e-01 | 0.0709 |
| 1672 | DEFB1 | T3 | Human | Cervix | CC | 6.88e-23 | 4.85e-01 | 0.1389 |
| 1672 | DEFB1 | AEH-subject3 | Human | Endometrium | AEH | 4.74e-06 | -3.82e-01 | -0.2576 |
| 1672 | DEFB1 | AEH-subject5 | Human | Endometrium | AEH | 1.16e-04 | -3.84e-01 | -0.2953 |
| 1672 | DEFB1 | EEC-subject1 | Human | Endometrium | EEC | 2.40e-10 | -4.41e-01 | -0.2682 |
| Page: 1 2 3 4 5 6 7 8 |
| Tissue | Expression Dynamics | Abbreviation |
| Cervix | 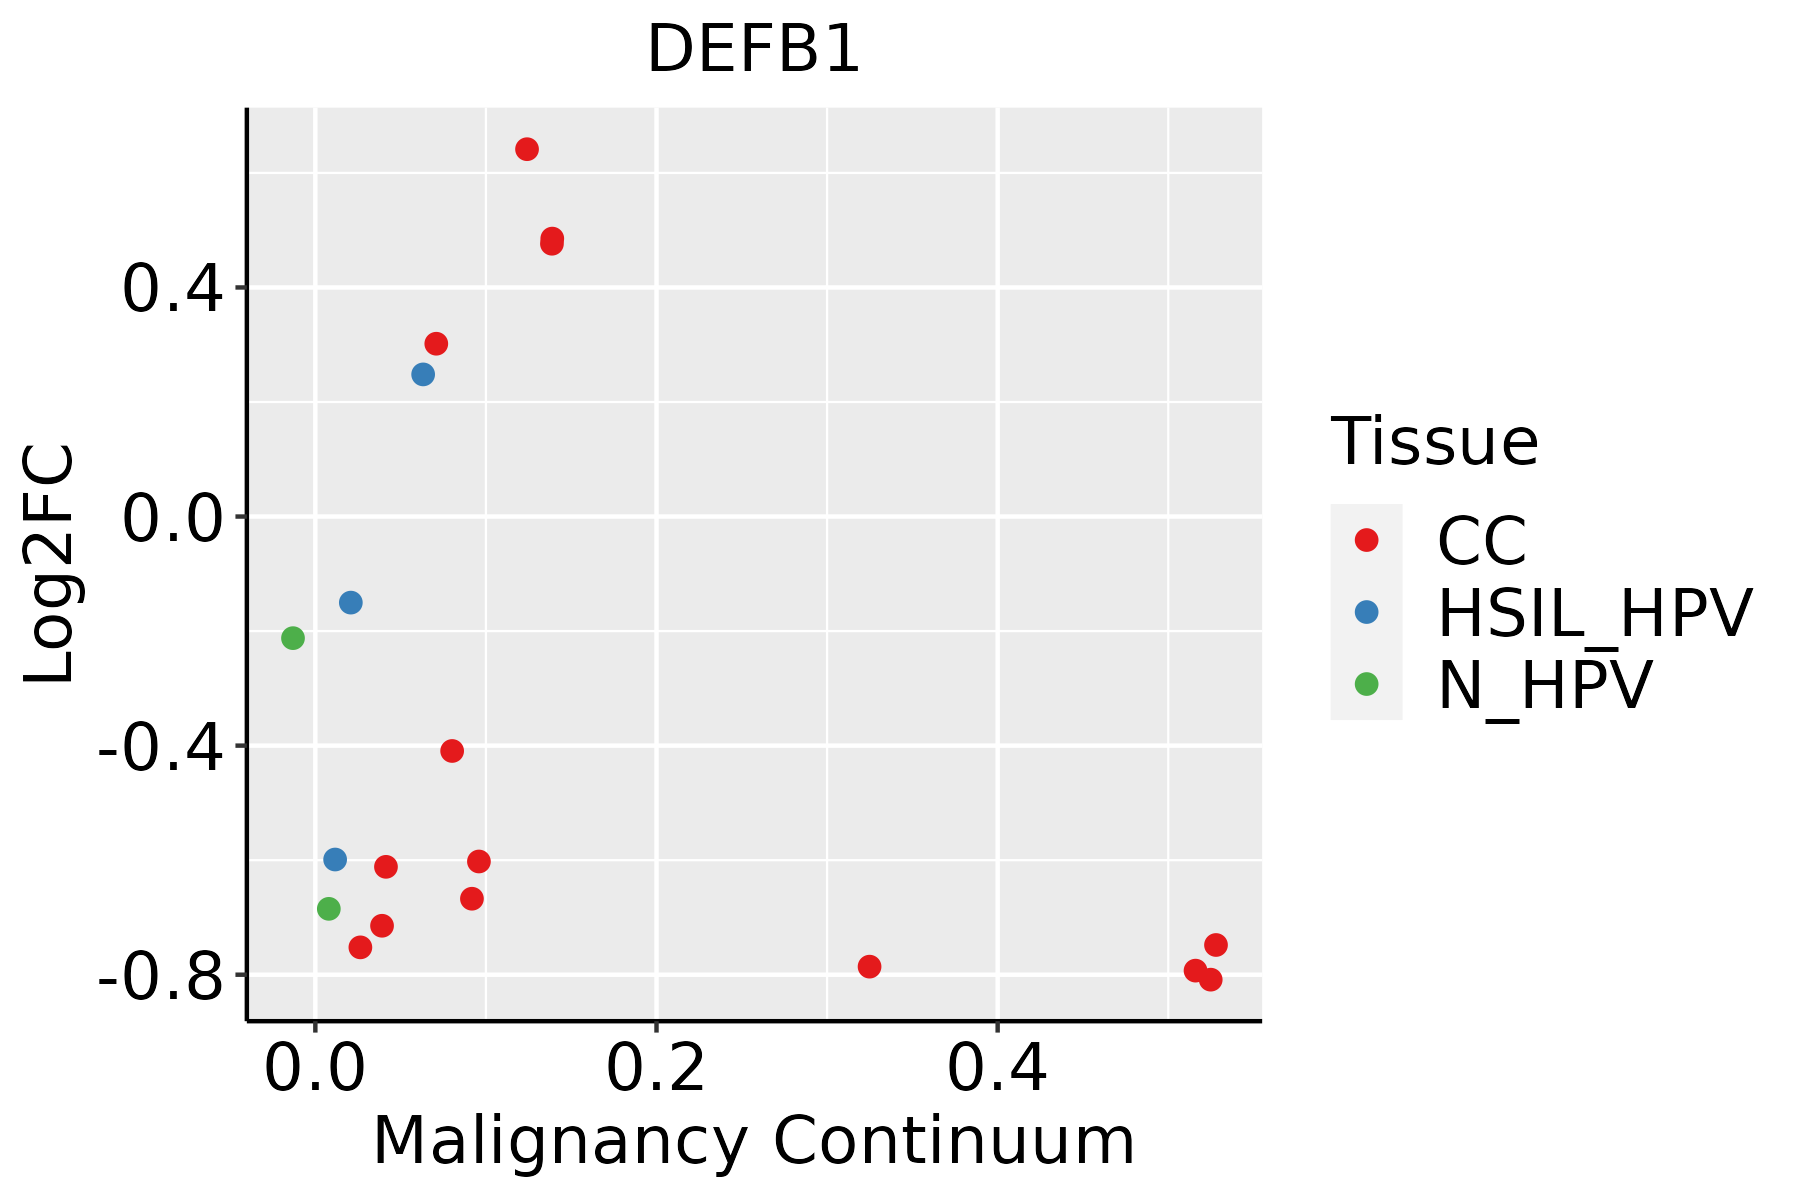 | CC: Cervix cancer |
| HSIL_HPV: HPV-infected high-grade squamous intraepithelial lesions | ||
| N_HPV: HPV-infected normal cervix | ||
| Endometrium | 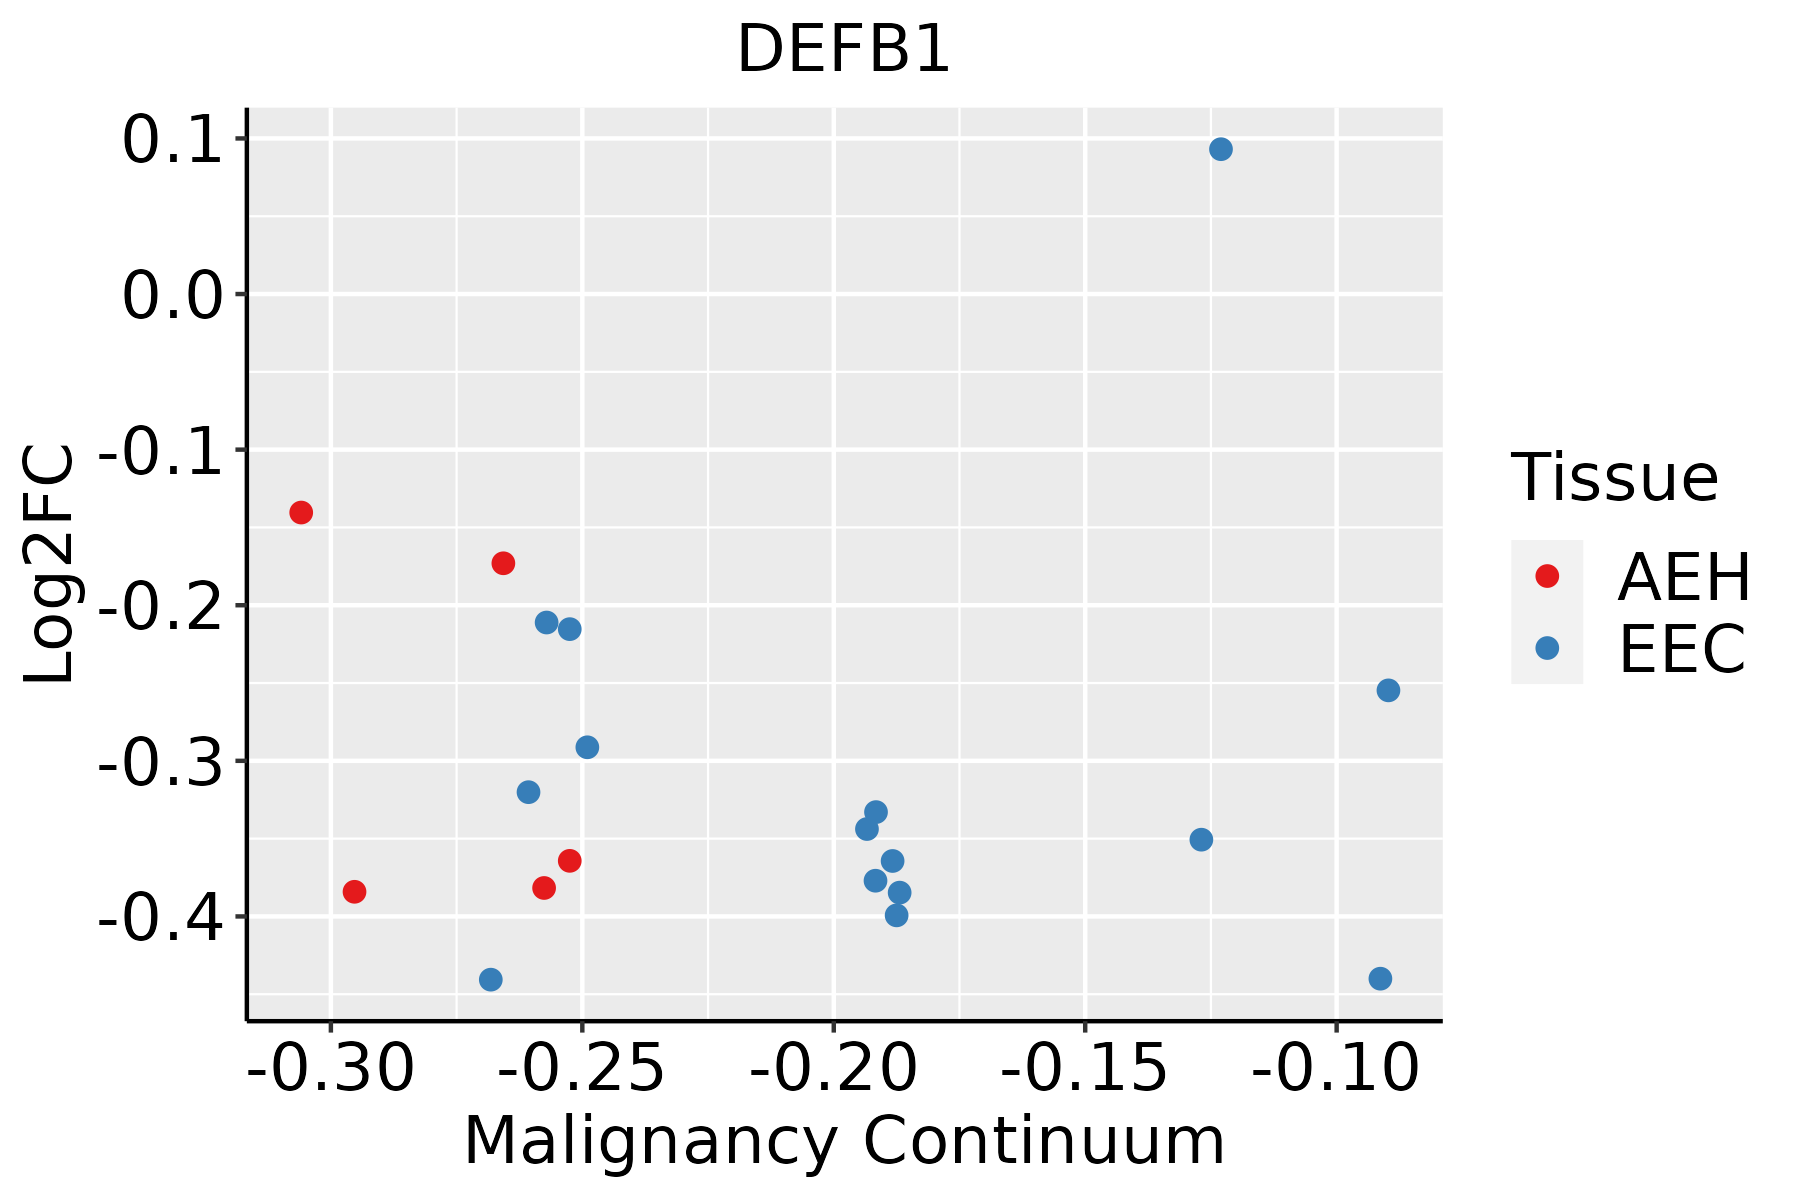 | AEH: Atypical endometrial hyperplasia |
| EEC: Endometrioid Cancer | ||
| Esophagus |  | ESCC: Esophageal squamous cell carcinoma |
| HGIN: High-grade intraepithelial neoplasias | ||
| LGIN: Low-grade intraepithelial neoplasias | ||
| Liver | 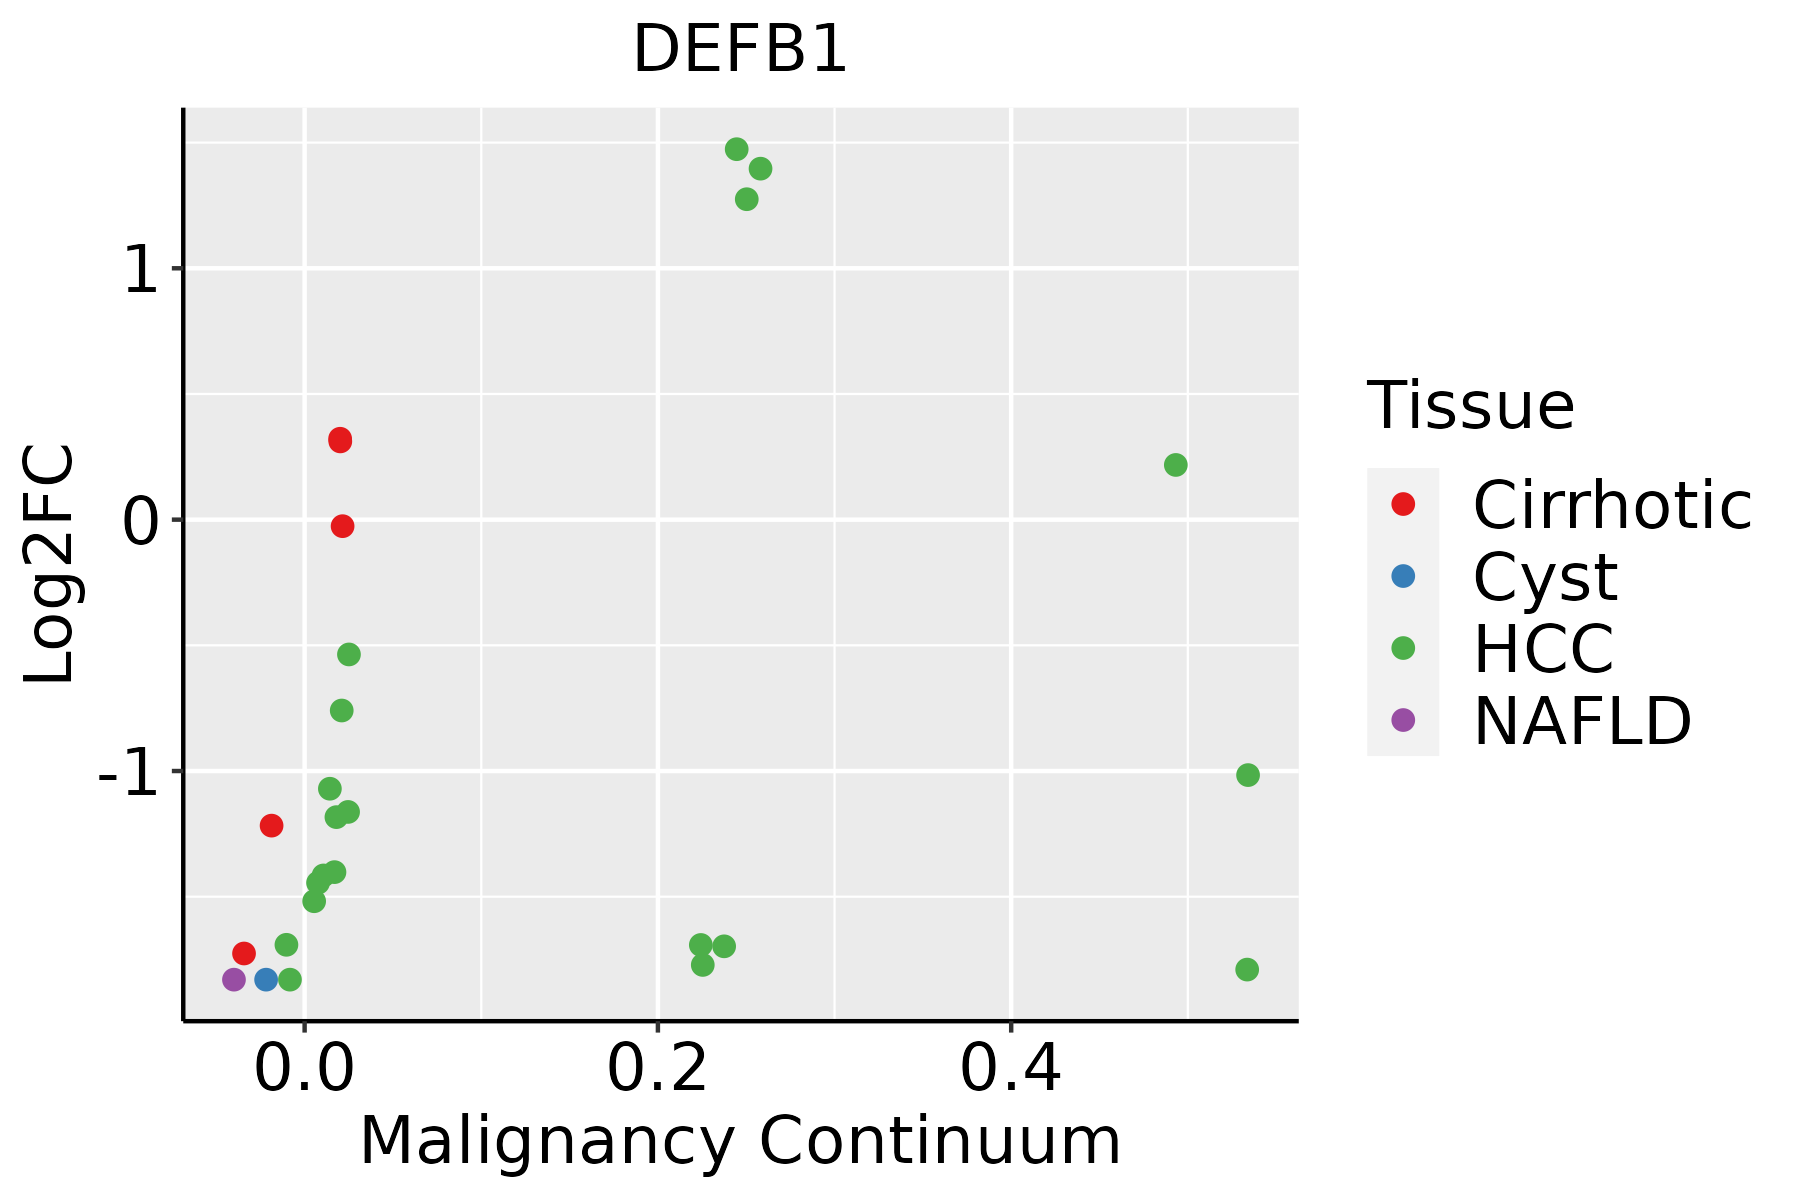 | HCC: Hepatocellular carcinoma |
| NAFLD: Non-alcoholic fatty liver disease | ||
| Oral Cavity |  | EOLP: Erosive Oral lichen planus |
| LP: leukoplakia | ||
| NEOLP: Non-erosive oral lichen planus | ||
| OSCC: Oral squamous cell carcinoma | ||
| Prostate | 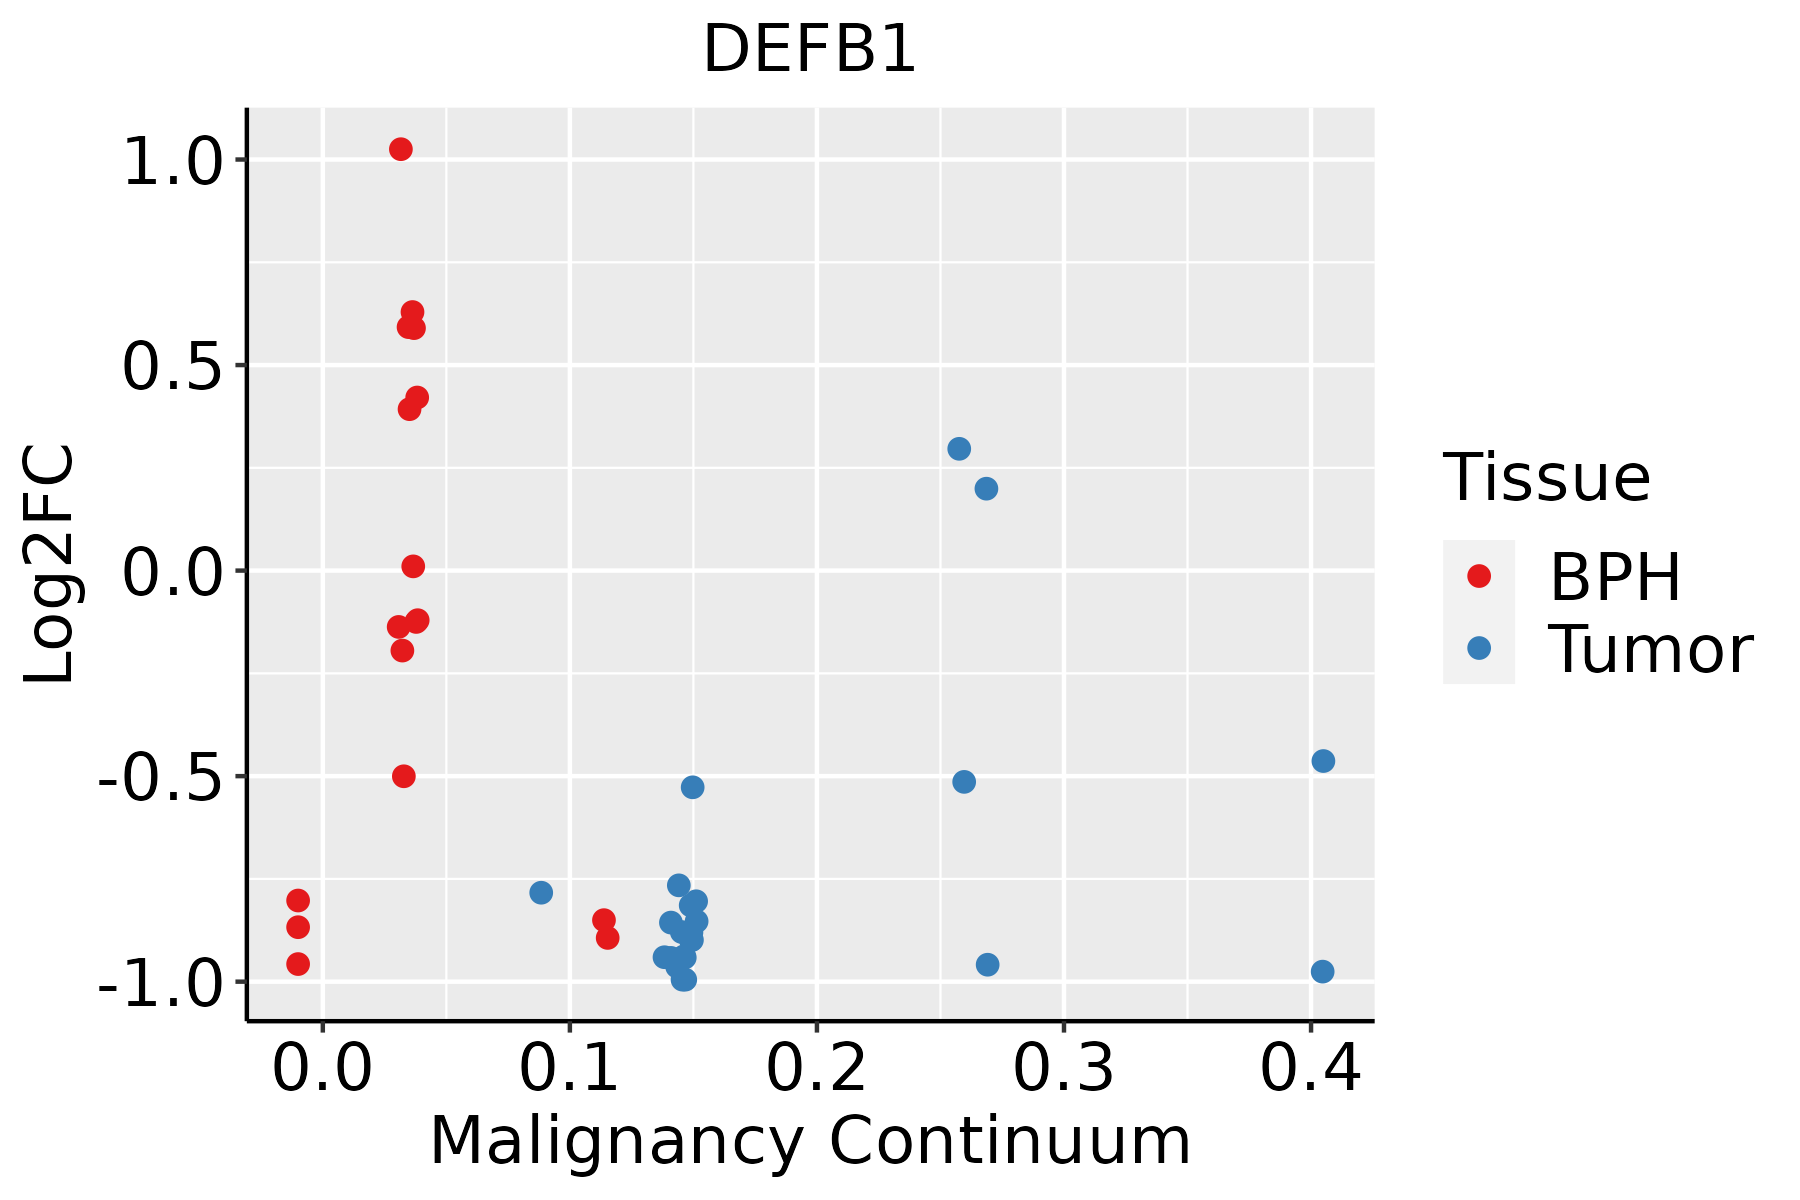 | BPH: Benign Prostatic Hyperplasia |
| Skin |  | AK: Actinic keratosis |
| cSCC: Cutaneous squamous cell carcinoma | ||
| SCCIS:squamous cell carcinoma in situ |
| ∗log2FC in expression of this searched gene in stem-like cells from each diseased tissue sample relative to stem-like cells in normal samples in each tissue plotted against the malignancy continuum. Samples are colored based on if they are from different disease stage. |
Top |
Malignant transformation related pathway analysis |
| Find out the enriched GO biological processes and KEGG pathways involved in transition from healthy to precancer to cancer |
| Tissue | Disease Stage | Enriched GO biological Processes |
| Colorectum | AD |  |
| Colorectum | SER |  |
| Colorectum | MSS |  |
| Colorectum | MSI-H |  |
| Colorectum | FAP |  |
| ∗Top 15 enriched GO BP terms are showed in the bar plot of each disease state in each tissue. Each row represents a significant GO biological process which is colored according to the -log10(p.adjust). |
| Page: 1 2 3 4 5 6 7 8 9 |
| GO ID | Tissue | Disease Stage | Description | Gene Ratio | Bg Ratio | pvalue | p.adjust | Count |
| GO:00328862 | Prostate | BPH | regulation of microtubule-based process | 64/3107 | 240/18723 | 4.93e-05 | 5.11e-04 | 64 |
| GO:003288611 | Prostate | Tumor | regulation of microtubule-based process | 65/3246 | 240/18723 | 1.00e-04 | 9.73e-04 | 65 |
| GO:003288612 | Skin | cSCC | regulation of microtubule-based process | 82/4864 | 240/18723 | 2.82e-03 | 1.58e-02 | 82 |
| Page: 1 2 |
| Pathway ID | Tissue | Disease Stage | Description | Gene Ratio | Bg Ratio | pvalue | p.adjust | qvalue | Count |
| hsa051504 | Cervix | HSIL_HPV | Staphylococcus aureus infection | 21/459 | 96/8465 | 2.93e-08 | 1.43e-06 | 1.16e-06 | 21 |
| hsa0515011 | Cervix | HSIL_HPV | Staphylococcus aureus infection | 21/459 | 96/8465 | 2.93e-08 | 1.43e-06 | 1.16e-06 | 21 |
| hsa051502 | Cervix | N_HPV | Staphylococcus aureus infection | 15/349 | 96/8465 | 7.81e-06 | 1.01e-04 | 7.90e-05 | 15 |
| hsa051503 | Cervix | N_HPV | Staphylococcus aureus infection | 15/349 | 96/8465 | 7.81e-06 | 1.01e-04 | 7.90e-05 | 15 |
| Page: 1 |
Top |
Cell-cell communication analysis |
| Identification of potential cell-cell interactions between two cell types and their ligand-receptor pairs for different disease states |
| Ligand | Receptor | LRpair | Pathway | Tissue | Disease Stage |
| Page: 1 |
Top |
Single-cell gene regulatory network inference analysis |
| Find out the significant the regulons (TFs) and the target genes of each regulon across cell types for different disease states |
| TF | Cell Type | Tissue | Disease Stage | Target Gene | RSS | Regulon Activity |
| ∗The dot plots of a searched regulon are shown for all cell subpopulations in each disease state of each tissue based on the regulon specific score inferred using pySCENIC and by calculating the average expression. |
| Page: 1 |
Top |
Somatic mutation of malignant transformation related genes |
| Annotation of somatic variants for genes involved in malignant transformation |
| Hugo Symbol | Variant Class | Variant Classification | dbSNP RS | HGVSc | HGVSp | HGVSp Short | SWISSPROT | BIOTYPE | SIFT | PolyPhen | Tumor Sample Barcode | Tissue | Histology | Sex | Age | Stage | Therapy Types | Drugs | Outcome |
| DEFB1 | SNV | Missense_Mutation | c.8N>A | p.Thr3Asn | p.T3N | P60022 | protein_coding | deleterious(0.05) | benign(0.202) | TCGA-D8-A147-01 | Breast | breast invasive carcinoma | Female | <65 | I/II | Chemotherapy | doxorubicine | SD | |
| DEFB1 | SNV | Missense_Mutation | novel | c.166N>G | p.Gln56Glu | p.Q56E | P60022 | protein_coding | tolerated(1) | benign(0) | TCGA-EA-A3HU-01 | Cervix | cervical & endocervical cancer | Female | <65 | I/II | Unknown | Unknown | SD |
| DEFB1 | SNV | Missense_Mutation | novel | c.100C>G | p.His34Asp | p.H34D | P60022 | protein_coding | tolerated(0.12) | benign(0.01) | TCGA-EA-A43B-01 | Cervix | cervical & endocervical cancer | Female | <65 | I/II | Chemotherapy | cisplatin | CR |
| DEFB1 | SNV | Missense_Mutation | novel | c.100C>A | p.His34Asn | p.H34N | P60022 | protein_coding | deleterious(0.04) | benign(0.017) | TCGA-FI-A2D5-01 | Endometrium | uterine corpus endometrioid carcinoma | Female | <65 | III/IV | Chemotherapy | carboplatinum | PD |
| DEFB1 | SNV | Missense_Mutation | c.128N>G | p.Gln43Arg | p.Q43R | P60022 | protein_coding | tolerated(0.35) | benign(0.114) | TCGA-18-4721-01 | Lung | lung squamous cell carcinoma | Male | >=65 | I/II | Unknown | Unknown | SD | |
| DEFB1 | SNV | Missense_Mutation | novel | c.203A>C | p.Lys68Thr | p.K68T | P60022 | protein_coding | deleterious_low_confidence(0.02) | benign(0.003) | TCGA-22-1016-01 | Lung | lung squamous cell carcinoma | Male | >=65 | I/II | Unknown | Unknown | SD |
| DEFB1 | SNV | Missense_Mutation | c.14A>G | p.Tyr5Cys | p.Y5C | P60022 | protein_coding | tolerated(0.18) | benign(0.003) | TCGA-CD-A4MG-01 | Stomach | stomach adenocarcinoma | Male | >=65 | I/II | Unknown | Unknown | PD |
| Page: 1 |
Top |
Related drugs of malignant transformation related genes |
| Identification of chemicals and drugs interact with genes involved in malignant transfromation |
| (DGIdb 4.0) |
| Entrez ID | Symbol | Category | Interaction Types | Drug Claim Name | Drug Name | PMIDs |
| Page: 1 |

Copyright 2023-Present -The University of Texas Health Science Center at Houston |