Schematic overview of the cellular and molecular mechanisms involved in the cancer progression, including the proposed cellular and molecular mechanisms in cancer cells trajectory. AT1: alveolar type 1 cells; AT2: alveolar type 2 cells; AAH: atypical adenomatous hyperplasia; AIS: adenocarcinoma in situ; MIA: minimally invasive adenocarcinoma; IA: invasive adenocarcinoma; EMT: epithelial-mesenchymal transition

Home

Download

Statistics

Help

Contact

Center for Computational Systems Medicine
leaf

Gene summary

leaf

Malignant transformation analysis

leaf

Malignant transformation related pathway analysis

leaf

Cell-cell communication analysis

leaf

Single-cell gene regulatory network inference analysis

leaf

Somatic mutation of malignant transformation related genes

leaf

Related drugs of malignant transformation related genes

Gene: DDX60

Gene summary for DDX60

check button Gene summary.

Gene informationSpeciesHuman
Gene symbol

DDX60

Gene ID

55601

Gene nameDExD/H-box helicase 60
Gene AliasDDX60
Cytomap4q32.3
Gene Typeprotein-coding
GO ID

GO:0002221

UniProtAcc

Q6B0F7


Top

Malignant transformation analysis

check button Identification of the aberrant gene expression in precancerous and cancerous lesions by comparing the gene expression of stem-like cells in diseased tissues with normal stem cells
check button Malignant transformation involving gene list.
Entrez IDSymbolReplicatesSpeciesOrganTissueAdj P-valueLog2FCMalignancy
55601DDX60LZE5THumanEsophagusESCC1.95e-022.61e-010.0514
55601DDX60LZE8THumanEsophagusESCC2.74e-041.37e-010.067
55601DDX60LZE20THumanEsophagusESCC9.67e-071.67e-010.0662
55601DDX60LZE24THumanEsophagusESCC1.73e-155.58e-010.0596
55601DDX60P1T-EHumanEsophagusESCC3.60e-062.58e-010.0875
55601DDX60P2T-EHumanEsophagusESCC9.23e-488.57e-010.1177
55601DDX60P4T-EHumanEsophagusESCC6.03e-058.93e-020.1323
55601DDX60P5T-EHumanEsophagusESCC6.03e-081.97e-010.1327
55601DDX60P8T-EHumanEsophagusESCC1.40e-123.02e-010.0889
55601DDX60P9T-EHumanEsophagusESCC5.04e-151.50e-010.1131
55601DDX60P11T-EHumanEsophagusESCC6.89e-104.83e-010.1426
55601DDX60P12T-EHumanEsophagusESCC6.61e-092.34e-010.1122
55601DDX60P15T-EHumanEsophagusESCC4.90e-083.47e-010.1149
55601DDX60P17T-EHumanEsophagusESCC1.88e-084.10e-010.1278
55601DDX60P20T-EHumanEsophagusESCC5.53e-123.44e-010.1124
55601DDX60P21T-EHumanEsophagusESCC2.71e-144.34e-010.1617
55601DDX60P22T-EHumanEsophagusESCC1.89e-091.04e-010.1236
55601DDX60P23T-EHumanEsophagusESCC1.13e-041.95e-010.108
55601DDX60P24T-EHumanEsophagusESCC4.51e-215.26e-010.1287
55601DDX60P26T-EHumanEsophagusESCC9.22e-102.75e-010.1276
Page: 1 2 3 4 5 

check button Transcriptomic changes along malignancy continuum.
TissueExpression DynamicsAbbreviation
EsophagusThe image shows the transcriptomic changes along malignancy continuum.log2FC in expression of this searched gene in stem-like cells from each diseased tissue sample relative to stem-like cells in normal samples in each tissue plotted against the malignancy continuum. Samples are colored based on if they are from different disease stage.
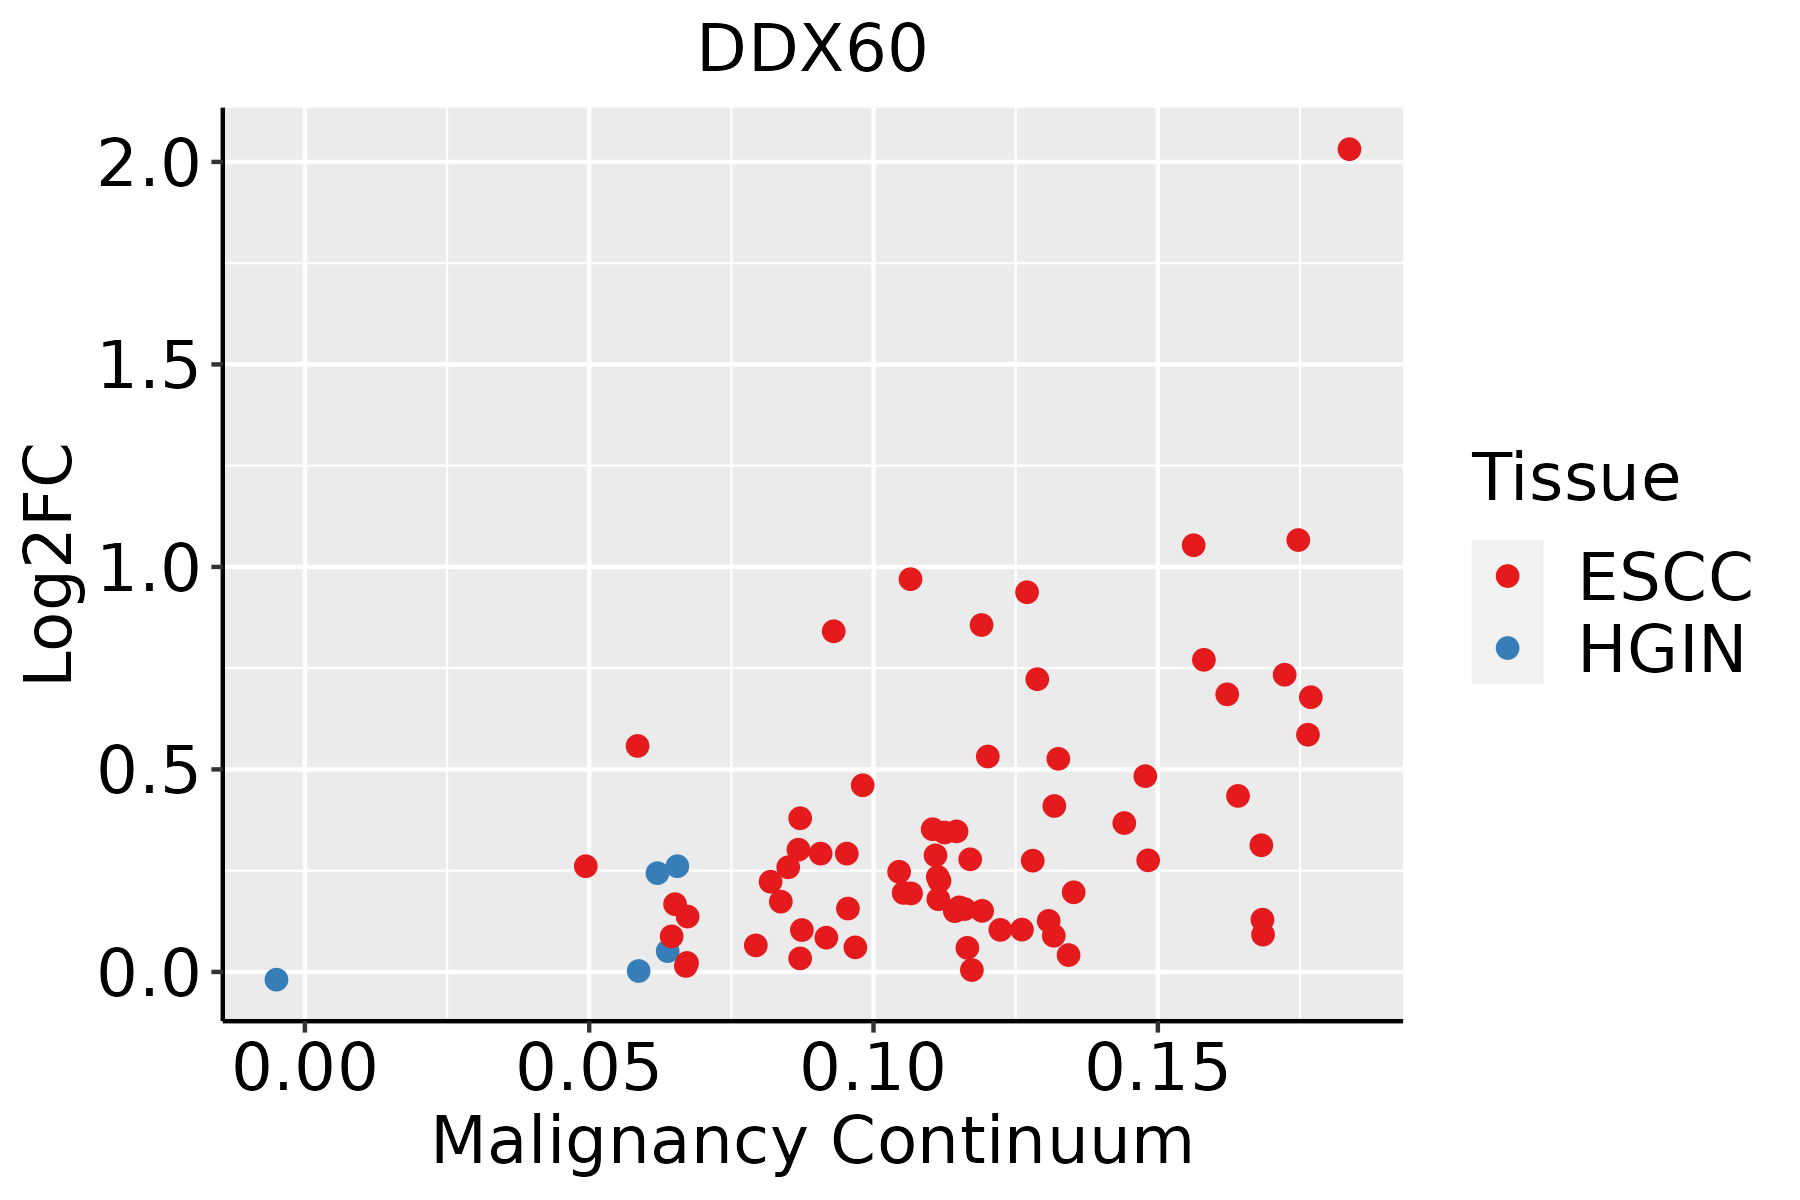
ESCC: Esophageal squamous cell carcinoma
HGIN: High-grade intraepithelial neoplasias
LGIN: Low-grade intraepithelial neoplasias
LiverThe image shows the transcriptomic changes along malignancy continuum.log2FC in expression of this searched gene in stem-like cells from each diseased tissue sample relative to stem-like cells in normal samples in each tissue plotted against the malignancy continuum. Samples are colored based on if they are from different disease stage.
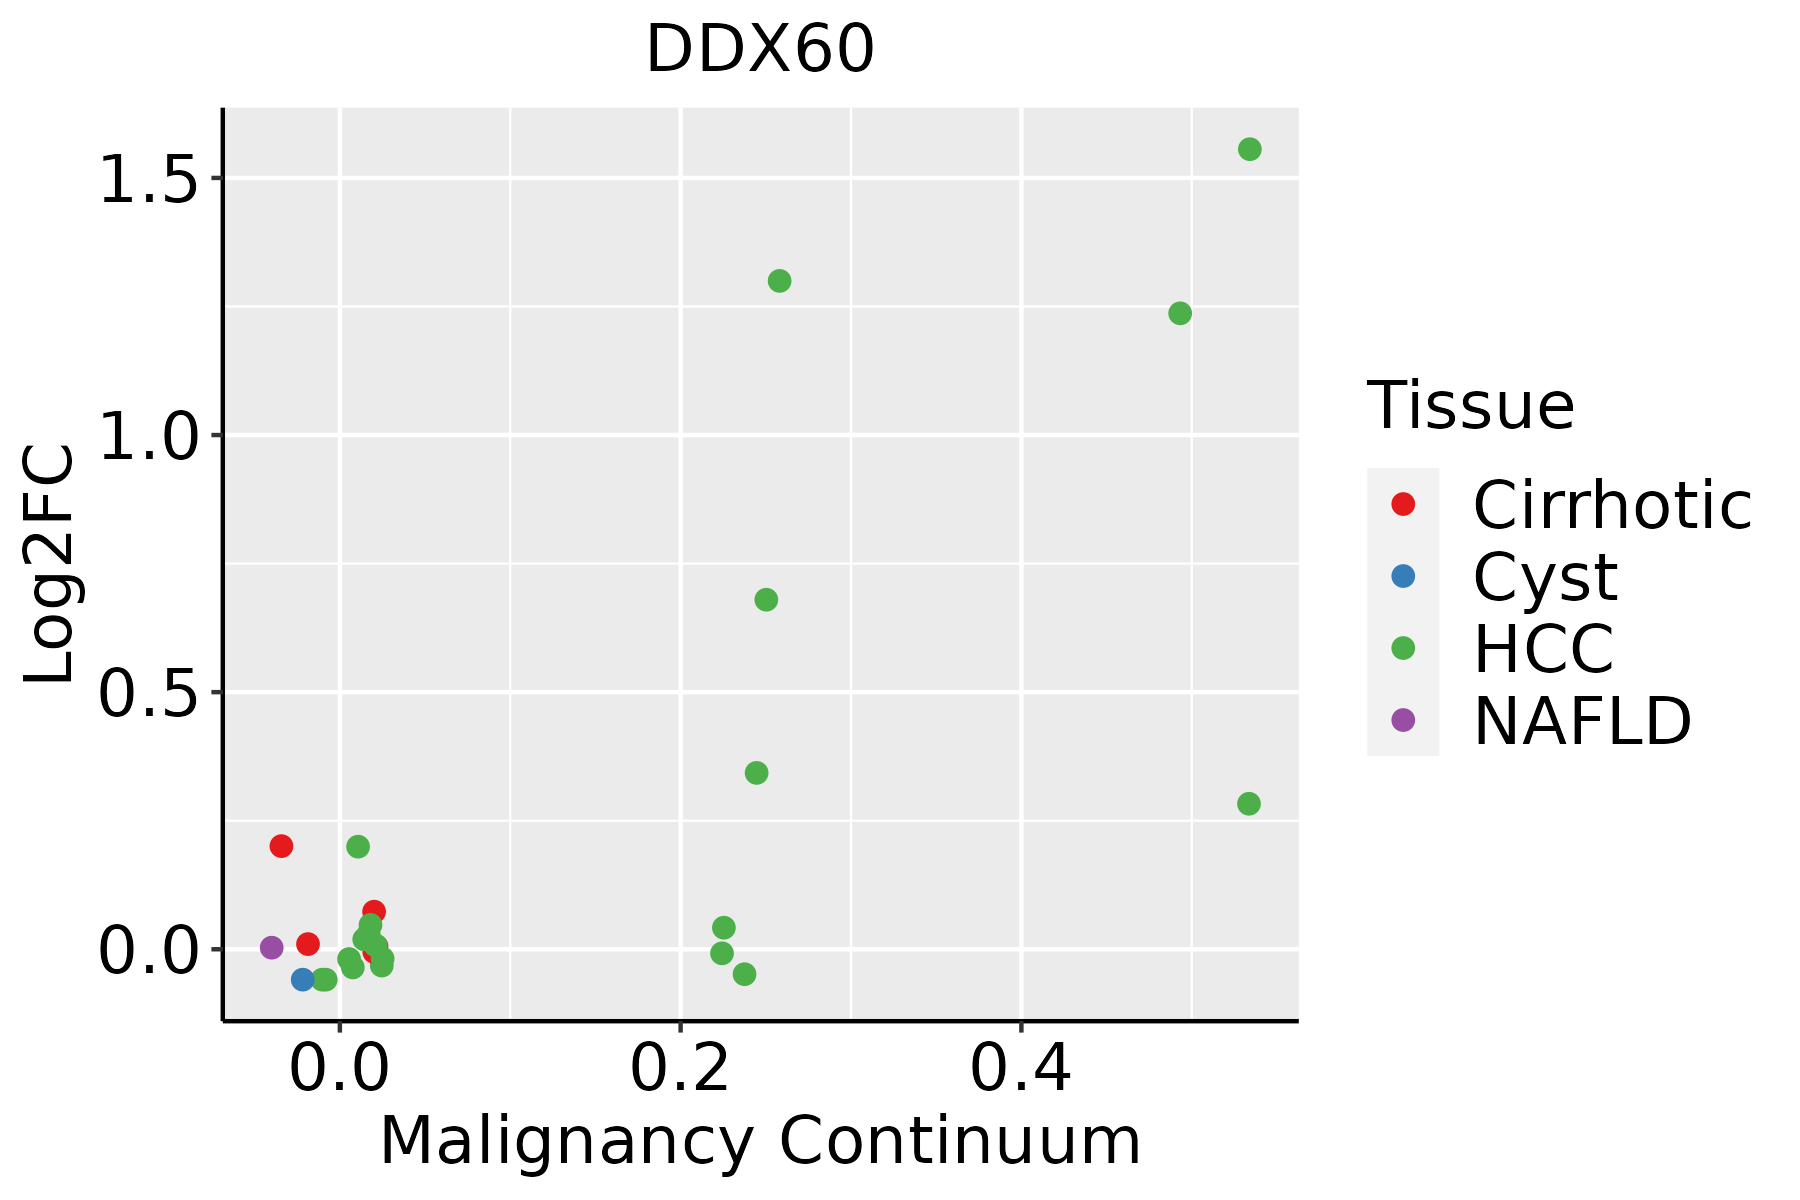
HCC: Hepatocellular carcinoma
NAFLD: Non-alcoholic fatty liver disease
Oral CavityThe image shows the transcriptomic changes along malignancy continuum.log2FC in expression of this searched gene in stem-like cells from each diseased tissue sample relative to stem-like cells in normal samples in each tissue plotted against the malignancy continuum. Samples are colored based on if they are from different disease stage.EOLP: Erosive Oral lichen planus
LP: leukoplakia
NEOLP: Non-erosive oral lichen planus
OSCC: Oral squamous cell carcinoma
SkinThe image shows the transcriptomic changes along malignancy continuum.log2FC in expression of this searched gene in stem-like cells from each diseased tissue sample relative to stem-like cells in normal samples in each tissue plotted against the malignancy continuum. Samples are colored based on if they are from different disease stage.
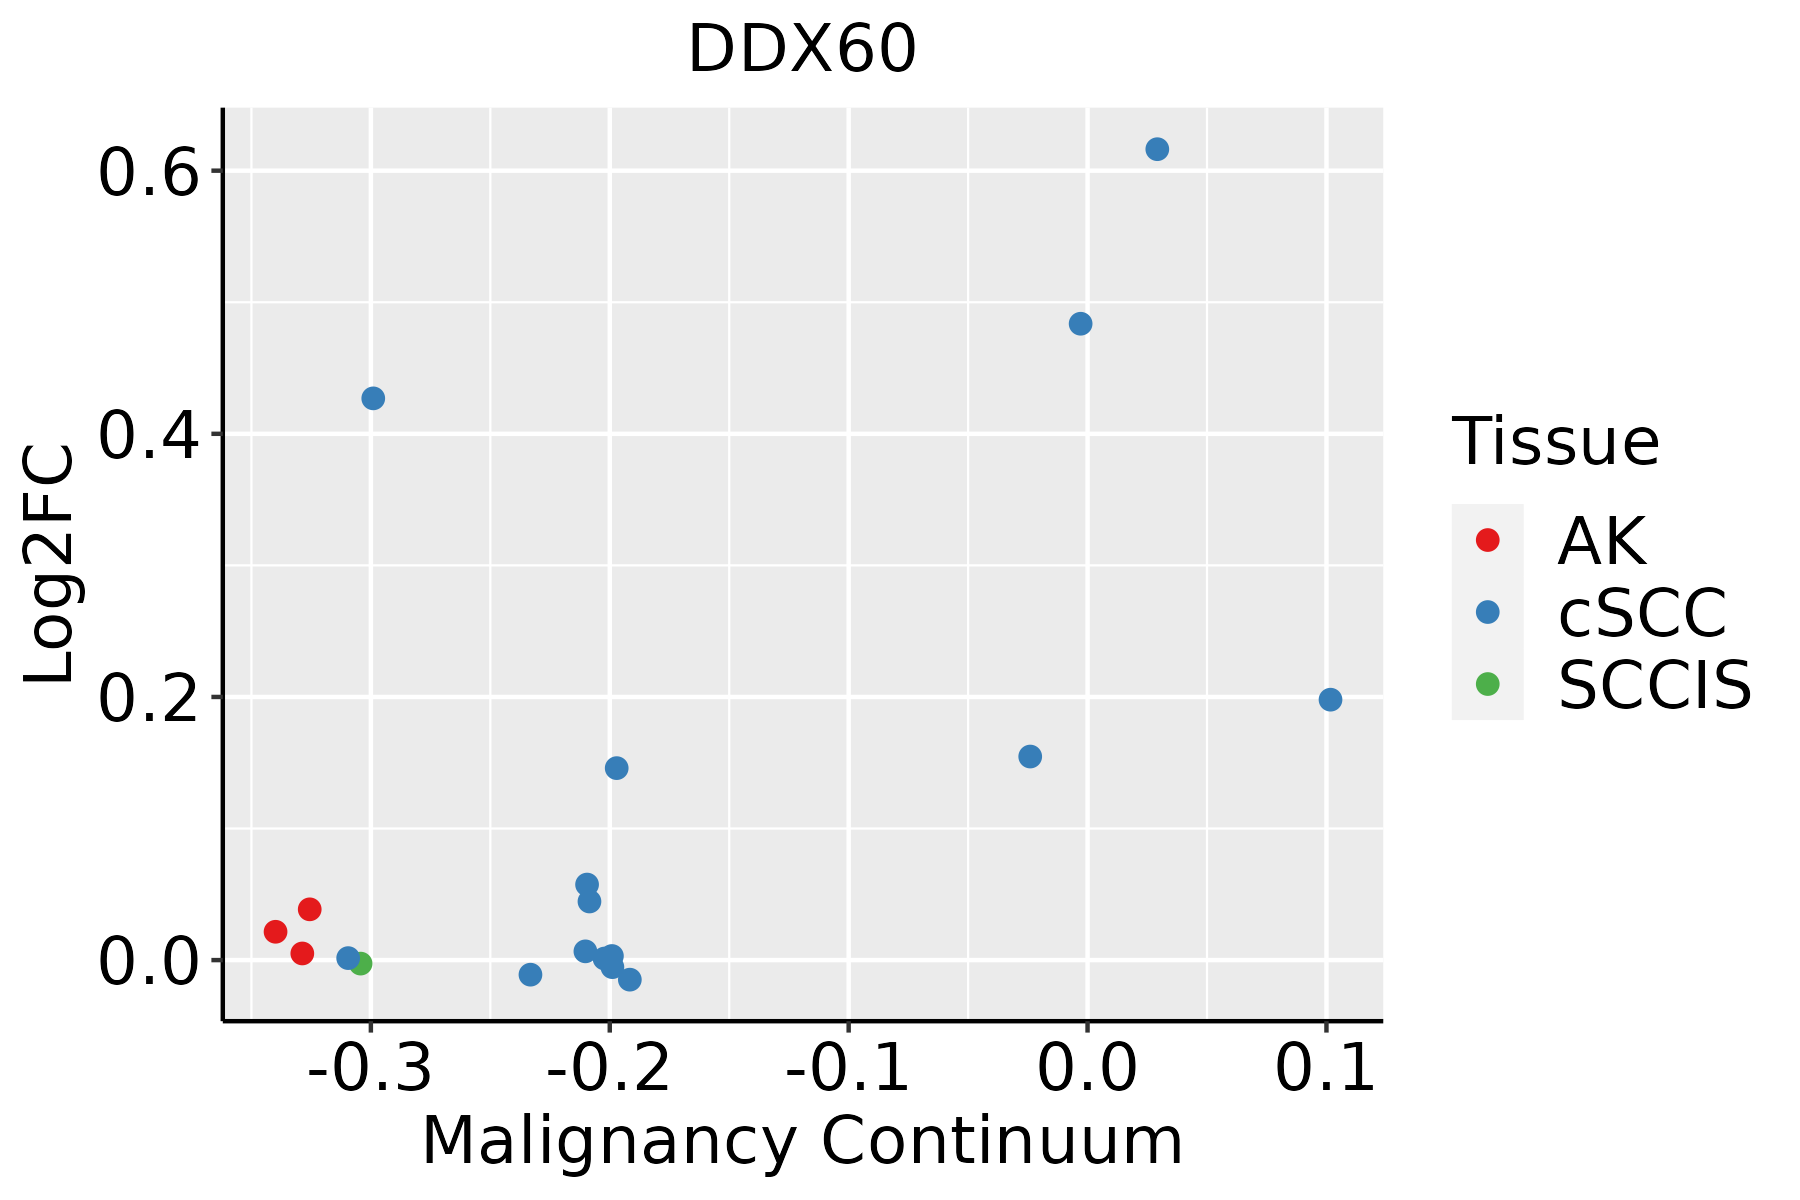
AK: Actinic keratosis
cSCC: Cutaneous squamous cell carcinoma
SCCIS:squamous cell carcinoma in situ
ThyroidThe image shows the transcriptomic changes along malignancy continuum.log2FC in expression of this searched gene in stem-like cells from each diseased tissue sample relative to stem-like cells in normal samples in each tissue plotted against the malignancy continuum. Samples are colored based on if they are from different disease stage.
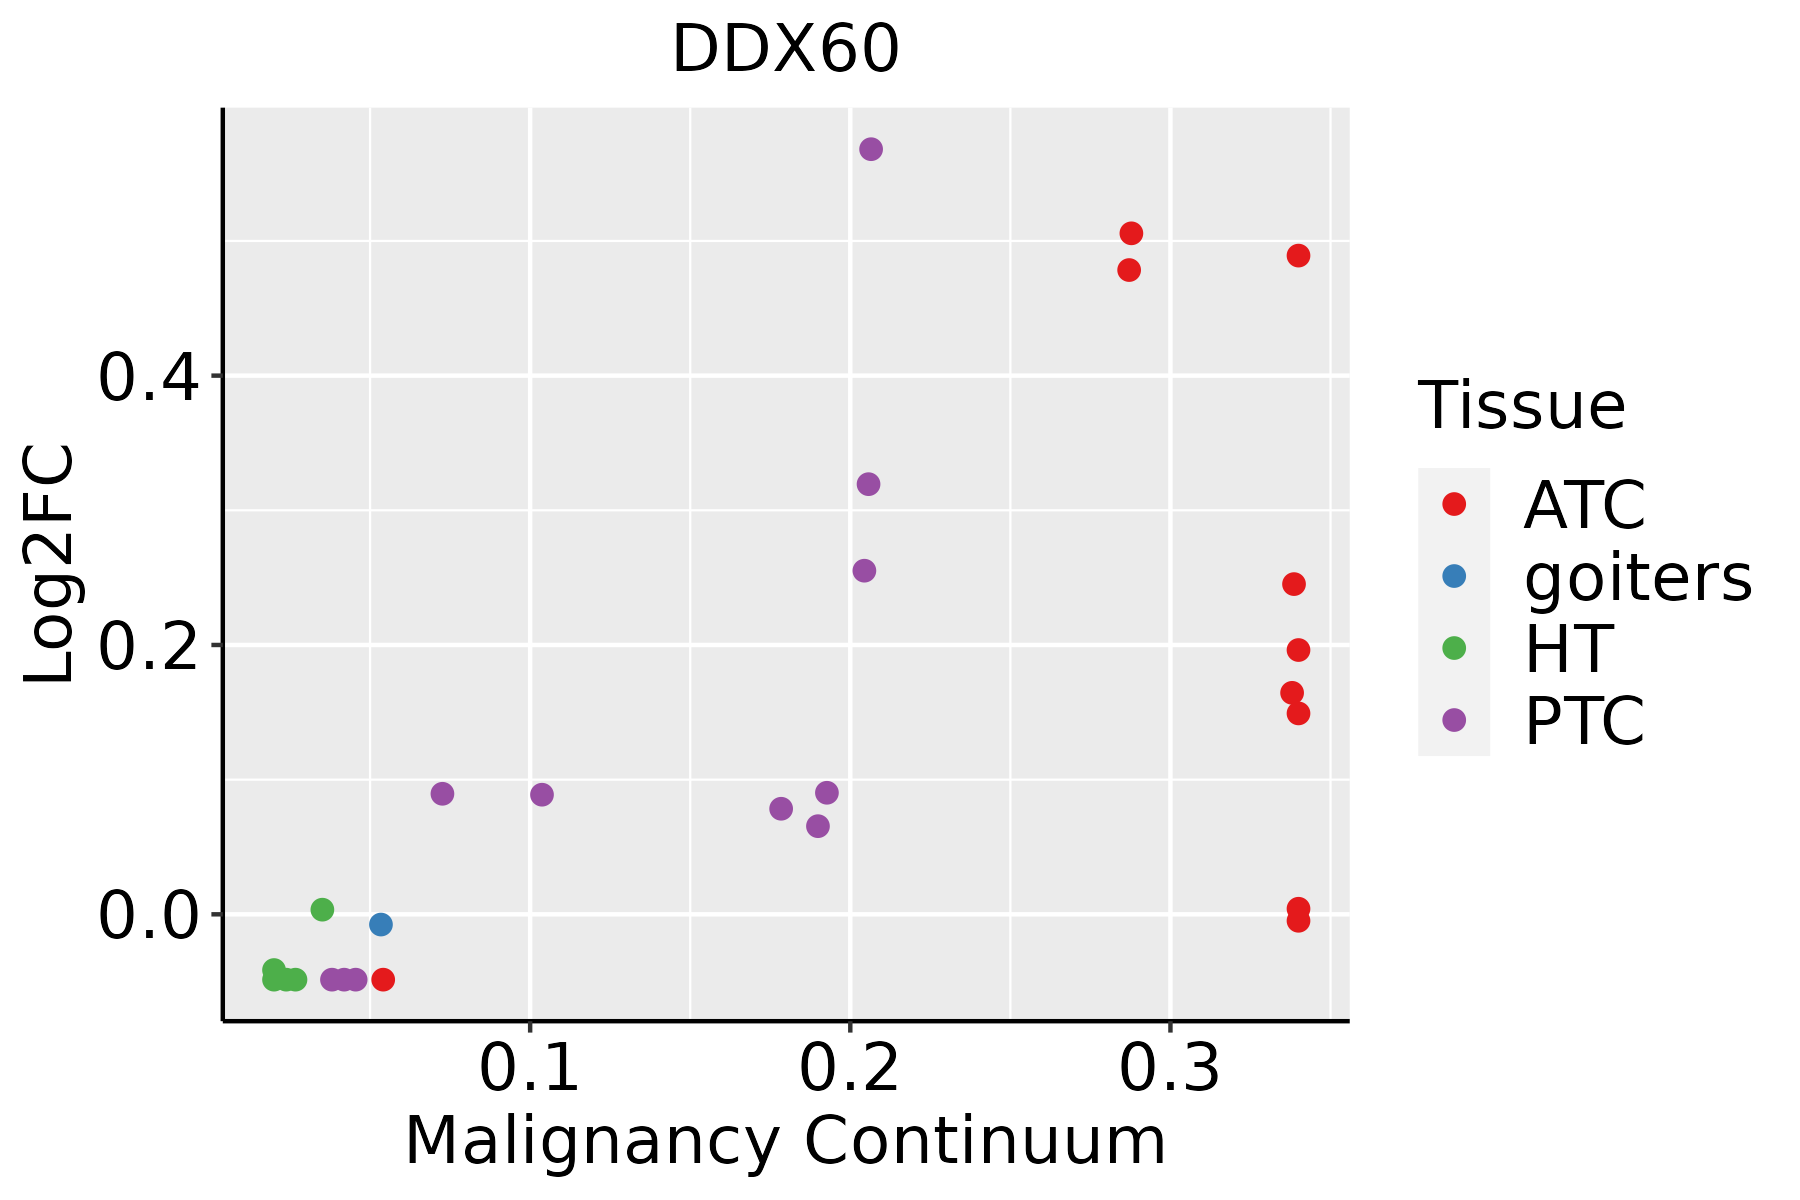
ATC: Anaplastic thyroid cancer
HT: Hashimoto's thyroiditis
PTC: Papillary thyroid cancer
∗log2FC in expression of this searched gene in stem-like cells from each diseased tissue sample relative to stem-like cells in normal samples in each tissue plotted against the malignancy continuum. Samples are colored based on if they are from different disease stage.

Top

Malignant transformation related pathway analysis

check buttonFind out the enriched GO biological processes and KEGG pathways involved in transition from healthy to precancer to cancer
check button Figure of enriched GO biological processes.
TissueDisease StageEnriched GO biological Processes
ColorectumADGO analysis - Figure of enriched GO biological processes: Top 15 enriched GO BP terms are showed in the bar plot of each disease state in each tissue. Each row represents a significant GO biological process which is colored according to the -log10(p.adjust).
ColorectumSERGO analysis - Figure of enriched GO biological processes: Top 15 enriched GO BP terms are showed in the bar plot of each disease state in each tissue. Each row represents a significant GO biological process which is colored according to the -log10(p.adjust).
ColorectumMSSGO analysis - Figure of enriched GO biological processes: Top 15 enriched GO BP terms are showed in the bar plot of each disease state in each tissue. Each row represents a significant GO biological process which is colored according to the -log10(p.adjust).
ColorectumMSI-HGO analysis - Figure of enriched GO biological processes: Top 15 enriched GO BP terms are showed in the bar plot of each disease state in each tissue. Each row represents a significant GO biological process which is colored according to the -log10(p.adjust).
ColorectumFAPGO analysis - Figure of enriched GO biological processes: Top 15 enriched GO BP terms are showed in the bar plot of each disease state in each tissue. Each row represents a significant GO biological process which is colored according to the -log10(p.adjust).
∗Top 15 enriched GO BP terms are showed in the bar plot of each disease state in each tissue. Each row represents a significant GO biological process which is colored according to the -log10(p.adjust).
Page: 1 2 3 4 5 6 7 8 9 

check button Enriched GO biological processes.
GO IDTissueDisease StageDescriptionGene RatioBg Ratiopvaluep.adjustCount
GO:0039531LiverHCCregulation of viral-induced cytoplasmic pattern recognition receptor signaling pathway20/795824/187234.92e-054.70e-0420
GO:00028312LiverHCCregulation of response to biotic stimulus173/7958327/187238.55e-057.48e-04173
GO:00395351LiverHCCregulation of RIG-I signaling pathway17/795820/187231.18e-049.87e-0417
GO:00622072LiverHCCregulation of pattern recognition receptor signaling pathway59/7958105/187233.18e-031.47e-0259
GO:0039530LiverHCCMDA-5 signaling pathway9/795811/187239.51e-033.60e-029
GO:000961515Oral cavityOSCCresponse to virus215/7305367/187231.63e-149.41e-13215
GO:00516074Oral cavityOSCCdefense response to virus154/7305265/187231.96e-105.63e-09154
GO:01405464Oral cavityOSCCdefense response to symbiont154/7305265/187231.96e-105.63e-09154
GO:003052218Oral cavityOSCCintracellular receptor signaling pathway149/7305265/187238.69e-091.81e-07149
GO:00028317Oral cavityOSCCregulation of response to biotic stimulus177/7305327/187231.73e-083.43e-07177
GO:00022214Oral cavityOSCCpattern recognition receptor signaling pathway95/7305172/187231.11e-051.15e-0495
GO:00027537Oral cavityOSCCcytoplasmic pattern recognition receptor signaling pathway40/730560/187231.32e-051.33e-0440
GO:00321037Oral cavityOSCCpositive regulation of response to external stimulus203/7305427/187231.79e-041.22e-03203
GO:00395283Oral cavityOSCCcytoplasmic pattern recognition receptor signaling pathway in response to virus24/730534/187231.89e-041.28e-0324
GO:00395301Oral cavityOSCCMDA-5 signaling pathway10/730511/187235.78e-043.30e-0310
GO:00985866Oral cavityOSCCcellular response to virus47/730584/187231.20e-036.06e-0347
GO:00622076Oral cavityOSCCregulation of pattern recognition receptor signaling pathway56/7305105/187231.99e-039.23e-0356
GO:00027646Oral cavityOSCCimmune response-regulating signaling pathway212/7305468/187232.93e-031.27e-02212
GO:00395294Oral cavityOSCCRIG-I signaling pathway18/730527/187233.34e-031.42e-0218
GO:00622087Oral cavityOSCCpositive regulation of pattern recognition receptor signaling pathway26/730544/187235.49e-032.13e-0226
Page: 1 2 3 4 5 

check button Enriched KEGG pathways.
Pathway IDTissueDisease StageDescriptionGene RatioBg Ratiopvaluep.adjustqvalueCount
Page: 1 

Top

Cell-cell communication analysis

check buttonIdentification of potential cell-cell interactions between two cell types and their ligand-receptor pairs for different disease states
LigandReceptorLRpairPathwayTissueDisease Stage
Page: 1 

Top

Single-cell gene regulatory network inference analysis

check buttonFind out the significant the regulons (TFs) and the target genes of each regulon across cell types for different disease states
TFCell TypeTissueDisease StageTarget GeneRSSRegulon Activity
∗The dot plots of a searched regulon are shown for all cell subpopulations in each disease state of each tissue based on the regulon specific score inferred using pySCENIC and by calculating the average expression.
Page: 1 

Top

Somatic mutation of malignant transformation related genes

check buttonAnnotation of somatic variants for genes involved in malignant transformation
Hugo SymbolVariant ClassVariant ClassificationdbSNP RSHGVScHGVSpHGVSp ShortSWISSPROTBIOTYPESIFTPolyPhenTumor Sample BarcodeTissueHistologySexAgeStageTherapy TypesDrugsOutcome
DDX60SNVMissense_Mutationnovelc.1426G>Tp.Asp476Tyrp.D476YQ8IY21protein_codingdeleterious(0.01)probably_damaging(0.962)TCGA-AN-A046-01Breastbreast invasive carcinomaFemale>=65I/IIUnknownUnknownSD
DDX60SNVMissense_Mutationnovelc.4583N>Tp.Tyr1528Phep.Y1528FQ8IY21protein_codingdeleterious(0.01)possibly_damaging(0.886)TCGA-AR-A0TU-01Breastbreast invasive carcinomaFemale<65I/IIUnspecificDoxorubicinSD
DDX60SNVMissense_Mutationnovelc.2341N>Ap.Ala781Thrp.A781TQ8IY21protein_codingdeleterious(0)probably_damaging(0.981)TCGA-BH-A0HF-01Breastbreast invasive carcinomaFemale>=65I/IIHormone TherapyarimidexSD
DDX60SNVMissense_Mutationc.2306N>Ap.Arg769Glnp.R769QQ8IY21protein_codingdeleterious(0.04)possibly_damaging(0.463)TCGA-D8-A1J8-01Breastbreast invasive carcinomaFemale>=65I/IIHormone TherapynolvadexSD
DDX60SNVMissense_Mutationc.1613N>Cp.Phe538Serp.F538SQ8IY21protein_codingdeleterious(0)possibly_damaging(0.839)TCGA-D8-A1J8-01Breastbreast invasive carcinomaFemale>=65I/IIHormone TherapynolvadexSD
DDX60SNVMissense_Mutationc.1528N>Cp.Asp510Hisp.D510HQ8IY21protein_codingdeleterious(0)probably_damaging(0.973)TCGA-D8-A1J8-01Breastbreast invasive carcinomaFemale>=65I/IIHormone TherapynolvadexSD
DDX60SNVMissense_Mutationc.3790C>Tp.His1264Tyrp.H1264YQ8IY21protein_codingdeleterious(0)probably_damaging(1)TCGA-D8-A27G-01Breastbreast invasive carcinomaFemale>=65I/IIUnknownUnknownSD
DDX60SNVMissense_Mutationc.1780N>Ap.Glu594Lysp.E594KQ8IY21protein_codingtolerated(0.12)benign(0.043)TCGA-D8-A73U-01Breastbreast invasive carcinomaFemale>=65I/IIHormone TherapytamoxiphenSD
DDX60SNVMissense_Mutationc.3231N>Cp.Lys1077Asnp.K1077NQ8IY21protein_codingdeleterious(0)probably_damaging(1)TCGA-E2-A10C-01Breastbreast invasive carcinomaFemale<65I/IIChemotherapycytoxanSD
DDX60SNVMissense_Mutationnovelc.362N>Gp.Thr121Argp.T121RQ8IY21protein_codingdeleterious(0)probably_damaging(0.979)TCGA-E2-A574-01Breastbreast invasive carcinomaFemale<65I/IIChemotherapyadriamycinSD
Page: 1 2 3 4 5 6 7 8 9 10 11 12 13 14 15 16 17 18 

Top

Related drugs of malignant transformation related genes

check buttonIdentification of chemicals and drugs interact with genes involved in malignant transfromation
(DGIdb 4.0)
Entrez IDSymbolCategoryInteraction TypesDrug Claim NameDrug NamePMIDs
Page: 1