Schematic overview of the cellular and molecular mechanisms involved in the cancer progression, including the proposed cellular and molecular mechanisms in cancer cells trajectory. AT1: alveolar type 1 cells; AT2: alveolar type 2 cells; AAH: atypical adenomatous hyperplasia; AIS: adenocarcinoma in situ; MIA: minimally invasive adenocarcinoma; IA: invasive adenocarcinoma; EMT: epithelial-mesenchymal transition

Home

Download

Statistics

Help

Contact

Center for Computational Systems Medicine
leaf

Gene summary

leaf

Malignant transformation analysis

leaf

Malignant transformation related pathway analysis

leaf

Cell-cell communication analysis

leaf

Single-cell gene regulatory network inference analysis

leaf

Somatic mutation of malignant transformation related genes

leaf

Related drugs of malignant transformation related genes

Gene: DBNDD2

Gene summary for DBNDD2

check button Gene summary.

Gene informationSpeciesHuman
Gene symbol

DBNDD2

Gene ID

55861

Gene namedysbindin domain containing 2
Gene AliasC20orf35
Cytomap20q13.12
Gene Typeprotein-coding
GO ID

GO:0001932

UniProtAcc

Q9BQY9


Top

Malignant transformation analysis

check button Identification of the aberrant gene expression in precancerous and cancerous lesions by comparing the gene expression of stem-like cells in diseased tissues with normal stem cells
check button Malignant transformation involving gene list.
Entrez IDSymbolReplicatesSpeciesOrganTissueAdj P-valueLog2FCMalignancy
55861DBNDD2HTA11_3410_2000001011HumanColorectumAD4.23e-122.46e-010.0155
55861DBNDD2HTA11_2487_2000001011HumanColorectumSER5.63e-224.69e-01-0.1808
55861DBNDD2HTA11_2951_2000001011HumanColorectumAD3.40e-022.80e-010.0216
55861DBNDD2HTA11_1938_2000001011HumanColorectumAD8.58e-133.71e-01-0.0811
55861DBNDD2HTA11_78_2000001011HumanColorectumAD8.35e-113.25e-01-0.1088
55861DBNDD2HTA11_347_2000001011HumanColorectumAD8.14e-265.12e-01-0.1954
55861DBNDD2HTA11_411_2000001011HumanColorectumSER7.44e-097.74e-01-0.2602
55861DBNDD2HTA11_2112_2000001011HumanColorectumSER6.90e-095.33e-01-0.2196
55861DBNDD2HTA11_3361_2000001011HumanColorectumAD1.41e-083.30e-01-0.1207
55861DBNDD2HTA11_83_2000001011HumanColorectumSER1.12e-083.95e-01-0.1526
55861DBNDD2HTA11_696_2000001011HumanColorectumAD6.91e-234.41e-01-0.1464
55861DBNDD2HTA11_866_2000001011HumanColorectumAD3.19e-143.37e-01-0.1001
55861DBNDD2HTA11_1391_2000001011HumanColorectumAD1.35e-164.26e-01-0.059
55861DBNDD2HTA11_2992_2000001011HumanColorectumSER2.52e-104.85e-01-0.1706
55861DBNDD2HTA11_5212_2000001011HumanColorectumAD2.57e-156.19e-01-0.2061
55861DBNDD2HTA11_5216_2000001011HumanColorectumSER3.03e-064.90e-01-0.1462
55861DBNDD2HTA11_546_2000001011HumanColorectumAD1.56e-062.45e-01-0.0842
55861DBNDD2HTA11_7862_2000001011HumanColorectumAD1.01e-114.52e-01-0.0179
55861DBNDD2HTA11_866_3004761011HumanColorectumAD6.44e-224.72e-010.096
55861DBNDD2HTA11_4255_2000001011HumanColorectumSER3.03e-064.15e-010.0446
Page: 1 2 3 4 5 6 

check button Transcriptomic changes along malignancy continuum.
TissueExpression DynamicsAbbreviation
Colorectum (GSE201348)The image shows the transcriptomic changes along malignancy continuum.log2FC in expression of this searched gene in stem-like cells from each diseased tissue sample relative to stem-like cells in normal samples in each tissue plotted against the malignancy continuum. Samples are colored based on if they are from different disease stage.FAP: Familial adenomatous polyposis
CRC: Colorectal cancer
Colorectum (HTA11)The image shows the transcriptomic changes along malignancy continuum.log2FC in expression of this searched gene in stem-like cells from each diseased tissue sample relative to stem-like cells in normal samples in each tissue plotted against the malignancy continuum. Samples are colored based on if they are from different disease stage.AD: Adenomas
SER: Sessile serrated lesions
MSI-H: Microsatellite-high colorectal cancer
MSS: Microsatellite stable colorectal cancer
EsophagusThe image shows the transcriptomic changes along malignancy continuum.log2FC in expression of this searched gene in stem-like cells from each diseased tissue sample relative to stem-like cells in normal samples in each tissue plotted against the malignancy continuum. Samples are colored based on if they are from different disease stage.
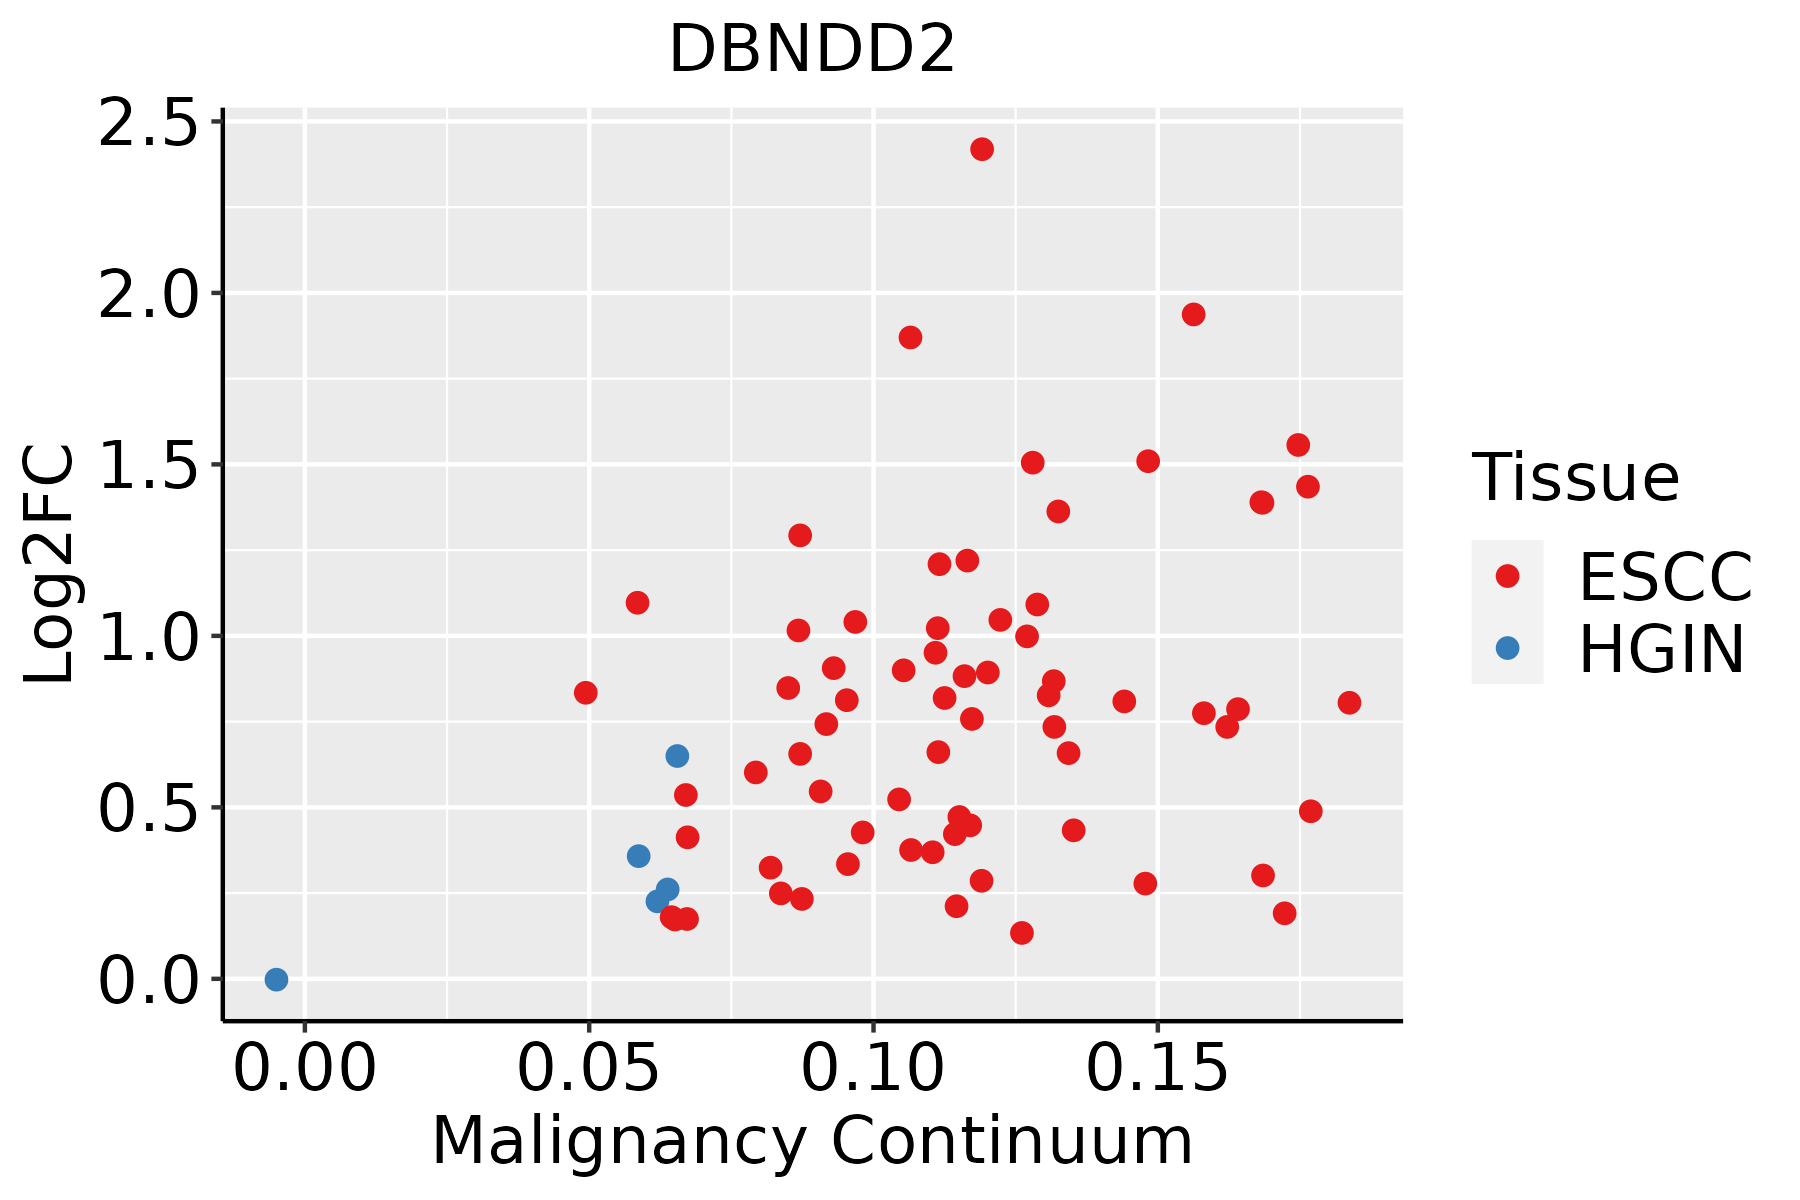
ESCC: Esophageal squamous cell carcinoma
HGIN: High-grade intraepithelial neoplasias
LGIN: Low-grade intraepithelial neoplasias
LiverThe image shows the transcriptomic changes along malignancy continuum.log2FC in expression of this searched gene in stem-like cells from each diseased tissue sample relative to stem-like cells in normal samples in each tissue plotted against the malignancy continuum. Samples are colored based on if they are from different disease stage.
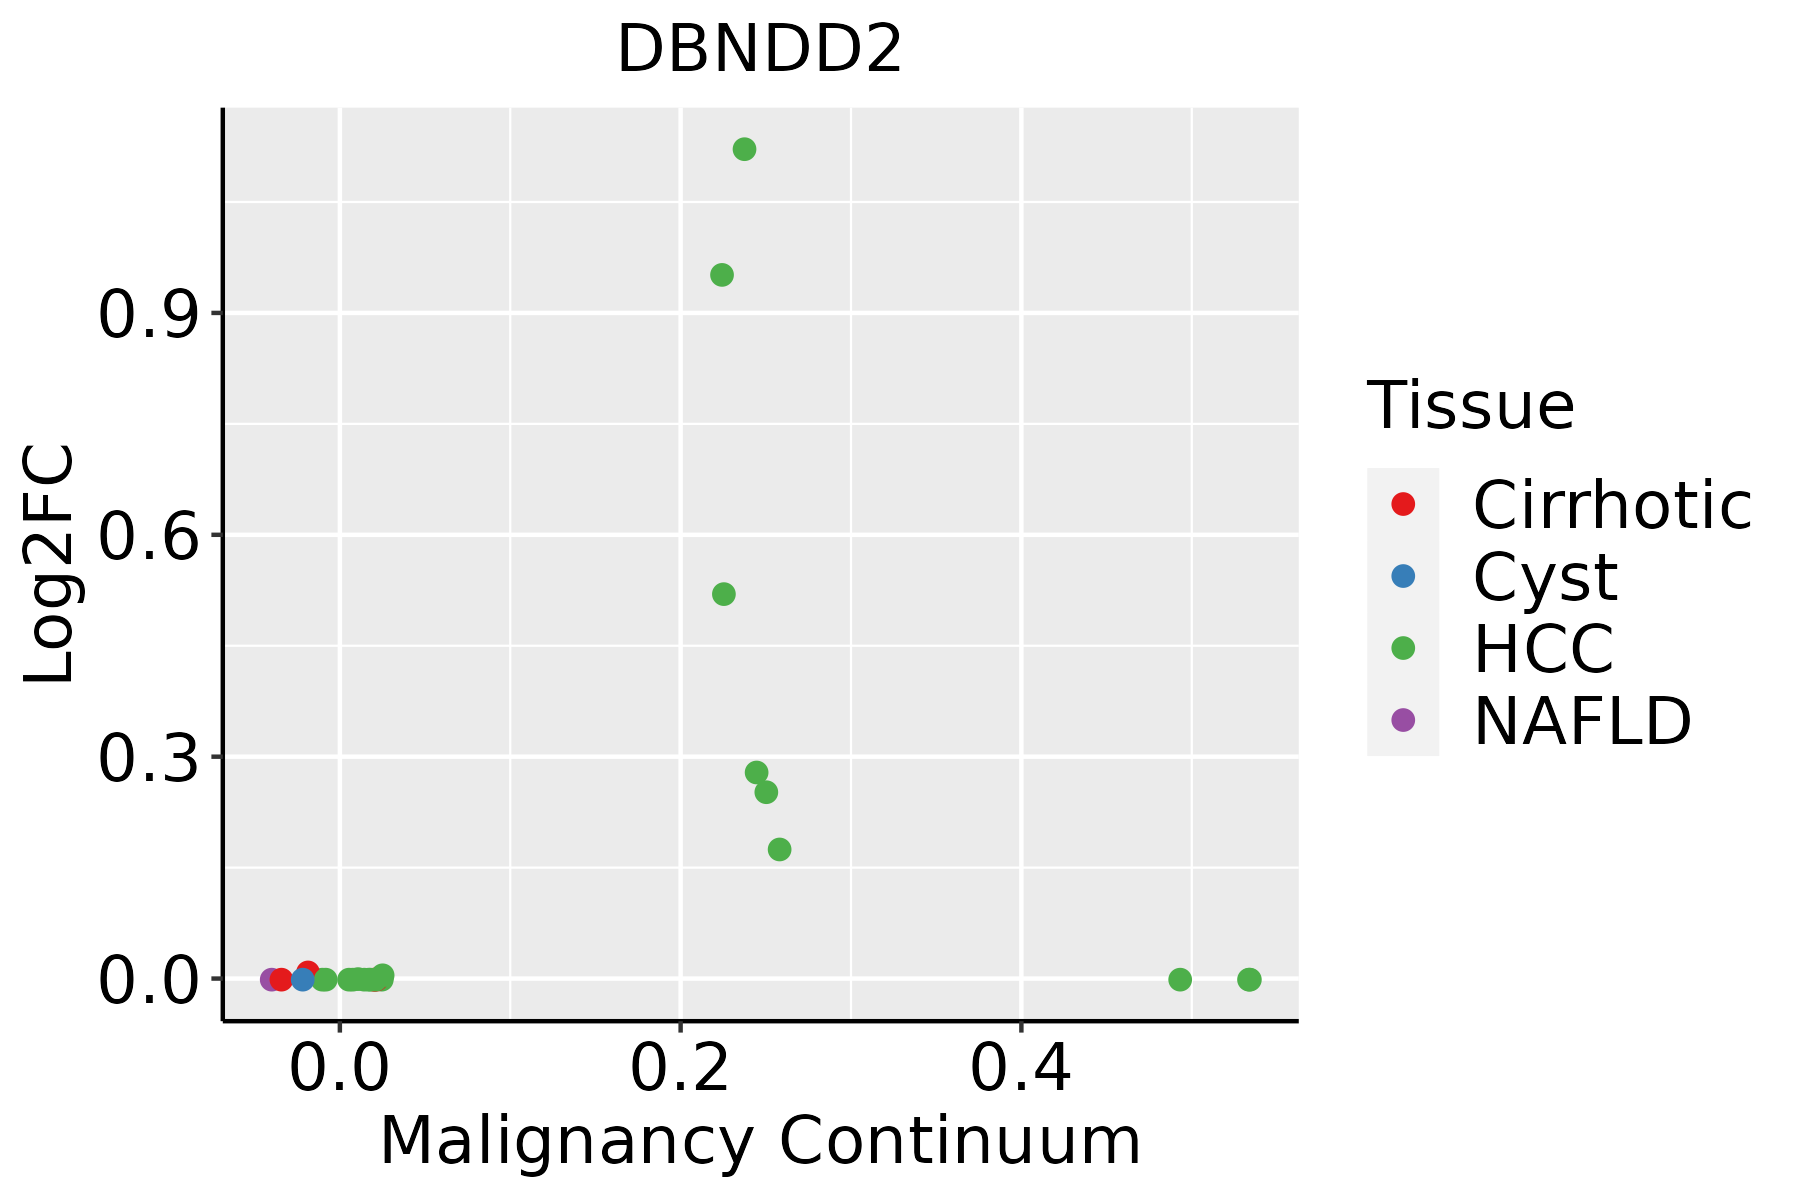
HCC: Hepatocellular carcinoma
NAFLD: Non-alcoholic fatty liver disease
∗log2FC in expression of this searched gene in stem-like cells from each diseased tissue sample relative to stem-like cells in normal samples in each tissue plotted against the malignancy continuum. Samples are colored based on if they are from different disease stage.

Top

Malignant transformation related pathway analysis

check buttonFind out the enriched GO biological processes and KEGG pathways involved in transition from healthy to precancer to cancer
check button Figure of enriched GO biological processes.
TissueDisease StageEnriched GO biological Processes
ColorectumADGO analysis - Figure of enriched GO biological processes: Top 15 enriched GO BP terms are showed in the bar plot of each disease state in each tissue. Each row represents a significant GO biological process which is colored according to the -log10(p.adjust).
ColorectumSERGO analysis - Figure of enriched GO biological processes: Top 15 enriched GO BP terms are showed in the bar plot of each disease state in each tissue. Each row represents a significant GO biological process which is colored according to the -log10(p.adjust).
ColorectumMSSGO analysis - Figure of enriched GO biological processes: Top 15 enriched GO BP terms are showed in the bar plot of each disease state in each tissue. Each row represents a significant GO biological process which is colored according to the -log10(p.adjust).
ColorectumMSI-HGO analysis - Figure of enriched GO biological processes: Top 15 enriched GO BP terms are showed in the bar plot of each disease state in each tissue. Each row represents a significant GO biological process which is colored according to the -log10(p.adjust).
ColorectumFAPGO analysis - Figure of enriched GO biological processes: Top 15 enriched GO BP terms are showed in the bar plot of each disease state in each tissue. Each row represents a significant GO biological process which is colored according to the -log10(p.adjust).
∗Top 15 enriched GO BP terms are showed in the bar plot of each disease state in each tissue. Each row represents a significant GO biological process which is colored according to the -log10(p.adjust).
Page: 1 2 3 4 5 6 7 8 9 

check button Enriched GO biological processes.
GO IDTissueDisease StageDescriptionGene RatioBg Ratiopvaluep.adjustCount
GO:00064692ColorectumMSSnegative regulation of protein kinase activity60/3467212/187233.08e-044.02e-0360
GO:00513483ColorectumMSI-Hnegative regulation of transferase activity38/1319268/187232.89e-051.17e-0338
GO:00459363ColorectumMSI-Hnegative regulation of phosphate metabolic process53/1319441/187239.54e-053.01e-0353
GO:00105633ColorectumMSI-Hnegative regulation of phosphorus metabolic process53/1319442/187231.01e-043.16e-0353
GO:00423263ColorectumMSI-Hnegative regulation of phosphorylation45/1319385/187235.71e-041.14e-0245
GO:00019333ColorectumMSI-Hnegative regulation of protein phosphorylation40/1319342/187231.11e-031.86e-0240
GO:004593626EsophagusHGINnegative regulation of phosphate metabolic process89/2587441/187231.24e-042.54e-0389
GO:001056326EsophagusHGINnegative regulation of phosphorus metabolic process89/2587442/187231.34e-042.71e-0389
GO:004232620EsophagusHGINnegative regulation of phosphorylation78/2587385/187232.77e-044.77e-0378
GO:000193320EsophagusHGINnegative regulation of protein phosphorylation69/2587342/187236.81e-049.26e-0369
GO:005134827EsophagusHGINnegative regulation of transferase activity55/2587268/187231.51e-031.74e-0255
GO:0010563111EsophagusESCCnegative regulation of phosphorus metabolic process274/8552442/187232.32e-129.41e-11274
GO:0045936111EsophagusESCCnegative regulation of phosphate metabolic process273/8552441/187233.18e-121.25e-10273
GO:0051348111EsophagusESCCnegative regulation of transferase activity177/8552268/187231.08e-114.00e-10177
GO:0042326111EsophagusESCCnegative regulation of phosphorylation237/8552385/187231.86e-105.33e-09237
GO:0001933111EsophagusESCCnegative regulation of protein phosphorylation213/8552342/187233.54e-109.76e-09213
GO:003367319EsophagusESCCnegative regulation of kinase activity154/8552237/187231.38e-093.27e-08154
GO:000646920EsophagusESCCnegative regulation of protein kinase activity140/8552212/187231.53e-093.56e-08140
GO:001056322LiverHCCnegative regulation of phosphorus metabolic process259/7958442/187234.29e-121.92e-10259
GO:004593622LiverHCCnegative regulation of phosphate metabolic process258/7958441/187236.00e-122.60e-10258
Page: 1 2 3 

check button Enriched KEGG pathways.
Pathway IDTissueDisease StageDescriptionGene RatioBg Ratiopvaluep.adjustqvalueCount
Page: 1 

Top

Cell-cell communication analysis

check buttonIdentification of potential cell-cell interactions between two cell types and their ligand-receptor pairs for different disease states
LigandReceptorLRpairPathwayTissueDisease Stage
Page: 1 

Top

Single-cell gene regulatory network inference analysis

check buttonFind out the significant the regulons (TFs) and the target genes of each regulon across cell types for different disease states
TFCell TypeTissueDisease StageTarget GeneRSSRegulon Activity
∗The dot plots of a searched regulon are shown for all cell subpopulations in each disease state of each tissue based on the regulon specific score inferred using pySCENIC and by calculating the average expression.
Page: 1 

Top

Somatic mutation of malignant transformation related genes

check buttonAnnotation of somatic variants for genes involved in malignant transformation
Hugo SymbolVariant ClassVariant ClassificationdbSNP RSHGVScHGVSpHGVSp ShortSWISSPROTBIOTYPESIFTPolyPhenTumor Sample BarcodeTissueHistologySexAgeStageTherapy TypesDrugsOutcome
DBNDD2SNVMissense_Mutationnovelc.209N>Tp.Cys70Phep.C70FQ9BQY9protein_codingdeleterious_low_confidence(0)benign(0.014)TCGA-E2-A2P5-01Breastbreast invasive carcinomaFemale>=65III/IVHormone TherapyarimidexPD
DBNDD2deletionFrame_Shift_Delc.471delNp.Glu158LysfsTer2p.E158Kfs*2Q9BQY9protein_codingTCGA-EW-A1IW-01Breastbreast invasive carcinomaFemale>=65I/IIHormone TherapyaromasinSD
DBNDD2SNVMissense_Mutationc.260G>Ap.Arg87Glnp.R87QQ9BQY9protein_codingtolerated_low_confidence(0.87)benign(0)TCGA-AA-A010-01Colorectumcolon adenocarcinomaFemale<65I/IIChemotherapyfolinicCR
DBNDD2SNVMissense_Mutationrs772958543c.445N>Tp.Pro149Serp.P149SQ9BQY9protein_codingdeleterious(0.03)probably_damaging(0.999)TCGA-D5-6530-01Colorectumcolon adenocarcinomaMale<65I/IIUnknownUnknownSD
DBNDD2SNVMissense_Mutationc.478N>Cp.Asn160Hisp.N160HQ9BQY9protein_codingdeleterious(0)probably_damaging(1)TCGA-F4-6703-01Colorectumcolon adenocarcinomaMale<65I/IIUnknownUnknownSD
DBNDD2SNVMissense_Mutationrs767159514c.226N>Ap.Ala76Thrp.A76TQ9BQY9protein_codingtolerated_low_confidence(0.06)benign(0)TCGA-WS-AB45-01Colorectumcolon adenocarcinomaFemale<65I/IIUnknownUnknownSD
DBNDD2SNVMissense_Mutationnovelc.328G>Ap.Ala110Thrp.A110TQ9BQY9protein_codingtolerated_low_confidence(0.13)benign(0)TCGA-A5-A0G9-01Endometriumuterine corpus endometrioid carcinomaFemale>=65I/IIUnknownUnknownSD
DBNDD2SNVMissense_Mutationnovelc.515N>Gp.Leu172Argp.L172RQ9BQY9protein_codingdeleterious(0)probably_damaging(0.952)TCGA-A5-A1OF-01Endometriumuterine corpus endometrioid carcinomaFemale<65I/IIUnknownUnknownSD
DBNDD2SNVMissense_Mutationnovelc.443N>Tp.Arg148Ilep.R148IQ9BQY9protein_codingdeleterious(0)probably_damaging(0.994)TCGA-AJ-A3EL-01Endometriumuterine corpus endometrioid carcinomaFemale<65I/IIUnknownUnknownSD
DBNDD2SNVMissense_Mutationnovelc.326N>Tp.Ala109Valp.A109VQ9BQY9protein_codingdeleterious_low_confidence(0)benign(0.091)TCGA-AP-A1DK-01Endometriumuterine corpus endometrioid carcinomaFemale<65I/IIUnknownUnknownSD
Page: 1 2 3 4 

Top

Related drugs of malignant transformation related genes

check buttonIdentification of chemicals and drugs interact with genes involved in malignant transfromation
(DGIdb 4.0)
Entrez IDSymbolCategoryInteraction TypesDrug Claim NameDrug NamePMIDs
Page: 1