
|
|||||
|
 | |
| |
| |
| |
| |
| |
|
Gene: DALRD3 |
Gene summary for DALRD3 |
| Gene information | Species | Human | Gene symbol | DALRD3 | Gene ID | 55152 |
| Gene name | DALR anticodon binding domain containing 3 | |
| Gene Alias | DEE86 | |
| Cytomap | 3p21.31 | |
| Gene Type | protein-coding | GO ID | GO:0001510 | UniProtAcc | Q5D0E6 |
Top |
Malignant transformation analysis |
| Identification of the aberrant gene expression in precancerous and cancerous lesions by comparing the gene expression of stem-like cells in diseased tissues with normal stem cells |
| Entrez ID | Symbol | Replicates | Species | Organ | Tissue | Adj P-value | Log2FC | Malignancy |
| 55152 | DALRD3 | LZE4T | Human | Esophagus | ESCC | 2.61e-07 | 1.25e-01 | 0.0811 |
| 55152 | DALRD3 | LZE7T | Human | Esophagus | ESCC | 1.15e-05 | 2.25e-01 | 0.0667 |
| 55152 | DALRD3 | LZE8T | Human | Esophagus | ESCC | 1.84e-03 | 6.83e-03 | 0.067 |
| 55152 | DALRD3 | LZE22T | Human | Esophagus | ESCC | 1.05e-04 | 2.63e-01 | 0.068 |
| 55152 | DALRD3 | LZE24T | Human | Esophagus | ESCC | 1.15e-03 | 1.97e-01 | 0.0596 |
| 55152 | DALRD3 | LZE21T | Human | Esophagus | ESCC | 1.70e-02 | 3.23e-01 | 0.0655 |
| 55152 | DALRD3 | P2T-E | Human | Esophagus | ESCC | 2.79e-13 | 1.77e-01 | 0.1177 |
| 55152 | DALRD3 | P4T-E | Human | Esophagus | ESCC | 3.63e-19 | 4.13e-01 | 0.1323 |
| 55152 | DALRD3 | P5T-E | Human | Esophagus | ESCC | 8.46e-21 | 1.41e-01 | 0.1327 |
| 55152 | DALRD3 | P8T-E | Human | Esophagus | ESCC | 4.67e-20 | 2.52e-01 | 0.0889 |
| 55152 | DALRD3 | P9T-E | Human | Esophagus | ESCC | 4.68e-15 | 2.00e-01 | 0.1131 |
| 55152 | DALRD3 | P10T-E | Human | Esophagus | ESCC | 3.73e-10 | 1.36e-01 | 0.116 |
| 55152 | DALRD3 | P11T-E | Human | Esophagus | ESCC | 3.17e-20 | 4.82e-01 | 0.1426 |
| 55152 | DALRD3 | P12T-E | Human | Esophagus | ESCC | 2.41e-18 | 3.26e-01 | 0.1122 |
| 55152 | DALRD3 | P15T-E | Human | Esophagus | ESCC | 5.83e-18 | 3.18e-01 | 0.1149 |
| 55152 | DALRD3 | P16T-E | Human | Esophagus | ESCC | 1.15e-23 | 4.54e-01 | 0.1153 |
| 55152 | DALRD3 | P20T-E | Human | Esophagus | ESCC | 1.10e-10 | 2.91e-01 | 0.1124 |
| 55152 | DALRD3 | P21T-E | Human | Esophagus | ESCC | 1.48e-26 | 5.36e-01 | 0.1617 |
| 55152 | DALRD3 | P22T-E | Human | Esophagus | ESCC | 4.47e-23 | 3.32e-01 | 0.1236 |
| 55152 | DALRD3 | P23T-E | Human | Esophagus | ESCC | 7.90e-15 | 2.30e-01 | 0.108 |
| Page: 1 2 3 4 5 6 |
| Tissue | Expression Dynamics | Abbreviation |
| Esophagus |  | ESCC: Esophageal squamous cell carcinoma |
| HGIN: High-grade intraepithelial neoplasias | ||
| LGIN: Low-grade intraepithelial neoplasias | ||
| Liver |  | HCC: Hepatocellular carcinoma |
| NAFLD: Non-alcoholic fatty liver disease | ||
| Oral Cavity | 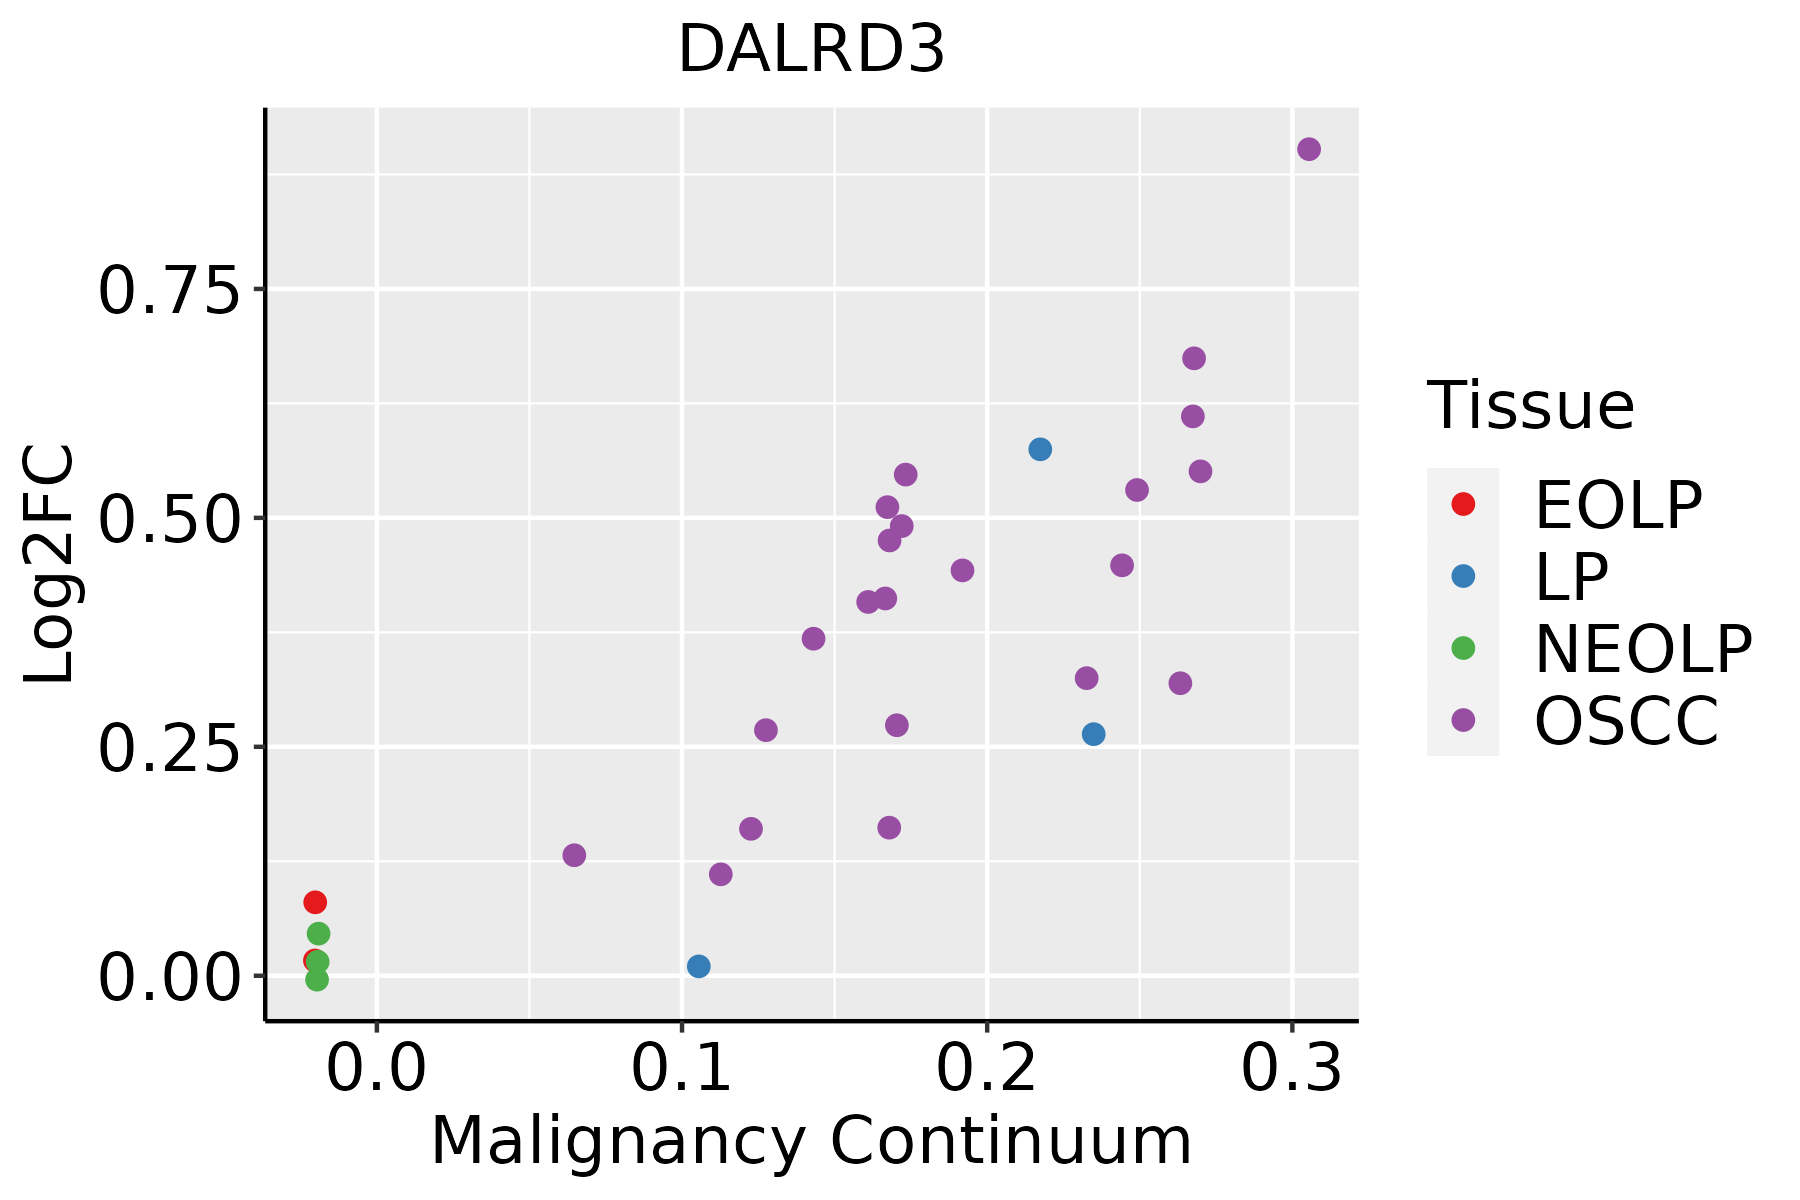 | EOLP: Erosive Oral lichen planus |
| LP: leukoplakia | ||
| NEOLP: Non-erosive oral lichen planus | ||
| OSCC: Oral squamous cell carcinoma | ||
| Skin |  | AK: Actinic keratosis |
| cSCC: Cutaneous squamous cell carcinoma | ||
| SCCIS:squamous cell carcinoma in situ | ||
| Thyroid | 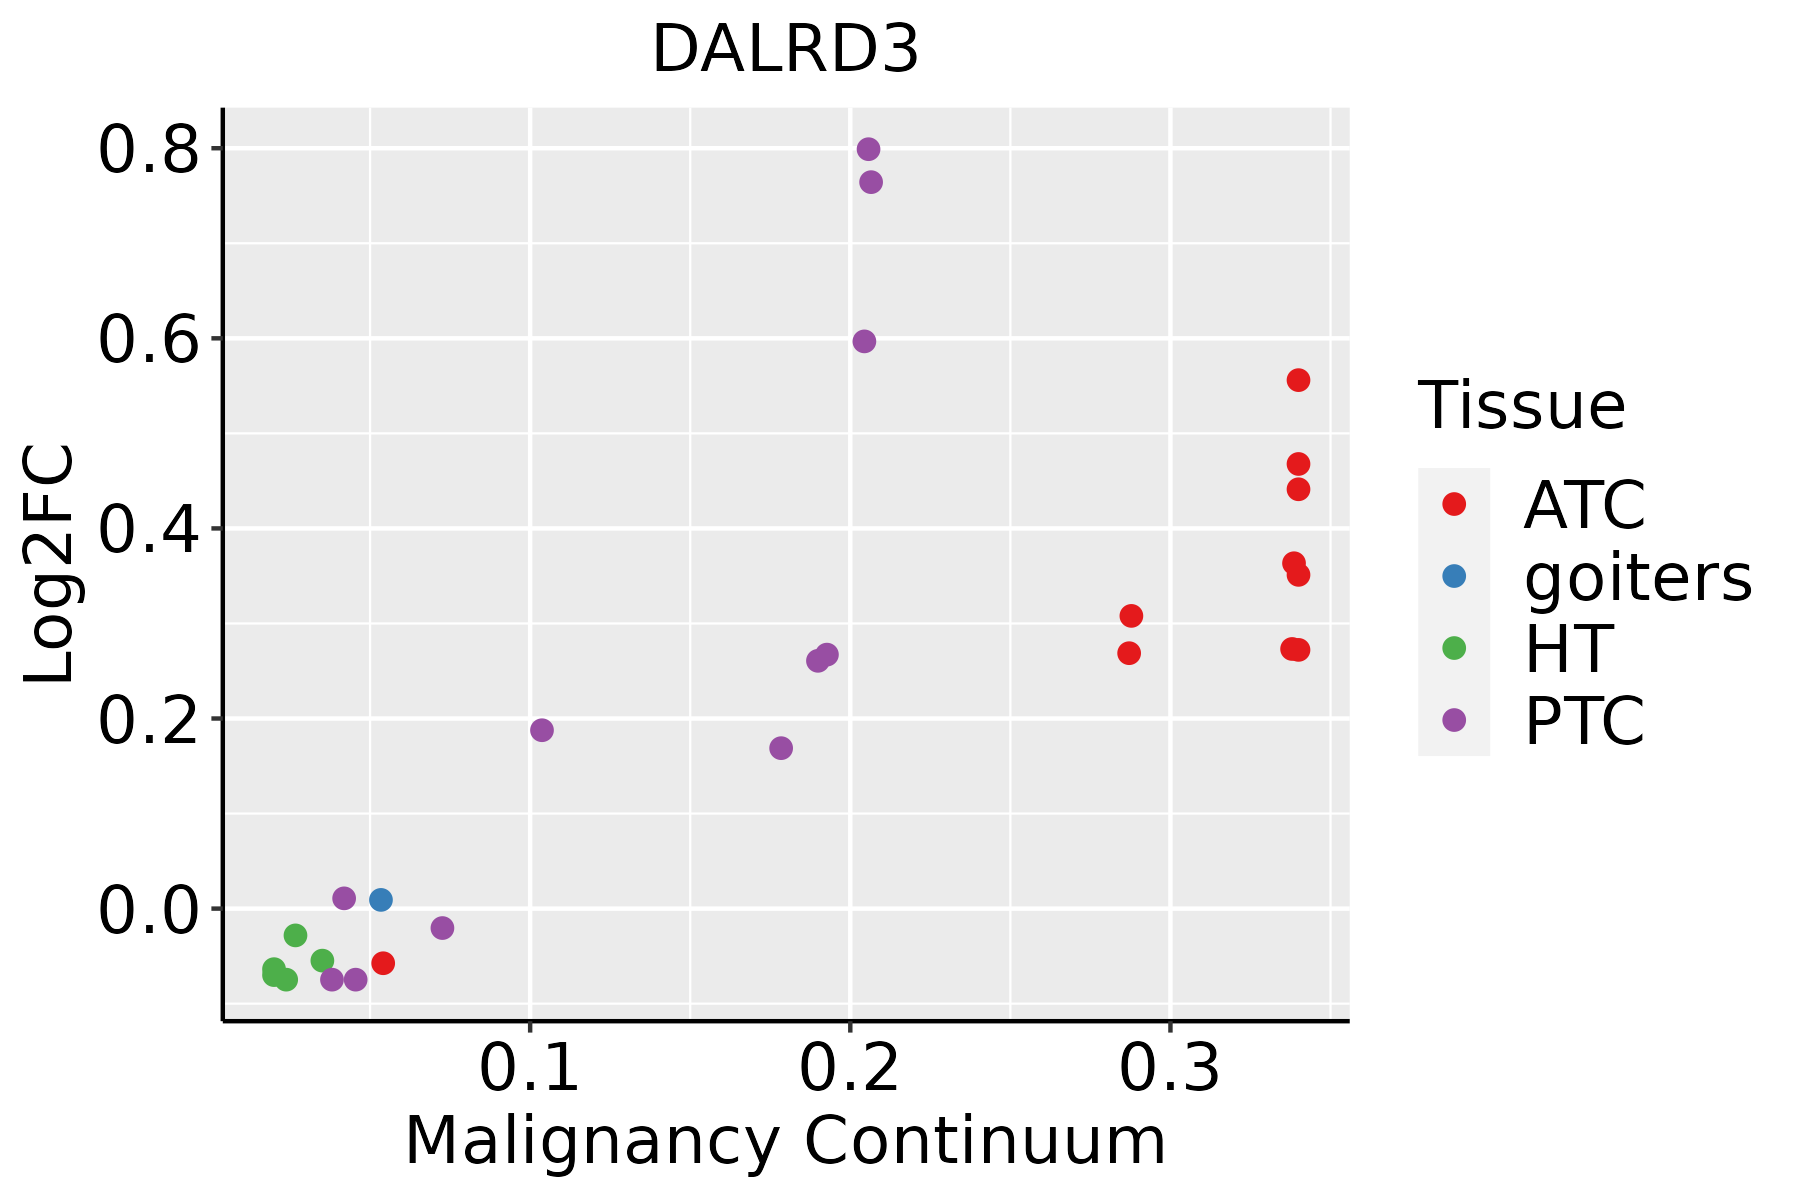 | ATC: Anaplastic thyroid cancer |
| HT: Hashimoto's thyroiditis | ||
| PTC: Papillary thyroid cancer |
| ∗log2FC in expression of this searched gene in stem-like cells from each diseased tissue sample relative to stem-like cells in normal samples in each tissue plotted against the malignancy continuum. Samples are colored based on if they are from different disease stage. |
Top |
Malignant transformation related pathway analysis |
| Find out the enriched GO biological processes and KEGG pathways involved in transition from healthy to precancer to cancer |
| Tissue | Disease Stage | Enriched GO biological Processes |
| Colorectum | AD |  |
| Colorectum | SER |  |
| Colorectum | MSS |  |
| Colorectum | MSI-H |  |
| Colorectum | FAP |  |
| ∗Top 15 enriched GO BP terms are showed in the bar plot of each disease state in each tissue. Each row represents a significant GO biological process which is colored according to the -log10(p.adjust). |
| Page: 1 2 3 4 5 6 7 8 9 |
| GO ID | Tissue | Disease Stage | Description | Gene Ratio | Bg Ratio | pvalue | p.adjust | Count |
| GO:0009451 | Liver | HCC | RNA modification | 101/7958 | 167/18723 | 2.02e-06 | 2.78e-05 | 101 |
| GO:0006400 | Liver | HCC | tRNA modification | 60/7958 | 90/18723 | 3.09e-06 | 4.09e-05 | 60 |
| GO:0001510 | Liver | HCC | RNA methylation | 53/7958 | 83/18723 | 6.96e-05 | 6.29e-04 | 53 |
| GO:0030488 | Liver | HCC | tRNA methylation | 29/7958 | 41/18723 | 2.38e-04 | 1.79e-03 | 29 |
| GO:00344709 | Oral cavity | OSCC | ncRNA processing | 263/7305 | 395/18723 | 4.38e-29 | 2.78e-26 | 263 |
| GO:00346605 | Oral cavity | OSCC | ncRNA metabolic process | 296/7305 | 485/18723 | 2.94e-23 | 6.65e-21 | 296 |
| GO:00080332 | Oral cavity | OSCC | tRNA processing | 78/7305 | 127/18723 | 2.56e-07 | 4.00e-06 | 78 |
| GO:00063991 | Oral cavity | OSCC | tRNA metabolic process | 101/7305 | 179/18723 | 1.65e-06 | 2.15e-05 | 101 |
| GO:00094511 | Oral cavity | OSCC | RNA modification | 95/7305 | 167/18723 | 2.05e-06 | 2.62e-05 | 95 |
| GO:00064001 | Oral cavity | OSCC | tRNA modification | 53/7305 | 90/18723 | 1.04e-04 | 7.70e-04 | 53 |
| GO:00434142 | Oral cavity | OSCC | macromolecule methylation | 149/7305 | 316/18723 | 1.82e-03 | 8.60e-03 | 149 |
| GO:00322591 | Oral cavity | OSCC | methylation | 168/7305 | 364/18723 | 3.03e-03 | 1.31e-02 | 168 |
| GO:003447014 | Oral cavity | LP | ncRNA processing | 184/4623 | 395/18723 | 1.20e-21 | 3.12e-19 | 184 |
| GO:003466011 | Oral cavity | LP | ncRNA metabolic process | 205/4623 | 485/18723 | 6.46e-18 | 1.09e-15 | 205 |
| GO:00080331 | Oral cavity | LP | tRNA processing | 44/4623 | 127/18723 | 7.50e-03 | 4.15e-02 | 44 |
| GO:003447017 | Skin | cSCC | ncRNA processing | 215/4864 | 395/18723 | 6.83e-34 | 4.28e-31 | 215 |
| GO:003466013 | Skin | cSCC | ncRNA metabolic process | 234/4864 | 485/18723 | 1.37e-26 | 4.77e-24 | 234 |
| GO:004341411 | Skin | cSCC | macromolecule methylation | 107/4864 | 316/18723 | 1.03e-03 | 6.94e-03 | 107 |
| GO:00080334 | Skin | cSCC | tRNA processing | 49/4864 | 127/18723 | 1.20e-03 | 7.81e-03 | 49 |
| GO:00322593 | Skin | cSCC | methylation | 120/4864 | 364/18723 | 1.61e-03 | 9.93e-03 | 120 |
| Page: 1 2 3 |
| Pathway ID | Tissue | Disease Stage | Description | Gene Ratio | Bg Ratio | pvalue | p.adjust | qvalue | Count |
| Page: 1 |
Top |
Cell-cell communication analysis |
| Identification of potential cell-cell interactions between two cell types and their ligand-receptor pairs for different disease states |
| Ligand | Receptor | LRpair | Pathway | Tissue | Disease Stage |
| Page: 1 |
Top |
Single-cell gene regulatory network inference analysis |
| Find out the significant the regulons (TFs) and the target genes of each regulon across cell types for different disease states |
| TF | Cell Type | Tissue | Disease Stage | Target Gene | RSS | Regulon Activity |
| ∗The dot plots of a searched regulon are shown for all cell subpopulations in each disease state of each tissue based on the regulon specific score inferred using pySCENIC and by calculating the average expression. |
| Page: 1 |
Top |
Somatic mutation of malignant transformation related genes |
| Annotation of somatic variants for genes involved in malignant transformation |
| Hugo Symbol | Variant Class | Variant Classification | dbSNP RS | HGVSc | HGVSp | HGVSp Short | SWISSPROT | BIOTYPE | SIFT | PolyPhen | Tumor Sample Barcode | Tissue | Histology | Sex | Age | Stage | Therapy Types | Drugs | Outcome |
| DALRD3 | SNV | Missense_Mutation | c.1186N>T | p.Gly396Cys | p.G396C | Q5D0E6 | protein_coding | deleterious(0) | probably_damaging(0.999) | TCGA-A2-A0T0-01 | Breast | breast invasive carcinoma | Female | <65 | I/II | Chemotherapy | taxotere | SD | |
| DALRD3 | SNV | Missense_Mutation | c.757G>C | p.Glu253Gln | p.E253Q | Q5D0E6 | protein_coding | tolerated(0.31) | benign(0.038) | TCGA-A2-A0YK-01 | Breast | breast invasive carcinoma | Female | <65 | I/II | Chemotherapy | cytoxan | SD | |
| DALRD3 | SNV | Missense_Mutation | novel | c.610N>T | p.Asp204Tyr | p.D204Y | Q5D0E6 | protein_coding | deleterious(0.03) | benign(0.001) | TCGA-A2-A3XY-01 | Breast | breast invasive carcinoma | Female | <65 | I/II | Chemotherapy | adriamycin | PD |
| DALRD3 | SNV | Missense_Mutation | c.1226N>A | p.Arg409His | p.R409H | Q5D0E6 | protein_coding | deleterious(0) | probably_damaging(1) | TCGA-AR-A0TW-01 | Breast | breast invasive carcinoma | Female | <65 | III/IV | Chemotherapy | doxorubicin | PD | |
| DALRD3 | SNV | Missense_Mutation | c.787N>T | p.His263Tyr | p.H263Y | Q5D0E6 | protein_coding | tolerated(1) | benign(0) | TCGA-AR-A256-01 | Breast | breast invasive carcinoma | Female | <65 | I/II | Chemotherapy | doxorubicin | PD | |
| DALRD3 | SNV | Missense_Mutation | novel | c.552N>C | p.Glu184Asp | p.E184D | Q5D0E6 | protein_coding | tolerated(0.15) | benign(0.05) | TCGA-BH-A0B6-01 | Breast | breast invasive carcinoma | Female | <65 | I/II | Unknown | Unknown | SD |
| DALRD3 | SNV | Missense_Mutation | c.910N>C | p.Lys304Gln | p.K304Q | Q5D0E6 | protein_coding | tolerated(0.91) | benign(0) | TCGA-D8-A1X9-01 | Breast | breast invasive carcinoma | Female | >=65 | I/II | Chemotherapy | adriamycin+cyclophosphamide | SD | |
| DALRD3 | SNV | Missense_Mutation | c.1163C>G | p.Ala388Gly | p.A388G | Q5D0E6 | protein_coding | tolerated(0.26) | benign(0.057) | TCGA-E2-A15S-01 | Breast | breast invasive carcinoma | Female | <65 | I/II | Chemotherapy | doxorubicin | SD | |
| DALRD3 | SNV | Missense_Mutation | novel | c.854N>C | p.Cys285Ser | p.C285S | Q5D0E6 | protein_coding | deleterious(0.04) | probably_damaging(0.91) | TCGA-C5-A1MP-01 | Cervix | cervical & endocervical cancer | Female | <65 | I/II | Unknown | Unknown | SD |
| DALRD3 | SNV | Missense_Mutation | novel | c.778N>C | p.Glu260Gln | p.E260Q | Q5D0E6 | protein_coding | tolerated(0.23) | benign(0.007) | TCGA-C5-A1MP-01 | Cervix | cervical & endocervical cancer | Female | <65 | I/II | Unknown | Unknown | SD |
| Page: 1 2 3 4 5 |
Top |
Related drugs of malignant transformation related genes |
| Identification of chemicals and drugs interact with genes involved in malignant transfromation |
| (DGIdb 4.0) |
| Entrez ID | Symbol | Category | Interaction Types | Drug Claim Name | Drug Name | PMIDs |
| Page: 1 |

Copyright 2023-Present -The University of Texas Health Science Center at Houston |