
|
|||||
|
 | |
| |
| |
| |
| |
| |
|
Gene: CYP2B6 |
Gene summary for CYP2B6 |
| Gene information | Species | Human | Gene symbol | CYP2B6 | Gene ID | 1555 |
| Gene name | cytochrome P450 family 2 subfamily B member 6 | |
| Gene Alias | CPB6 | |
| Cytomap | 19q13.2 | |
| Gene Type | protein-coding | GO ID | GO:0001676 | UniProtAcc | P20813 |
Top |
Malignant transformation analysis |
| Identification of the aberrant gene expression in precancerous and cancerous lesions by comparing the gene expression of stem-like cells in diseased tissues with normal stem cells |
| Entrez ID | Symbol | Replicates | Species | Organ | Tissue | Adj P-value | Log2FC | Malignancy |
| 1555 | CYP2B6 | HTA11_1938_2000001011 | Human | Colorectum | AD | 2.01e-04 | 3.16e-01 | -0.0811 |
| 1555 | CYP2B6 | HTA11_83_2000001011 | Human | Colorectum | SER | 2.69e-10 | 5.19e-01 | -0.1526 |
| 1555 | CYP2B6 | HTA11_1391_2000001011 | Human | Colorectum | AD | 6.41e-03 | 2.35e-01 | -0.059 |
| 1555 | CYP2B6 | HTA11_99999970781_79442 | Human | Colorectum | MSS | 8.58e-06 | 2.57e-01 | 0.294 |
| 1555 | CYP2B6 | CRC-3-11773 | Human | Colorectum | CRC | 3.49e-02 | 3.34e-01 | 0.2564 |
| 1555 | CYP2B6 | NAFLD1 | Human | Liver | NAFLD | 6.87e-16 | 1.65e+00 | -0.04 |
| 1555 | CYP2B6 | S41 | Human | Liver | Cirrhotic | 3.40e-04 | 8.67e-01 | -0.0343 |
| 1555 | CYP2B6 | S43 | Human | Liver | Cirrhotic | 4.21e-02 | -3.95e-01 | -0.0187 |
| 1555 | CYP2B6 | HCC1_Meng | Human | Liver | HCC | 1.19e-174 | -1.91e-01 | 0.0246 |
| 1555 | CYP2B6 | HCC2_Meng | Human | Liver | HCC | 7.87e-19 | -5.65e-01 | 0.0107 |
| 1555 | CYP2B6 | cirrhotic1 | Human | Liver | Cirrhotic | 1.32e-12 | -5.78e-01 | 0.0202 |
| 1555 | CYP2B6 | cirrhotic2 | Human | Liver | Cirrhotic | 2.09e-11 | -5.76e-01 | 0.0201 |
| 1555 | CYP2B6 | cirrhotic3 | Human | Liver | Cirrhotic | 6.96e-05 | -5.80e-01 | 0.0215 |
| 1555 | CYP2B6 | Pt13.a | Human | Liver | HCC | 4.58e-11 | -5.77e-01 | 0.021 |
| 1555 | CYP2B6 | Pt13.b | Human | Liver | HCC | 1.61e-03 | -5.75e-01 | 0.0251 |
| 1555 | CYP2B6 | Pt14.b | Human | Liver | HCC | 4.41e-03 | -4.04e-01 | 0.018 |
| 1555 | CYP2B6 | Pt14.d | Human | Liver | HCC | 5.86e-14 | -5.56e-01 | 0.0143 |
| 1555 | CYP2B6 | S014 | Human | Liver | HCC | 5.14e-10 | 1.27e-01 | 0.2254 |
| 1555 | CYP2B6 | S015 | Human | Liver | HCC | 5.16e-09 | 6.74e-01 | 0.2375 |
| 1555 | CYP2B6 | S016 | Human | Liver | HCC | 4.46e-15 | 3.52e-01 | 0.2243 |
| Page: 1 2 |
| Tissue | Expression Dynamics | Abbreviation |
| Colorectum (GSE201348) | 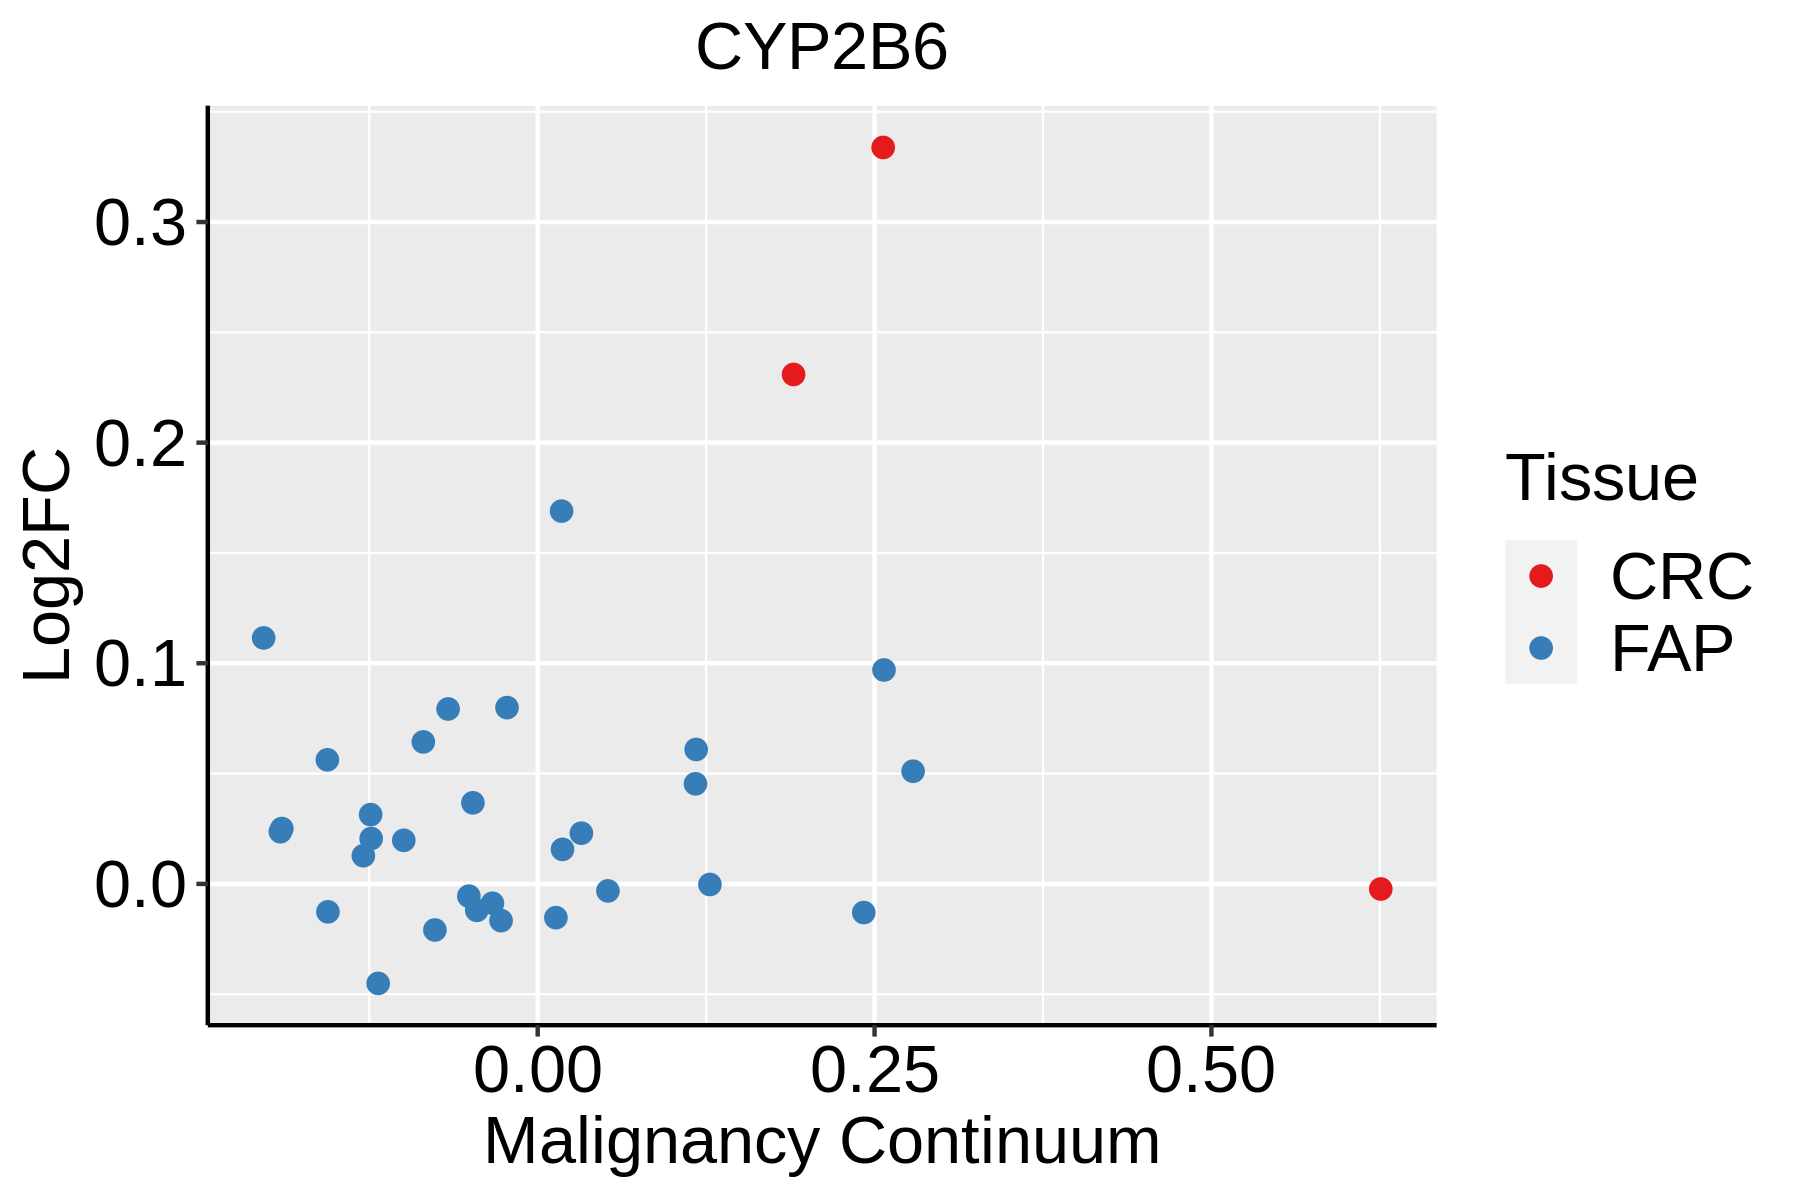 | FAP: Familial adenomatous polyposis |
| CRC: Colorectal cancer | ||
| Colorectum (HTA11) |  | AD: Adenomas |
| SER: Sessile serrated lesions | ||
| MSI-H: Microsatellite-high colorectal cancer | ||
| MSS: Microsatellite stable colorectal cancer | ||
| Liver |  | HCC: Hepatocellular carcinoma |
| NAFLD: Non-alcoholic fatty liver disease |
| ∗log2FC in expression of this searched gene in stem-like cells from each diseased tissue sample relative to stem-like cells in normal samples in each tissue plotted against the malignancy continuum. Samples are colored based on if they are from different disease stage. |
Top |
Malignant transformation related pathway analysis |
| Find out the enriched GO biological processes and KEGG pathways involved in transition from healthy to precancer to cancer |
| Tissue | Disease Stage | Enriched GO biological Processes |
| Colorectum | AD |  |
| Colorectum | SER |  |
| Colorectum | MSS |  |
| Colorectum | MSI-H |  |
| Colorectum | FAP |  |
| ∗Top 15 enriched GO BP terms are showed in the bar plot of each disease state in each tissue. Each row represents a significant GO biological process which is colored according to the -log10(p.adjust). |
| Page: 1 2 3 4 5 6 7 8 9 |
| GO ID | Tissue | Disease Stage | Description | Gene Ratio | Bg Ratio | pvalue | p.adjust | Count |
| GO:000941012 | Liver | Cirrhotic | response to xenobiotic stimulus | 165/4634 | 462/18723 | 6.82e-08 | 2.09e-06 | 165 |
| GO:004218011 | Liver | Cirrhotic | cellular ketone metabolic process | 80/4634 | 211/18723 | 1.40e-05 | 1.95e-04 | 80 |
| GO:00714661 | Liver | Cirrhotic | cellular response to xenobiotic stimulus | 66/4634 | 177/18723 | 1.34e-04 | 1.31e-03 | 66 |
| GO:000680511 | Liver | Cirrhotic | xenobiotic metabolic process | 43/4634 | 111/18723 | 7.51e-04 | 5.54e-03 | 43 |
| GO:003355911 | Liver | Cirrhotic | unsaturated fatty acid metabolic process | 43/4634 | 116/18723 | 2.09e-03 | 1.29e-02 | 43 |
| GO:0042178 | Liver | Cirrhotic | xenobiotic catabolic process | 17/4634 | 37/18723 | 4.02e-03 | 2.17e-02 | 17 |
| GO:000167611 | Liver | Cirrhotic | long-chain fatty acid metabolic process | 40/4634 | 112/18723 | 6.16e-03 | 3.06e-02 | 40 |
| GO:012025411 | Liver | Cirrhotic | olefinic compound metabolic process | 51/4634 | 153/18723 | 1.03e-02 | 4.61e-02 | 51 |
| GO:000663122 | Liver | HCC | fatty acid metabolic process | 238/7958 | 390/18723 | 8.24e-14 | 4.84e-12 | 238 |
| GO:00082022 | Liver | HCC | steroid metabolic process | 188/7958 | 319/18723 | 1.96e-09 | 5.63e-08 | 188 |
| GO:000941022 | Liver | HCC | response to xenobiotic stimulus | 248/7958 | 462/18723 | 6.47e-07 | 1.02e-05 | 248 |
| GO:004218021 | Liver | HCC | cellular ketone metabolic process | 123/7958 | 211/18723 | 2.52e-06 | 3.37e-05 | 123 |
| GO:00714662 | Liver | HCC | cellular response to xenobiotic stimulus | 93/7958 | 177/18723 | 4.35e-03 | 1.89e-02 | 93 |
| GO:000167621 | Liver | HCC | long-chain fatty acid metabolic process | 60/7958 | 112/18723 | 1.17e-02 | 4.28e-02 | 60 |
| Page: 1 2 |
| Pathway ID | Tissue | Disease Stage | Description | Gene Ratio | Bg Ratio | pvalue | p.adjust | qvalue | Count |
| hsa05417 | Colorectum | AD | Lipid and atherosclerosis | 73/2092 | 215/8465 | 1.31e-03 | 8.27e-03 | 5.27e-03 | 73 |
| hsa054171 | Colorectum | AD | Lipid and atherosclerosis | 73/2092 | 215/8465 | 1.31e-03 | 8.27e-03 | 5.27e-03 | 73 |
| hsa054172 | Colorectum | SER | Lipid and atherosclerosis | 55/1580 | 215/8465 | 6.83e-03 | 3.77e-02 | 2.74e-02 | 55 |
| hsa054173 | Colorectum | SER | Lipid and atherosclerosis | 55/1580 | 215/8465 | 6.83e-03 | 3.77e-02 | 2.74e-02 | 55 |
| hsa054174 | Colorectum | MSS | Lipid and atherosclerosis | 70/1875 | 215/8465 | 2.38e-04 | 1.81e-03 | 1.11e-03 | 70 |
| hsa054175 | Colorectum | MSS | Lipid and atherosclerosis | 70/1875 | 215/8465 | 2.38e-04 | 1.81e-03 | 1.11e-03 | 70 |
| hsa054178 | Colorectum | CRC | Lipid and atherosclerosis | 45/1091 | 215/8465 | 5.73e-04 | 5.48e-03 | 3.72e-03 | 45 |
| hsa05207 | Colorectum | CRC | Chemical carcinogenesis - receptor activation | 42/1091 | 212/8465 | 2.62e-03 | 1.75e-02 | 1.19e-02 | 42 |
| hsa054179 | Colorectum | CRC | Lipid and atherosclerosis | 45/1091 | 215/8465 | 5.73e-04 | 5.48e-03 | 3.72e-03 | 45 |
| hsa052071 | Colorectum | CRC | Chemical carcinogenesis - receptor activation | 42/1091 | 212/8465 | 2.62e-03 | 1.75e-02 | 1.19e-02 | 42 |
| hsa0541714 | Liver | NAFLD | Lipid and atherosclerosis | 42/1043 | 215/8465 | 1.46e-03 | 1.71e-02 | 1.38e-02 | 42 |
| hsa0541715 | Liver | NAFLD | Lipid and atherosclerosis | 42/1043 | 215/8465 | 1.46e-03 | 1.71e-02 | 1.38e-02 | 42 |
| hsa0541722 | Liver | Cirrhotic | Lipid and atherosclerosis | 80/2530 | 215/8465 | 1.18e-02 | 3.81e-02 | 2.35e-02 | 80 |
| hsa0541732 | Liver | Cirrhotic | Lipid and atherosclerosis | 80/2530 | 215/8465 | 1.18e-02 | 3.81e-02 | 2.35e-02 | 80 |
| hsa0541742 | Liver | HCC | Lipid and atherosclerosis | 118/4020 | 215/8465 | 1.66e-02 | 3.92e-02 | 2.18e-02 | 118 |
| hsa0541752 | Liver | HCC | Lipid and atherosclerosis | 118/4020 | 215/8465 | 1.66e-02 | 3.92e-02 | 2.18e-02 | 118 |
| Page: 1 |
Top |
Cell-cell communication analysis |
| Identification of potential cell-cell interactions between two cell types and their ligand-receptor pairs for different disease states |
| Ligand | Receptor | LRpair | Pathway | Tissue | Disease Stage |
| Page: 1 |
Top |
Single-cell gene regulatory network inference analysis |
| Find out the significant the regulons (TFs) and the target genes of each regulon across cell types for different disease states |
| TF | Cell Type | Tissue | Disease Stage | Target Gene | RSS | Regulon Activity |
| ∗The dot plots of a searched regulon are shown for all cell subpopulations in each disease state of each tissue based on the regulon specific score inferred using pySCENIC and by calculating the average expression. |
| Page: 1 |
Top |
Somatic mutation of malignant transformation related genes |
| Annotation of somatic variants for genes involved in malignant transformation |
| Hugo Symbol | Variant Class | Variant Classification | dbSNP RS | HGVSc | HGVSp | HGVSp Short | SWISSPROT | BIOTYPE | SIFT | PolyPhen | Tumor Sample Barcode | Tissue | Histology | Sex | Age | Stage | Therapy Types | Drugs | Outcome |
| CYP2B6 | SNV | Missense_Mutation | novel | c.950A>C | p.Tyr317Ser | p.Y317S | P20813 | protein_coding | deleterious(0) | probably_damaging(0.966) | TCGA-AR-A1AY-01 | Breast | breast invasive carcinoma | Female | >=65 | I/II | Unspecific | Doxorubicin | SD |
| CYP2B6 | SNV | Missense_Mutation | novel | c.502N>C | p.Thr168Pro | p.T168P | P20813 | protein_coding | deleterious(0) | possibly_damaging(0.87) | TCGA-BH-A0HO-01 | Breast | breast invasive carcinoma | Female | <65 | I/II | Chemotherapy | cyclophosphamide | SD |
| CYP2B6 | SNV | Missense_Mutation | c.316N>G | p.Pro106Ala | p.P106A | P20813 | protein_coding | tolerated(0.56) | benign(0.007) | TCGA-BH-A208-01 | Breast | breast invasive carcinoma | Female | <65 | I/II | Unknown | Unknown | SD | |
| CYP2B6 | SNV | Missense_Mutation | c.752A>T | p.Lys251Met | p.K251M | P20813 | protein_coding | tolerated(0.25) | probably_damaging(0.973) | TCGA-E2-A1L7-01 | Breast | breast invasive carcinoma | Female | <65 | III/IV | Chemotherapy | cyclophosphamide | PD | |
| CYP2B6 | SNV | Missense_Mutation | novel | c.950N>C | p.Tyr317Ser | p.Y317S | P20813 | protein_coding | deleterious(0) | probably_damaging(0.966) | TCGA-E9-A22H-01 | Breast | breast invasive carcinoma | Female | <65 | I/II | Chemotherapy | doxorubicin | SD |
| CYP2B6 | SNV | Missense_Mutation | rs769787099 | c.1063G>A | p.Glu355Lys | p.E355K | P20813 | protein_coding | deleterious(0) | probably_damaging(0.998) | TCGA-EA-A43B-01 | Cervix | cervical & endocervical cancer | Female | <65 | I/II | Chemotherapy | cisplatin | CR |
| CYP2B6 | SNV | Missense_Mutation | novel | c.985N>C | p.Glu329Gln | p.E329Q | P20813 | protein_coding | deleterious(0.01) | benign(0.247) | TCGA-VS-A953-01 | Cervix | cervical & endocervical cancer | Female | <65 | I/II | Unknown | Unknown | PD |
| CYP2B6 | SNV | Missense_Mutation | rs138594605 | c.875N>T | p.Thr292Met | p.T292M | P20813 | protein_coding | deleterious(0.01) | probably_damaging(0.983) | TCGA-A6-6781-01 | Colorectum | colon adenocarcinoma | Male | <65 | III/IV | Chemotherapy | oxaliplatin | SD |
| CYP2B6 | SNV | Missense_Mutation | rs781365650 | c.104N>A | p.Arg35His | p.R35H | P20813 | protein_coding | tolerated(0.14) | benign(0.372) | TCGA-AZ-4315-01 | Colorectum | colon adenocarcinoma | Male | <65 | I/II | Unknown | Unknown | SD |
| CYP2B6 | SNV | Missense_Mutation | novel | c.74N>G | p.Asn25Ser | p.N25S | P20813 | protein_coding | tolerated(0.84) | benign(0.027) | TCGA-AZ-6598-01 | Colorectum | colon adenocarcinoma | Female | >=65 | I/II | Unknown | Unknown | SD |
| Page: 1 2 3 4 5 6 7 |
Top |
Related drugs of malignant transformation related genes |
| Identification of chemicals and drugs interact with genes involved in malignant transfromation |
| (DGIdb 4.0) |
| Entrez ID | Symbol | Category | Interaction Types | Drug Claim Name | Drug Name | PMIDs |
| 1555 | CYP2B6 | DRUGGABLE GENOME, CYTOCHROME P450, ENZYME | artemisinin | ARTEMISININ | 17638512,11470993 | |
| 1555 | CYP2B6 | DRUGGABLE GENOME, CYTOCHROME P450, ENZYME | aflatoxin b1 | 17638512,11470993 | ||
| 1555 | CYP2B6 | DRUGGABLE GENOME, CYTOCHROME P450, ENZYME | TAMOXIFEN | TAMOXIFEN | 22942317 | |
| 1555 | CYP2B6 | DRUGGABLE GENOME, CYTOCHROME P450, ENZYME | mitotane | MITOTANE | 23524664 | |
| 1555 | CYP2B6 | DRUGGABLE GENOME, CYTOCHROME P450, ENZYME | methadone | METHADONE | 17329992,27286724,17178267,17502774,28320034,21902500,17638512,23249875,16338275,11470993,27289271,30907440,21790905,25556837 | |
| 1555 | CYP2B6 | DRUGGABLE GENOME, CYTOCHROME P450, ENZYME | inhibitor | 178103880 | TICLOPIDINE | |
| 1555 | CYP2B6 | DRUGGABLE GENOME, CYTOCHROME P450, ENZYME | VORICONAZOLE | VORICONAZOLE | 19029318 | |
| 1555 | CYP2B6 | DRUGGABLE GENOME, CYTOCHROME P450, ENZYME | zidovudine | ZIDOVUDINE | 23089673 | |
| 1555 | CYP2B6 | DRUGGABLE GENOME, CYTOCHROME P450, ENZYME | sorafenib | SORAFENIB | 28362716 | |
| 1555 | CYP2B6 | DRUGGABLE GENOME, CYTOCHROME P450, ENZYME | 3,4-methylenedioxymethamphetamine | 28117133,17638512,11470993 |
| Page: 1 2 3 4 5 6 7 |

Copyright 2023-Present -The University of Texas Health Science Center at Houston |