
|
|||||
|
 | |
| |
| |
| |
| |
| |
|
Gene: CTPS1 |
Gene summary for CTPS1 |
| Gene information | Species | Human | Gene symbol | CTPS1 | Gene ID | 1503 |
| Gene name | CTP synthase 1 | |
| Gene Alias | CTPS | |
| Cytomap | 1p34.2 | |
| Gene Type | protein-coding | GO ID | GO:0001775 | UniProtAcc | B4E1E0 |
Top |
Malignant transformation analysis |
| Identification of the aberrant gene expression in precancerous and cancerous lesions by comparing the gene expression of stem-like cells in diseased tissues with normal stem cells |
| Entrez ID | Symbol | Replicates | Species | Organ | Tissue | Adj P-value | Log2FC | Malignancy |
| 1503 | CTPS1 | LZE2T | Human | Esophagus | ESCC | 1.57e-05 | 6.53e-01 | 0.082 |
| 1503 | CTPS1 | LZE4T | Human | Esophagus | ESCC | 7.40e-07 | 1.31e-01 | 0.0811 |
| 1503 | CTPS1 | LZE7T | Human | Esophagus | ESCC | 3.40e-03 | 4.65e-01 | 0.0667 |
| 1503 | CTPS1 | LZE22T | Human | Esophagus | ESCC | 8.85e-03 | 3.47e-01 | 0.068 |
| 1503 | CTPS1 | LZE24T | Human | Esophagus | ESCC | 5.07e-07 | 1.57e-01 | 0.0596 |
| 1503 | CTPS1 | LZE6T | Human | Esophagus | ESCC | 4.19e-03 | 2.24e-01 | 0.0845 |
| 1503 | CTPS1 | P1T-E | Human | Esophagus | ESCC | 1.20e-07 | 3.40e-01 | 0.0875 |
| 1503 | CTPS1 | P2T-E | Human | Esophagus | ESCC | 7.49e-15 | 4.30e-01 | 0.1177 |
| 1503 | CTPS1 | P4T-E | Human | Esophagus | ESCC | 1.99e-16 | 2.25e-01 | 0.1323 |
| 1503 | CTPS1 | P5T-E | Human | Esophagus | ESCC | 6.61e-18 | 3.72e-01 | 0.1327 |
| 1503 | CTPS1 | P9T-E | Human | Esophagus | ESCC | 3.40e-08 | 1.47e-01 | 0.1131 |
| 1503 | CTPS1 | P10T-E | Human | Esophagus | ESCC | 1.44e-11 | 2.96e-01 | 0.116 |
| 1503 | CTPS1 | P11T-E | Human | Esophagus | ESCC | 1.08e-02 | 3.34e-01 | 0.1426 |
| 1503 | CTPS1 | P12T-E | Human | Esophagus | ESCC | 5.66e-10 | 2.24e-01 | 0.1122 |
| 1503 | CTPS1 | P15T-E | Human | Esophagus | ESCC | 3.32e-14 | 2.74e-01 | 0.1149 |
| 1503 | CTPS1 | P16T-E | Human | Esophagus | ESCC | 1.10e-12 | 2.67e-01 | 0.1153 |
| 1503 | CTPS1 | P19T-E | Human | Esophagus | ESCC | 2.50e-05 | 5.30e-01 | 0.1662 |
| 1503 | CTPS1 | P20T-E | Human | Esophagus | ESCC | 1.12e-06 | 2.43e-01 | 0.1124 |
| 1503 | CTPS1 | P21T-E | Human | Esophagus | ESCC | 1.18e-32 | 7.17e-01 | 0.1617 |
| 1503 | CTPS1 | P22T-E | Human | Esophagus | ESCC | 2.54e-11 | 1.60e-01 | 0.1236 |
| Page: 1 2 3 4 5 |
| Tissue | Expression Dynamics | Abbreviation |
| Esophagus | 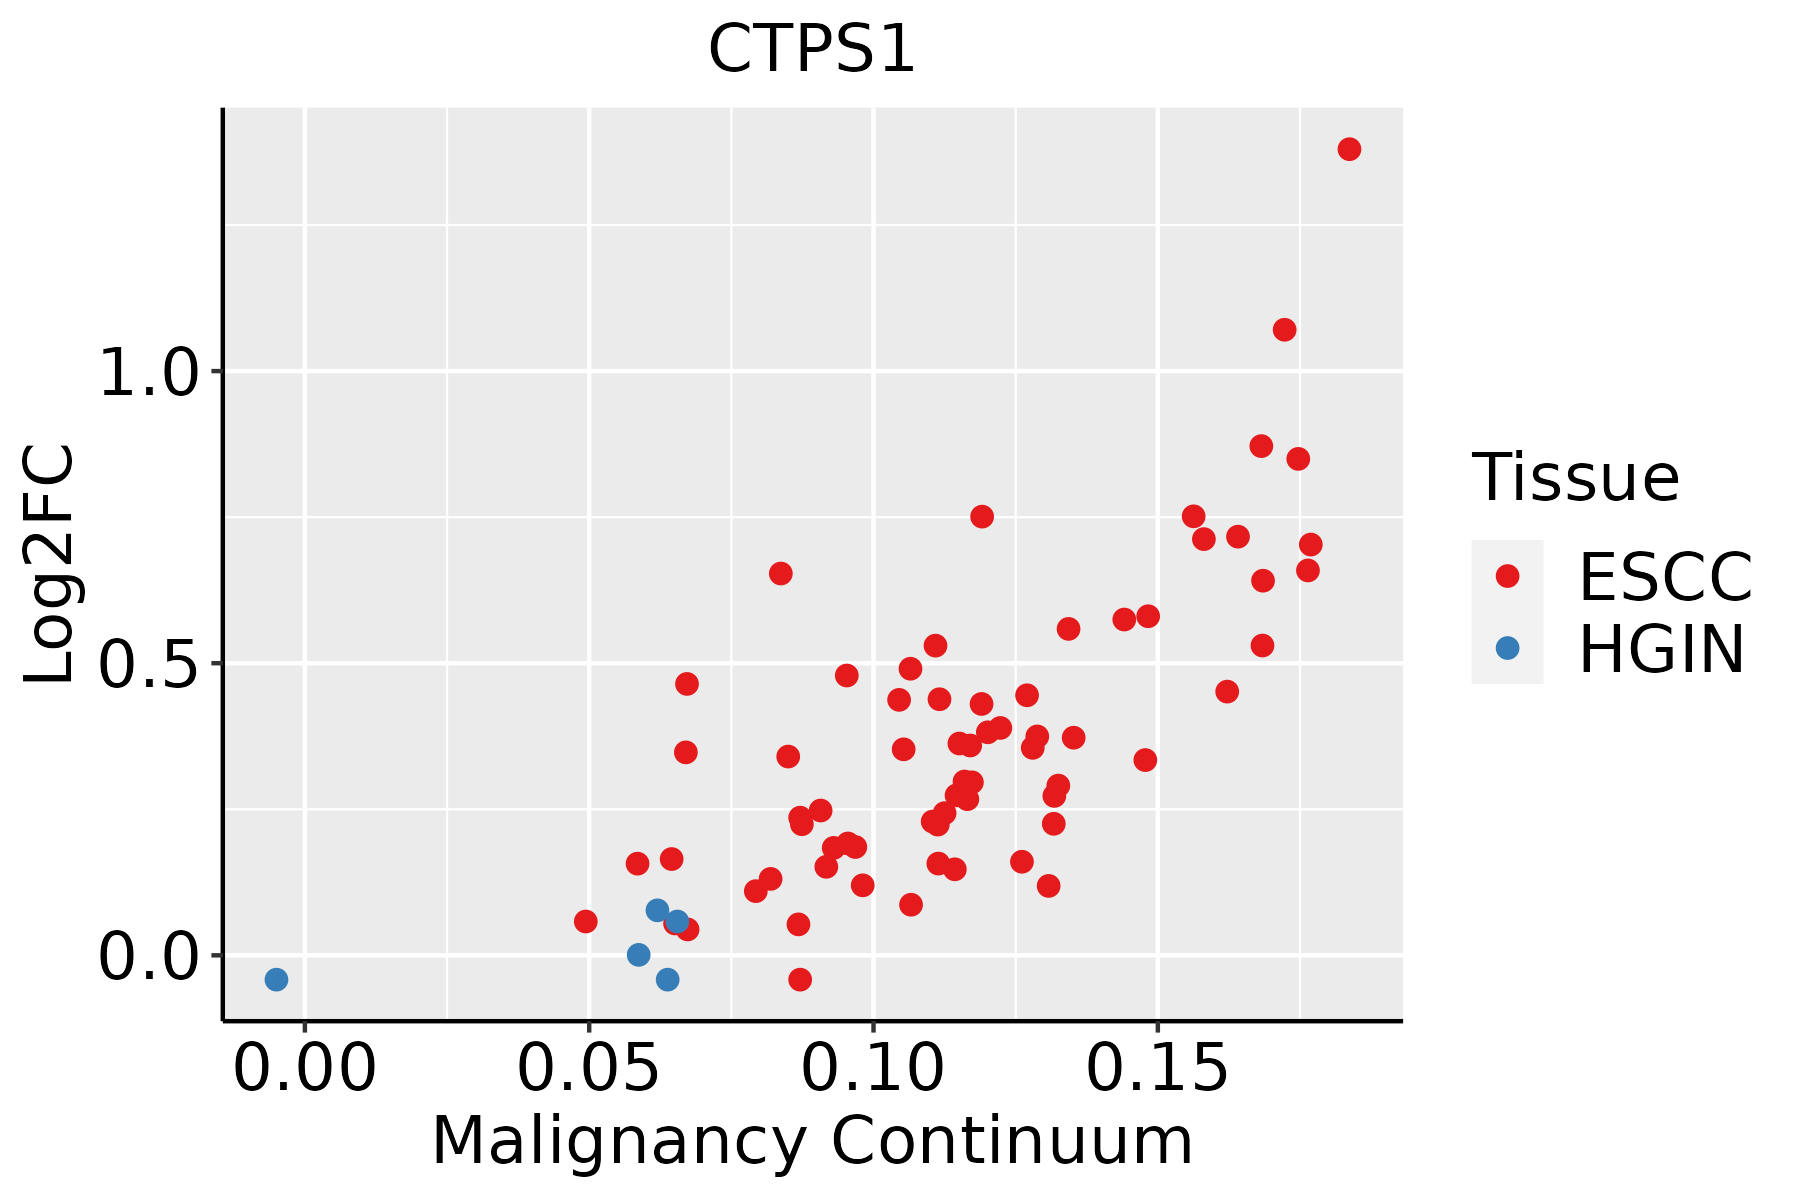 | ESCC: Esophageal squamous cell carcinoma |
| HGIN: High-grade intraepithelial neoplasias | ||
| LGIN: Low-grade intraepithelial neoplasias | ||
| Liver | 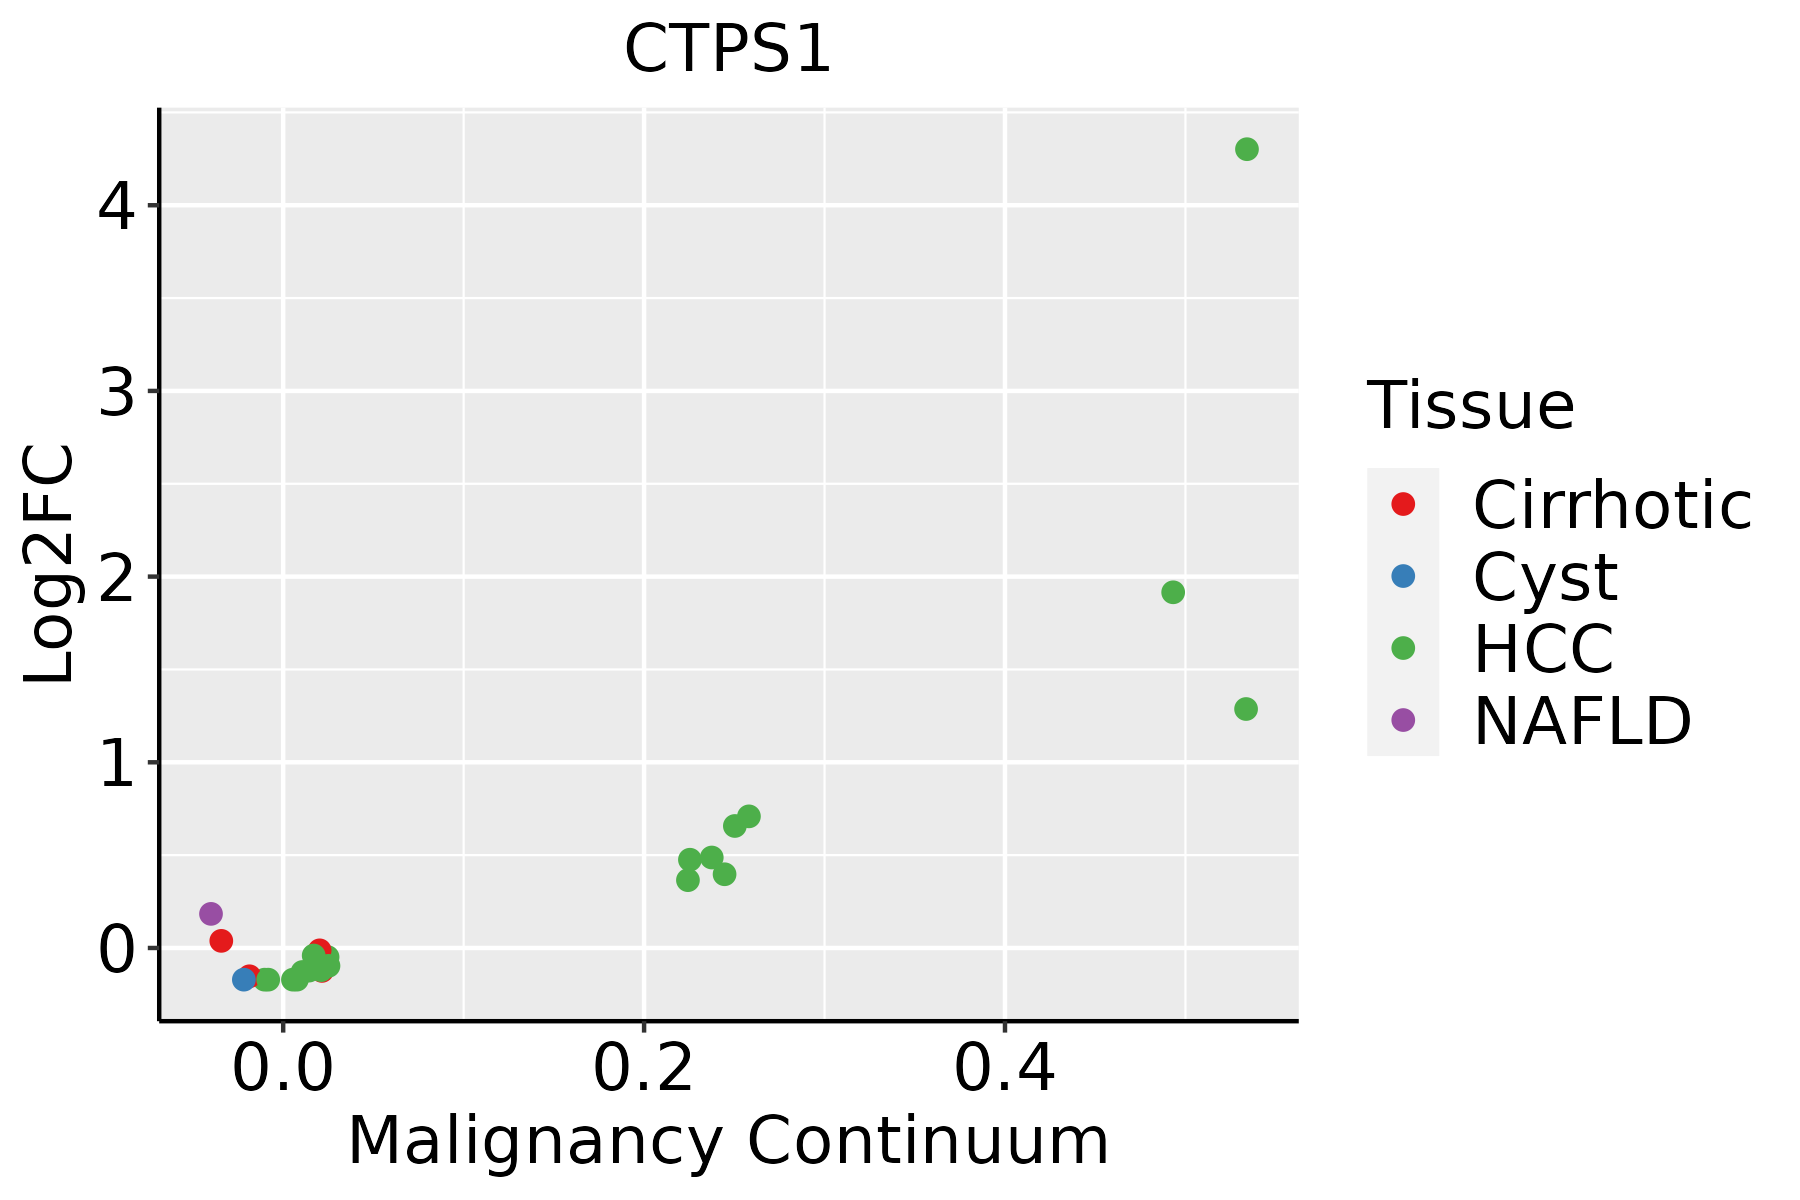 | HCC: Hepatocellular carcinoma |
| NAFLD: Non-alcoholic fatty liver disease | ||
| Oral Cavity | 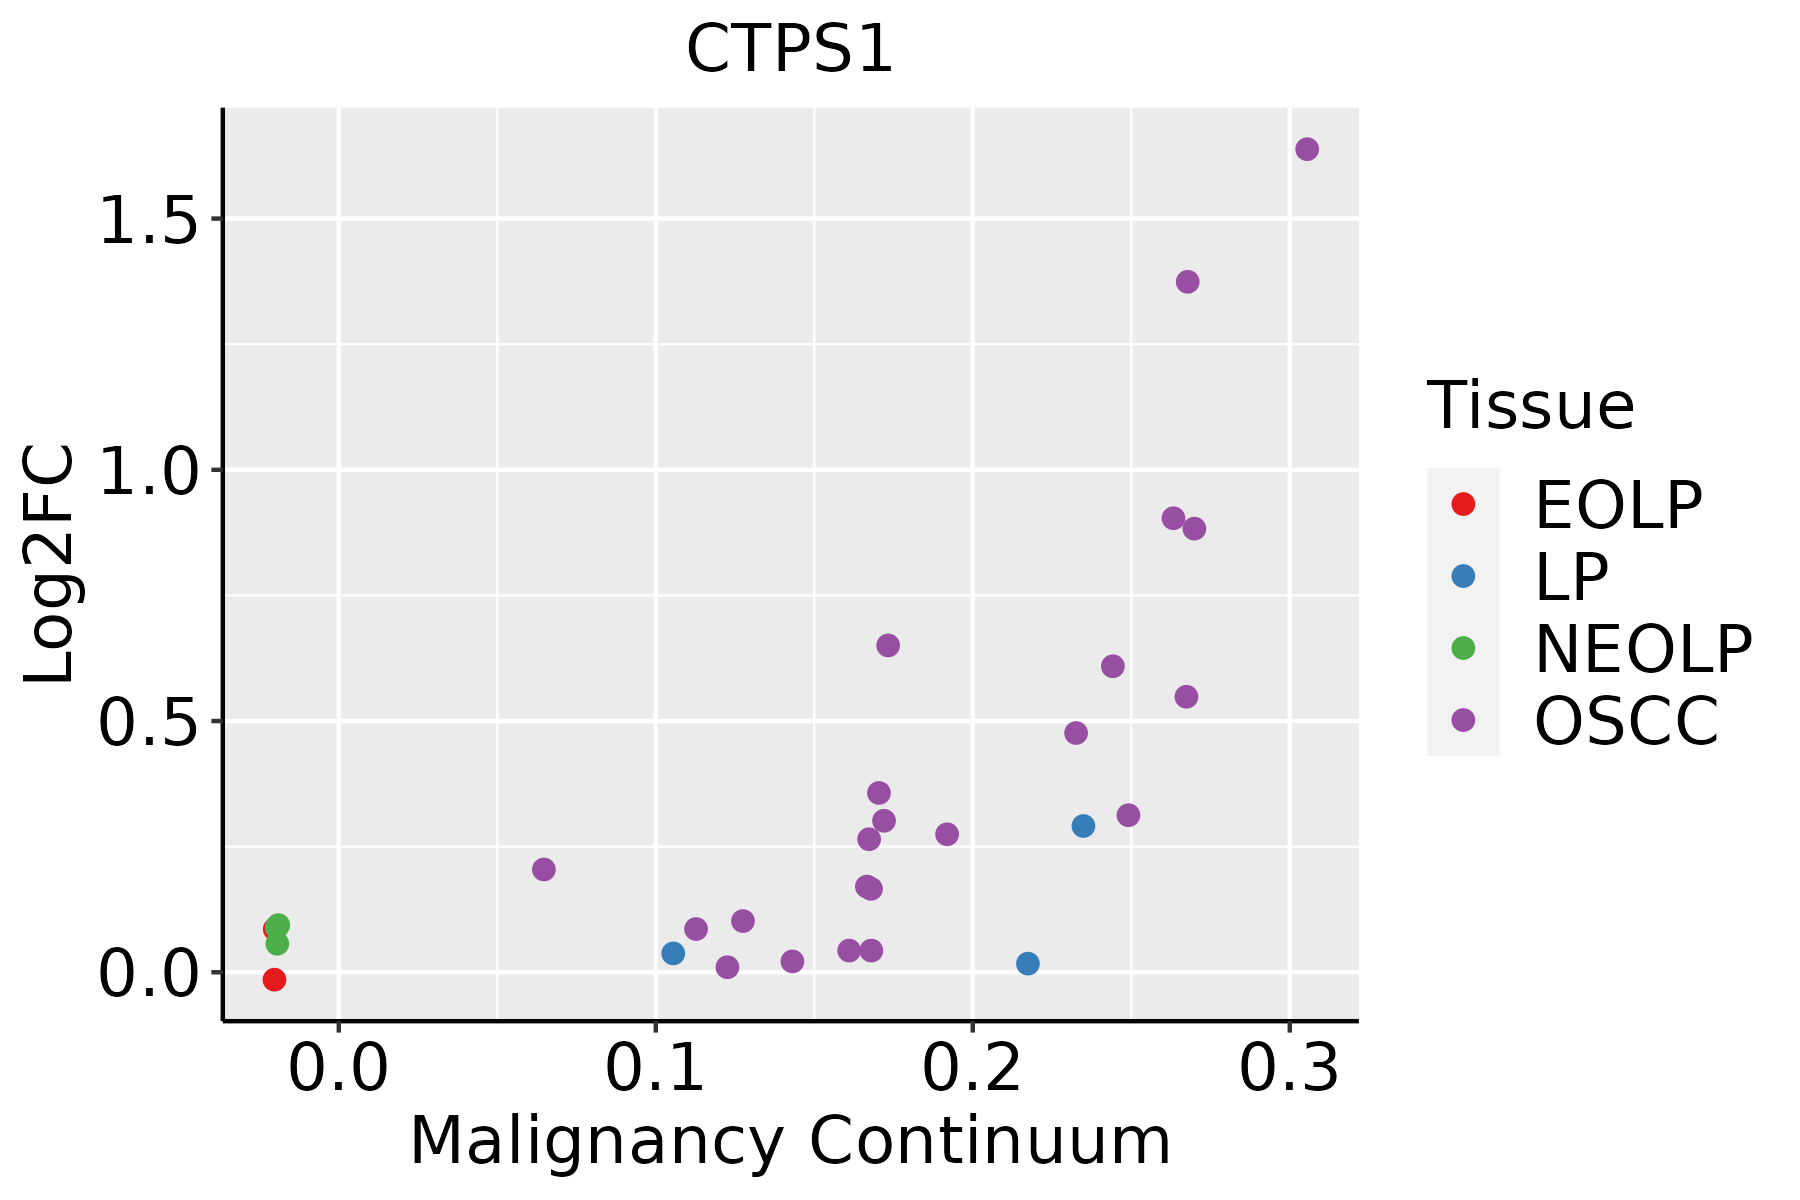 | EOLP: Erosive Oral lichen planus |
| LP: leukoplakia | ||
| NEOLP: Non-erosive oral lichen planus | ||
| OSCC: Oral squamous cell carcinoma | ||
| Skin | 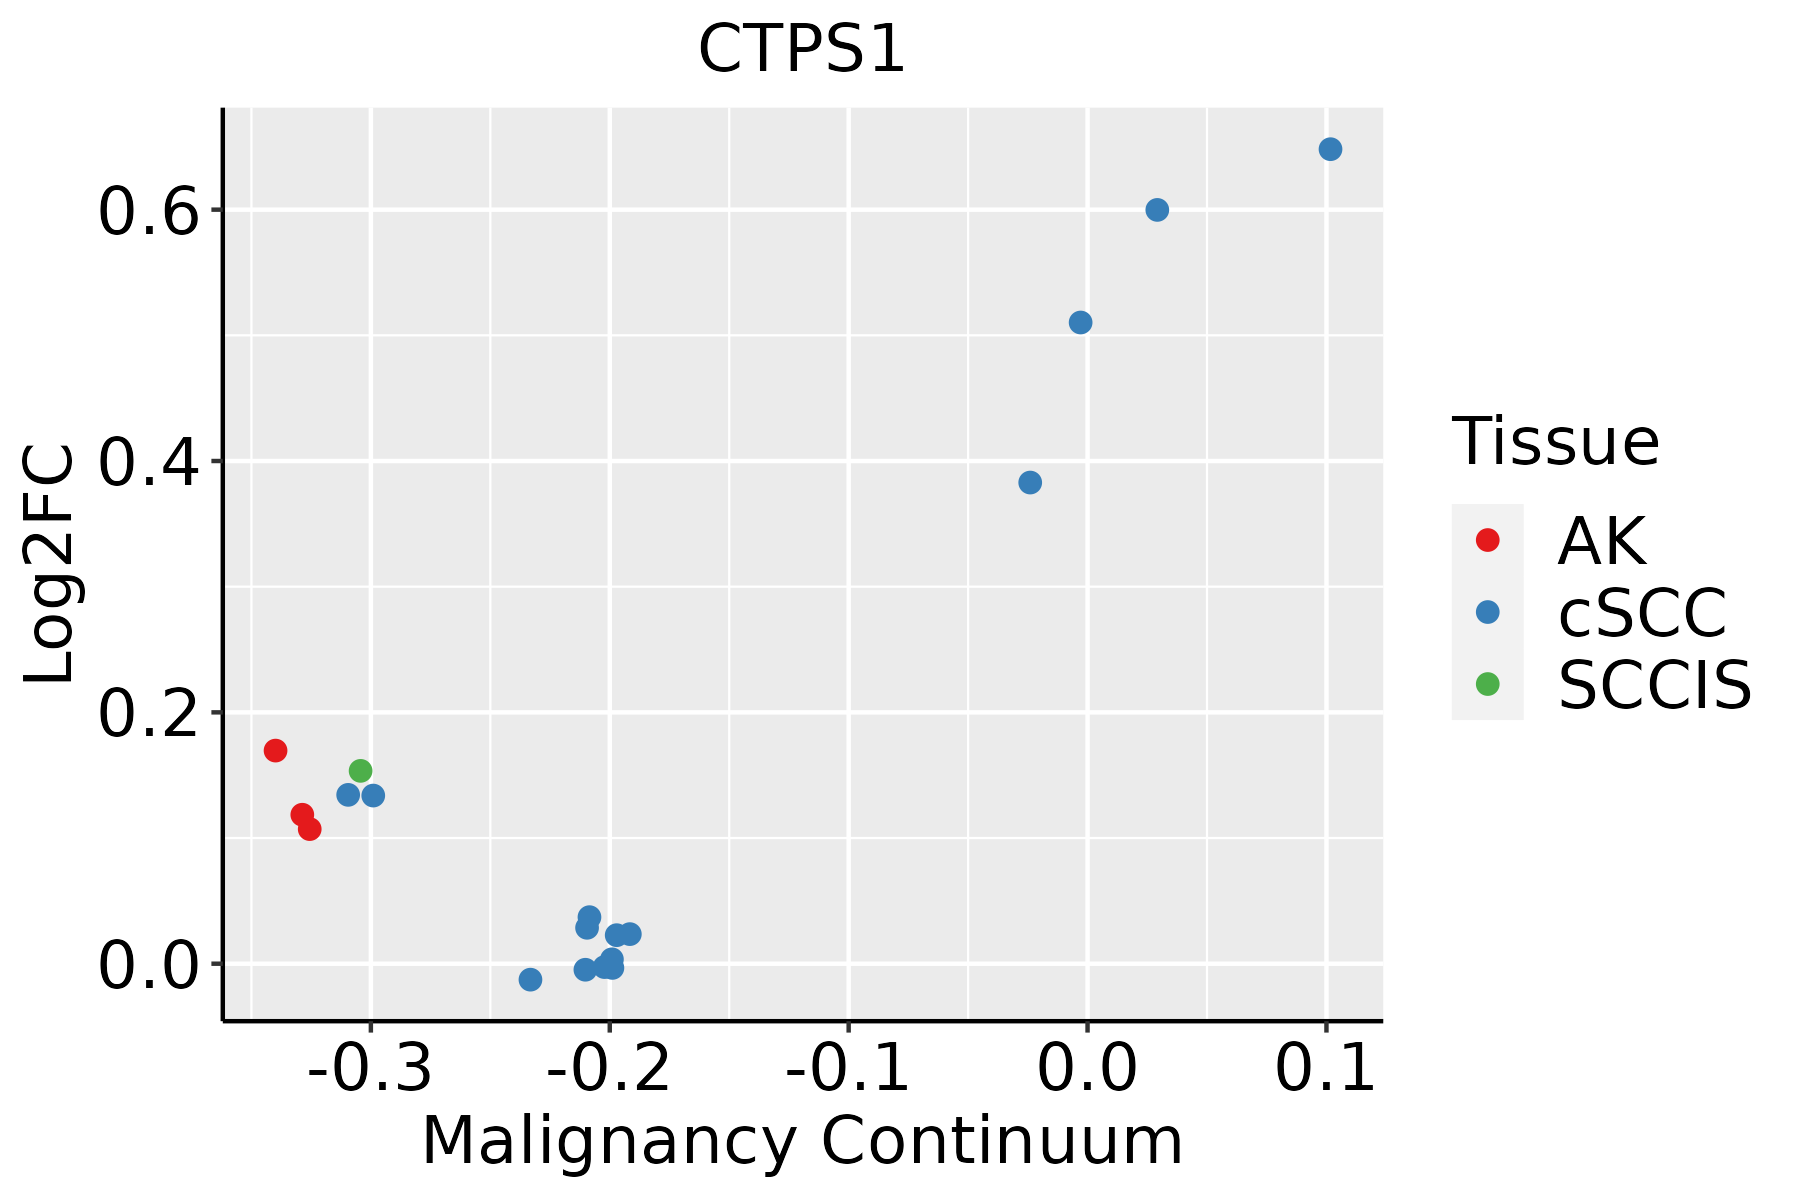 | AK: Actinic keratosis |
| cSCC: Cutaneous squamous cell carcinoma | ||
| SCCIS:squamous cell carcinoma in situ |
| ∗log2FC in expression of this searched gene in stem-like cells from each diseased tissue sample relative to stem-like cells in normal samples in each tissue plotted against the malignancy continuum. Samples are colored based on if they are from different disease stage. |
Top |
Malignant transformation related pathway analysis |
| Find out the enriched GO biological processes and KEGG pathways involved in transition from healthy to precancer to cancer |
| Tissue | Disease Stage | Enriched GO biological Processes |
| Colorectum | AD |  |
| Colorectum | SER |  |
| Colorectum | MSS |  |
| Colorectum | MSI-H |  |
| Colorectum | FAP |  |
| ∗Top 15 enriched GO BP terms are showed in the bar plot of each disease state in each tissue. Each row represents a significant GO biological process which is colored according to the -log10(p.adjust). |
| Page: 1 2 3 4 5 6 7 8 9 |
| GO ID | Tissue | Disease Stage | Description | Gene Ratio | Bg Ratio | pvalue | p.adjust | Count |
| GO:0009208 | Esophagus | ESCC | pyrimidine ribonucleoside triphosphate metabolic process | 14/8552 | 18/18723 | 5.77e-03 | 2.14e-02 | 14 |
| GO:00062213 | Esophagus | ESCC | pyrimidine nucleotide biosynthetic process | 21/8552 | 30/18723 | 6.17e-03 | 2.27e-02 | 21 |
| GO:000675312 | Liver | Cirrhotic | nucleoside phosphate metabolic process | 190/4634 | 497/18723 | 1.10e-11 | 6.96e-10 | 190 |
| GO:000911712 | Liver | Cirrhotic | nucleotide metabolic process | 187/4634 | 489/18723 | 1.55e-11 | 9.63e-10 | 187 |
| GO:001969312 | Liver | Cirrhotic | ribose phosphate metabolic process | 156/4634 | 396/18723 | 5.83e-11 | 3.23e-09 | 156 |
| GO:000925912 | Liver | Cirrhotic | ribonucleotide metabolic process | 151/4634 | 385/18723 | 1.72e-10 | 8.70e-09 | 151 |
| GO:000941012 | Liver | Cirrhotic | response to xenobiotic stimulus | 165/4634 | 462/18723 | 6.82e-08 | 2.09e-06 | 165 |
| GO:19016051 | Liver | Cirrhotic | alpha-amino acid metabolic process | 82/4634 | 195/18723 | 7.72e-08 | 2.30e-06 | 82 |
| GO:000652011 | Liver | Cirrhotic | cellular amino acid metabolic process | 103/4634 | 284/18723 | 8.88e-06 | 1.30e-04 | 103 |
| GO:00091121 | Liver | Cirrhotic | nucleobase metabolic process | 20/4634 | 34/18723 | 2.41e-05 | 3.14e-04 | 20 |
| GO:00463905 | Liver | Cirrhotic | ribose phosphate biosynthetic process | 71/4634 | 190/18723 | 7.09e-05 | 7.98e-04 | 71 |
| GO:00092605 | Liver | Cirrhotic | ribonucleotide biosynthetic process | 68/4634 | 182/18723 | 1.00e-04 | 1.05e-03 | 68 |
| GO:00091654 | Liver | Cirrhotic | nucleotide biosynthetic process | 89/4634 | 254/18723 | 1.45e-04 | 1.40e-03 | 89 |
| GO:19012934 | Liver | Cirrhotic | nucleoside phosphate biosynthetic process | 89/4634 | 256/18723 | 1.97e-04 | 1.82e-03 | 89 |
| GO:00062061 | Liver | Cirrhotic | pyrimidine nucleobase metabolic process | 11/4634 | 16/18723 | 2.58e-04 | 2.30e-03 | 11 |
| GO:0006220 | Liver | Cirrhotic | pyrimidine nucleotide metabolic process | 24/4634 | 50/18723 | 3.06e-04 | 2.68e-03 | 24 |
| GO:00091416 | Liver | Cirrhotic | nucleoside triphosphate metabolic process | 43/4634 | 112/18723 | 9.31e-04 | 6.62e-03 | 43 |
| GO:0046112 | Liver | Cirrhotic | nucleobase biosynthetic process | 11/4634 | 18/18723 | 1.13e-03 | 7.73e-03 | 11 |
| GO:00091425 | Liver | Cirrhotic | nucleoside triphosphate biosynthetic process | 33/4634 | 85/18723 | 2.81e-03 | 1.63e-02 | 33 |
| GO:0009218 | Liver | Cirrhotic | pyrimidine ribonucleotide metabolic process | 14/4634 | 29/18723 | 5.09e-03 | 2.62e-02 | 14 |
| Page: 1 2 3 4 5 6 |
| Pathway ID | Tissue | Disease Stage | Description | Gene Ratio | Bg Ratio | pvalue | p.adjust | qvalue | Count |
| hsa012325 | Esophagus | ESCC | Nucleotide metabolism | 59/4205 | 85/8465 | 1.67e-04 | 6.58e-04 | 3.37e-04 | 59 |
| hsa012405 | Esophagus | ESCC | Biosynthesis of cofactors | 97/4205 | 153/8465 | 3.88e-04 | 1.35e-03 | 6.94e-04 | 97 |
| hsa002405 | Esophagus | ESCC | Pyrimidine metabolism | 41/4205 | 58/8465 | 9.14e-04 | 2.92e-03 | 1.49e-03 | 41 |
| hsa0123212 | Esophagus | ESCC | Nucleotide metabolism | 59/4205 | 85/8465 | 1.67e-04 | 6.58e-04 | 3.37e-04 | 59 |
| hsa0124012 | Esophagus | ESCC | Biosynthesis of cofactors | 97/4205 | 153/8465 | 3.88e-04 | 1.35e-03 | 6.94e-04 | 97 |
| hsa0024012 | Esophagus | ESCC | Pyrimidine metabolism | 41/4205 | 58/8465 | 9.14e-04 | 2.92e-03 | 1.49e-03 | 41 |
| hsa01240 | Liver | Cirrhotic | Biosynthesis of cofactors | 66/2530 | 153/8465 | 3.11e-04 | 1.99e-03 | 1.23e-03 | 66 |
| hsa01232 | Liver | Cirrhotic | Nucleotide metabolism | 39/2530 | 85/8465 | 1.27e-03 | 6.73e-03 | 4.15e-03 | 39 |
| hsa00240 | Liver | Cirrhotic | Pyrimidine metabolism | 27/2530 | 58/8465 | 5.31e-03 | 1.88e-02 | 1.16e-02 | 27 |
| hsa012401 | Liver | Cirrhotic | Biosynthesis of cofactors | 66/2530 | 153/8465 | 3.11e-04 | 1.99e-03 | 1.23e-03 | 66 |
| hsa012321 | Liver | Cirrhotic | Nucleotide metabolism | 39/2530 | 85/8465 | 1.27e-03 | 6.73e-03 | 4.15e-03 | 39 |
| hsa002401 | Liver | Cirrhotic | Pyrimidine metabolism | 27/2530 | 58/8465 | 5.31e-03 | 1.88e-02 | 1.16e-02 | 27 |
| hsa012402 | Liver | HCC | Biosynthesis of cofactors | 103/4020 | 153/8465 | 4.67e-07 | 5.05e-06 | 2.81e-06 | 103 |
| hsa002402 | Liver | HCC | Pyrimidine metabolism | 44/4020 | 58/8465 | 9.34e-06 | 7.11e-05 | 3.95e-05 | 44 |
| hsa012322 | Liver | HCC | Nucleotide metabolism | 59/4020 | 85/8465 | 3.30e-05 | 1.88e-04 | 1.04e-04 | 59 |
| hsa012403 | Liver | HCC | Biosynthesis of cofactors | 103/4020 | 153/8465 | 4.67e-07 | 5.05e-06 | 2.81e-06 | 103 |
| hsa002403 | Liver | HCC | Pyrimidine metabolism | 44/4020 | 58/8465 | 9.34e-06 | 7.11e-05 | 3.95e-05 | 44 |
| hsa012323 | Liver | HCC | Nucleotide metabolism | 59/4020 | 85/8465 | 3.30e-05 | 1.88e-04 | 1.04e-04 | 59 |
| hsa012324 | Oral cavity | OSCC | Nucleotide metabolism | 54/3704 | 85/8465 | 1.78e-04 | 5.95e-04 | 3.03e-04 | 54 |
| hsa012404 | Oral cavity | OSCC | Biosynthesis of cofactors | 88/3704 | 153/8465 | 3.84e-04 | 1.20e-03 | 6.12e-04 | 88 |
| Page: 1 2 |
Top |
Cell-cell communication analysis |
| Identification of potential cell-cell interactions between two cell types and their ligand-receptor pairs for different disease states |
| Ligand | Receptor | LRpair | Pathway | Tissue | Disease Stage |
| Page: 1 |
Top |
Single-cell gene regulatory network inference analysis |
| Find out the significant the regulons (TFs) and the target genes of each regulon across cell types for different disease states |
| TF | Cell Type | Tissue | Disease Stage | Target Gene | RSS | Regulon Activity |
| ∗The dot plots of a searched regulon are shown for all cell subpopulations in each disease state of each tissue based on the regulon specific score inferred using pySCENIC and by calculating the average expression. |
| Page: 1 |
Top |
Somatic mutation of malignant transformation related genes |
| Annotation of somatic variants for genes involved in malignant transformation |
| Hugo Symbol | Variant Class | Variant Classification | dbSNP RS | HGVSc | HGVSp | HGVSp Short | SWISSPROT | BIOTYPE | SIFT | PolyPhen | Tumor Sample Barcode | Tissue | Histology | Sex | Age | Stage | Therapy Types | Drugs | Outcome |
| CTPS1 | SNV | Missense_Mutation | c.171N>T | p.Glu57Asp | p.E57D | P17812 | protein_coding | deleterious(0) | probably_damaging(1) | TCGA-A8-A09Z-01 | Breast | breast invasive carcinoma | Female | >=65 | I/II | Unknown | Unknown | SD | |
| CTPS1 | SNV | Missense_Mutation | c.709G>A | p.Glu237Lys | p.E237K | P17812 | protein_coding | tolerated(0.31) | benign(0.049) | TCGA-AC-A23H-01 | Breast | breast invasive carcinoma | Female | >=65 | I/II | Unknown | Unknown | PD | |
| CTPS1 | SNV | Missense_Mutation | novel | c.1308G>T | p.Met436Ile | p.M436I | P17812 | protein_coding | deleterious(0.01) | possibly_damaging(0.849) | TCGA-AC-A3W6-01 | Breast | breast invasive carcinoma | Female | >=65 | III/IV | Unknown | Unknown | SD |
| CTPS1 | SNV | Missense_Mutation | c.1361G>A | p.Arg454Lys | p.R454K | P17812 | protein_coding | tolerated(0.3) | benign(0.007) | TCGA-D8-A1JJ-01 | Breast | breast invasive carcinoma | Female | <65 | I/II | Chemotherapy | doxorubicine | SD | |
| CTPS1 | SNV | Missense_Mutation | c.838A>G | p.Lys280Glu | p.K280E | P17812 | protein_coding | tolerated(0.5) | benign(0.003) | TCGA-AA-3510-01 | Colorectum | colon adenocarcinoma | Male | >=65 | I/II | Unknown | Unknown | SD | |
| CTPS1 | SNV | Missense_Mutation | c.907N>A | p.Leu303Ile | p.L303I | P17812 | protein_coding | tolerated(0.14) | benign(0.073) | TCGA-AA-3715-01 | Colorectum | colon adenocarcinoma | Male | >=65 | I/II | Unknown | Unknown | PD | |
| CTPS1 | SNV | Missense_Mutation | c.519N>T | p.Glu173Asp | p.E173D | P17812 | protein_coding | tolerated(0.34) | benign(0.042) | TCGA-AA-A010-01 | Colorectum | colon adenocarcinoma | Female | <65 | I/II | Chemotherapy | folinic | CR | |
| CTPS1 | SNV | Missense_Mutation | c.1150N>T | p.Ala384Ser | p.A384S | P17812 | protein_coding | deleterious(0.03) | probably_damaging(0.987) | TCGA-AA-A010-01 | Colorectum | colon adenocarcinoma | Female | <65 | I/II | Chemotherapy | folinic | CR | |
| CTPS1 | SNV | Missense_Mutation | rs759359795 | c.1058G>A | p.Arg353His | p.R353H | P17812 | protein_coding | deleterious(0.02) | possibly_damaging(0.631) | TCGA-AZ-4315-01 | Colorectum | colon adenocarcinoma | Male | <65 | I/II | Unknown | Unknown | SD |
| CTPS1 | SNV | Missense_Mutation | rs756273124 | c.1156N>A | p.Ala386Thr | p.A386T | P17812 | protein_coding | tolerated(0.12) | benign(0.001) | TCGA-NH-A5IV-01 | Colorectum | colon adenocarcinoma | Female | >=65 | I/II | Unknown | Unknown | SD |
| Page: 1 2 3 4 5 6 7 8 |
Top |
Related drugs of malignant transformation related genes |
| Identification of chemicals and drugs interact with genes involved in malignant transfromation |
| (DGIdb 4.0) |
| Entrez ID | Symbol | Category | Interaction Types | Drug Claim Name | Drug Name | PMIDs |
| 1503 | CTPS1 | ENZYME | Cyclopentenylcytosine |
| Page: 1 |

Copyright 2023-Present -The University of Texas Health Science Center at Houston |