
|
|||||
|
 | |
| |
| |
| |
| |
| |
|
Gene: CSNK2A2 |
Gene summary for CSNK2A2 |
| Gene information | Species | Human | Gene symbol | CSNK2A2 | Gene ID | 1459 |
| Gene name | casein kinase 2 alpha 2 | |
| Gene Alias | CK2A2 | |
| Cytomap | 16q21 | |
| Gene Type | protein-coding | GO ID | GO:0000003 | UniProtAcc | P19784 |
Top |
Malignant transformation analysis |
| Identification of the aberrant gene expression in precancerous and cancerous lesions by comparing the gene expression of stem-like cells in diseased tissues with normal stem cells |
| Entrez ID | Symbol | Replicates | Species | Organ | Tissue | Adj P-value | Log2FC | Malignancy |
| 1459 | CSNK2A2 | HCC1_Meng | Human | Liver | HCC | 6.95e-53 | 3.47e-02 | 0.0246 |
| 1459 | CSNK2A2 | HCC2_Meng | Human | Liver | HCC | 2.43e-16 | 7.27e-02 | 0.0107 |
| 1459 | CSNK2A2 | HCC2 | Human | Liver | HCC | 4.82e-04 | 2.87e+00 | 0.5341 |
| 1459 | CSNK2A2 | S014 | Human | Liver | HCC | 8.31e-03 | 2.01e-01 | 0.2254 |
| 1459 | CSNK2A2 | S015 | Human | Liver | HCC | 4.85e-04 | 3.78e-01 | 0.2375 |
| 1459 | CSNK2A2 | S027 | Human | Liver | HCC | 5.94e-04 | 6.40e-01 | 0.2446 |
| 1459 | CSNK2A2 | S028 | Human | Liver | HCC | 3.69e-13 | 5.73e-01 | 0.2503 |
| 1459 | CSNK2A2 | S029 | Human | Liver | HCC | 9.22e-08 | 5.32e-01 | 0.2581 |
| 1459 | CSNK2A2 | C04 | Human | Oral cavity | OSCC | 3.90e-12 | 7.80e-01 | 0.2633 |
| 1459 | CSNK2A2 | C21 | Human | Oral cavity | OSCC | 1.20e-27 | 7.37e-01 | 0.2678 |
| 1459 | CSNK2A2 | C30 | Human | Oral cavity | OSCC | 3.23e-35 | 1.19e+00 | 0.3055 |
| 1459 | CSNK2A2 | C51 | Human | Oral cavity | OSCC | 6.88e-09 | 5.09e-01 | 0.2674 |
| 1459 | CSNK2A2 | C57 | Human | Oral cavity | OSCC | 2.75e-08 | 1.60e-01 | 0.1679 |
| 1459 | CSNK2A2 | C06 | Human | Oral cavity | OSCC | 5.39e-05 | 9.16e-01 | 0.2699 |
| 1459 | CSNK2A2 | C08 | Human | Oral cavity | OSCC | 1.07e-14 | 2.98e-01 | 0.1919 |
| 1459 | CSNK2A2 | LN22 | Human | Oral cavity | OSCC | 2.85e-02 | 3.43e-01 | 0.1733 |
| 1459 | CSNK2A2 | LN46 | Human | Oral cavity | OSCC | 4.98e-05 | 1.27e-01 | 0.1666 |
| 1459 | CSNK2A2 | SYSMH1 | Human | Oral cavity | OSCC | 3.71e-24 | 4.07e-01 | 0.1127 |
| 1459 | CSNK2A2 | SYSMH2 | Human | Oral cavity | OSCC | 2.04e-28 | 6.24e-01 | 0.2326 |
| 1459 | CSNK2A2 | SYSMH3 | Human | Oral cavity | OSCC | 4.62e-27 | 6.37e-01 | 0.2442 |
| Page: 1 2 3 |
| Tissue | Expression Dynamics | Abbreviation |
| Liver |  | HCC: Hepatocellular carcinoma |
| NAFLD: Non-alcoholic fatty liver disease | ||
| Oral Cavity | 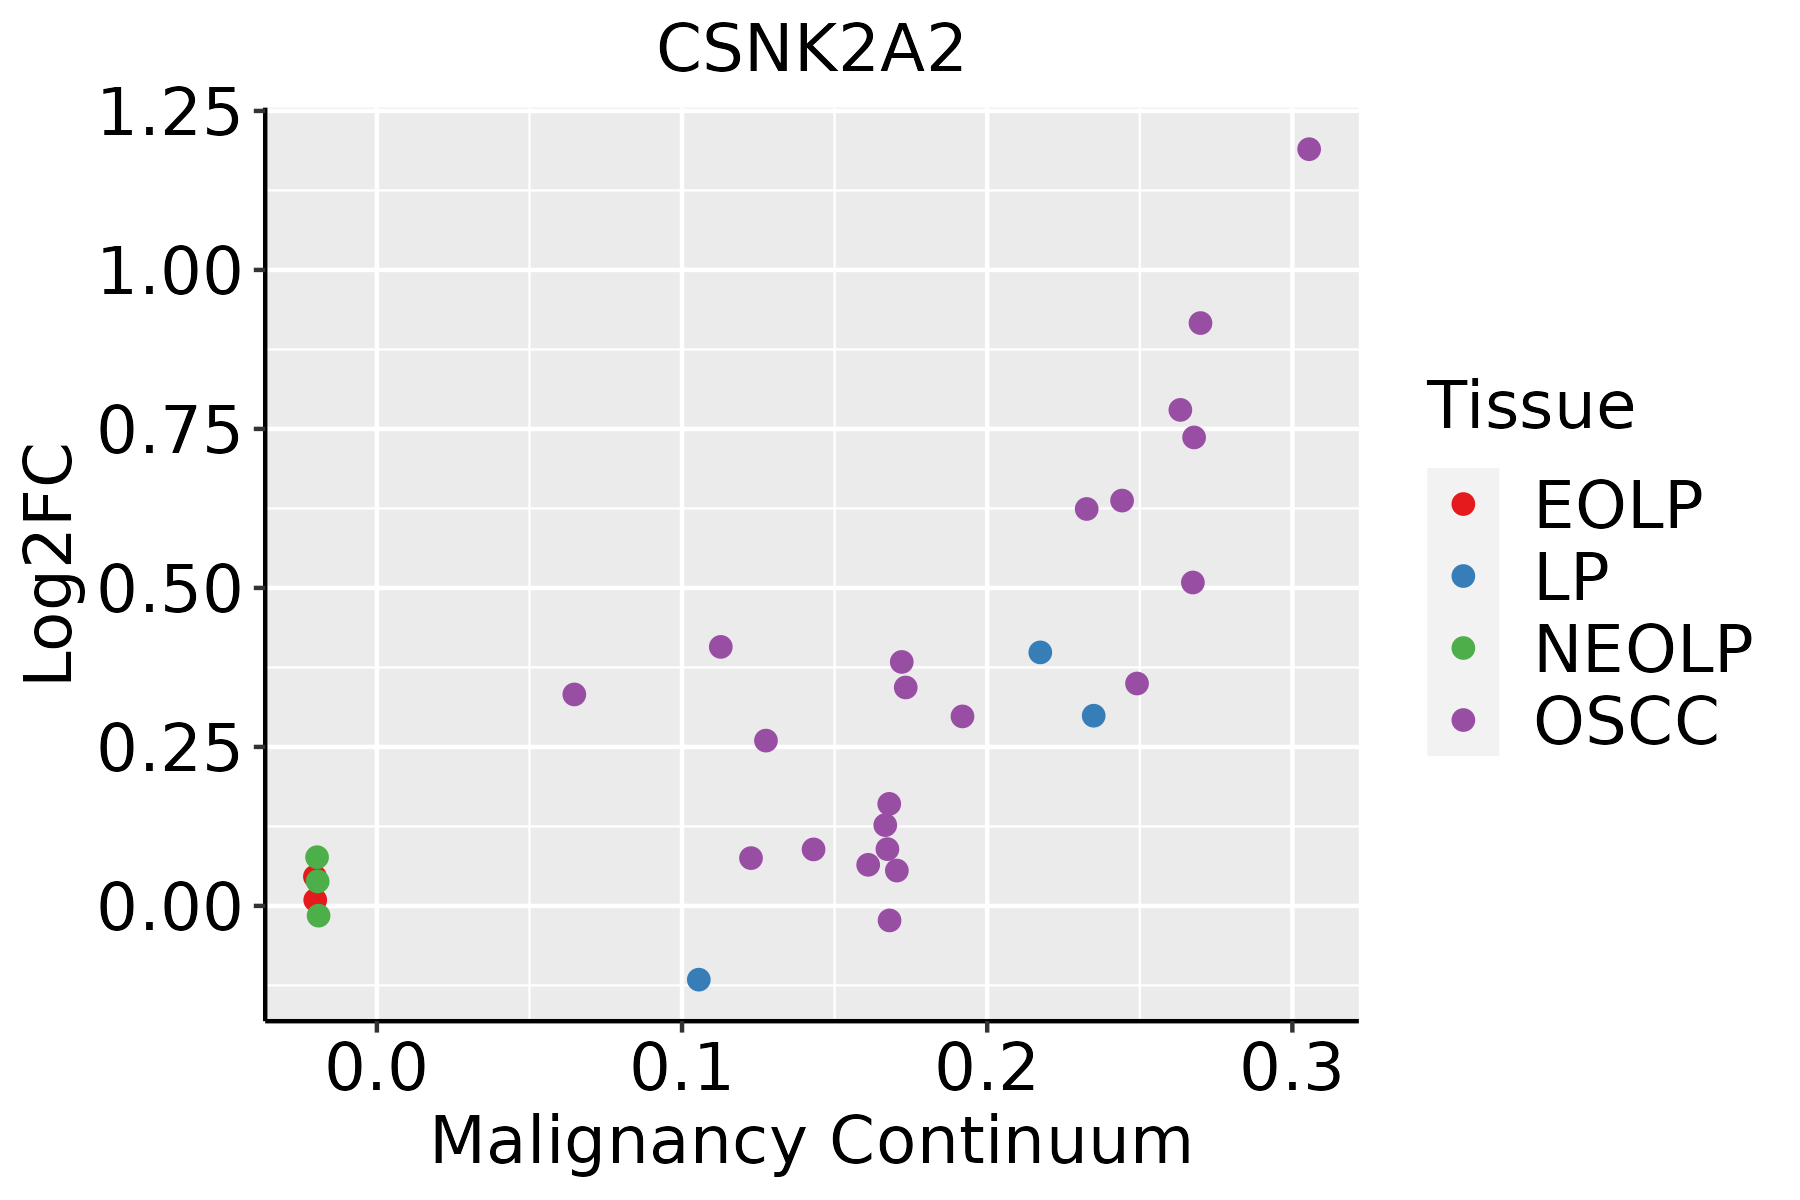 | EOLP: Erosive Oral lichen planus |
| LP: leukoplakia | ||
| NEOLP: Non-erosive oral lichen planus | ||
| OSCC: Oral squamous cell carcinoma | ||
| Prostate | 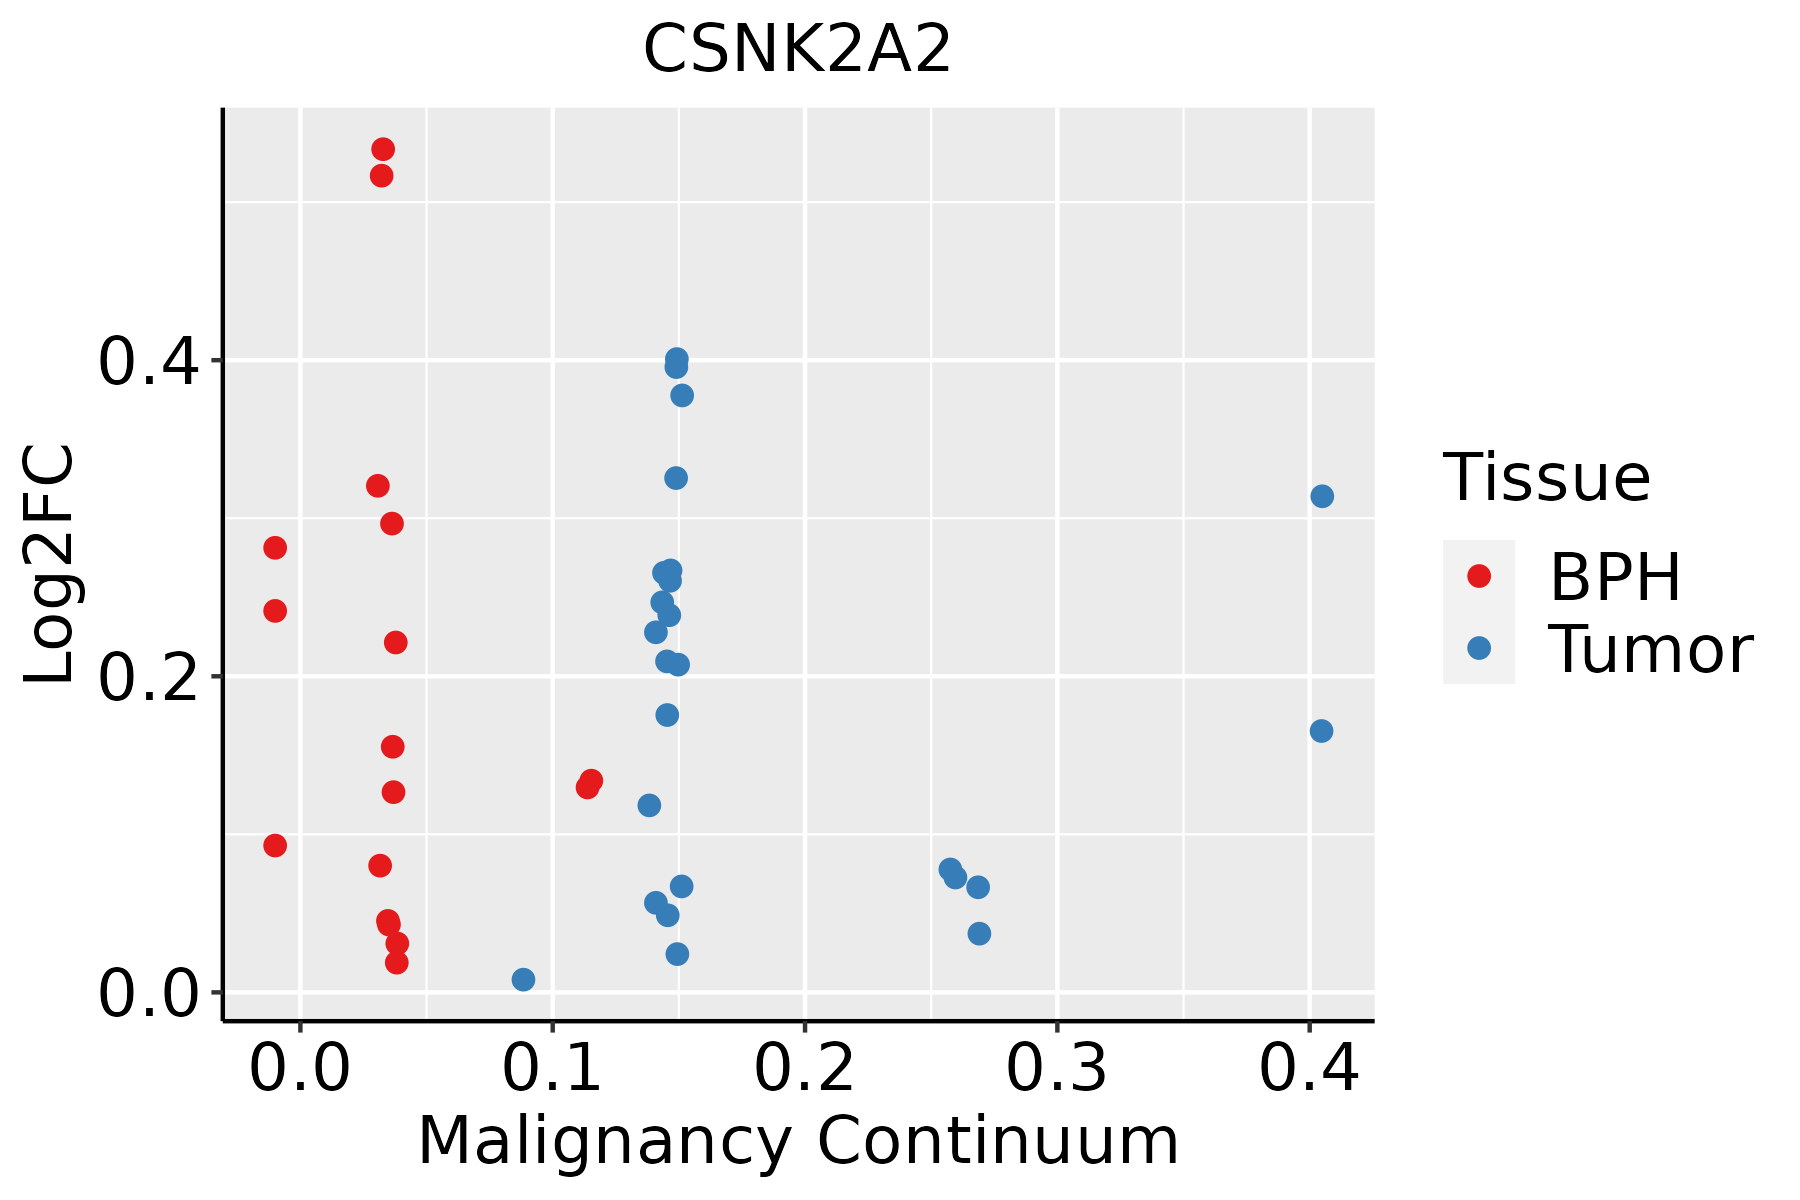 | BPH: Benign Prostatic Hyperplasia |
| Thyroid | 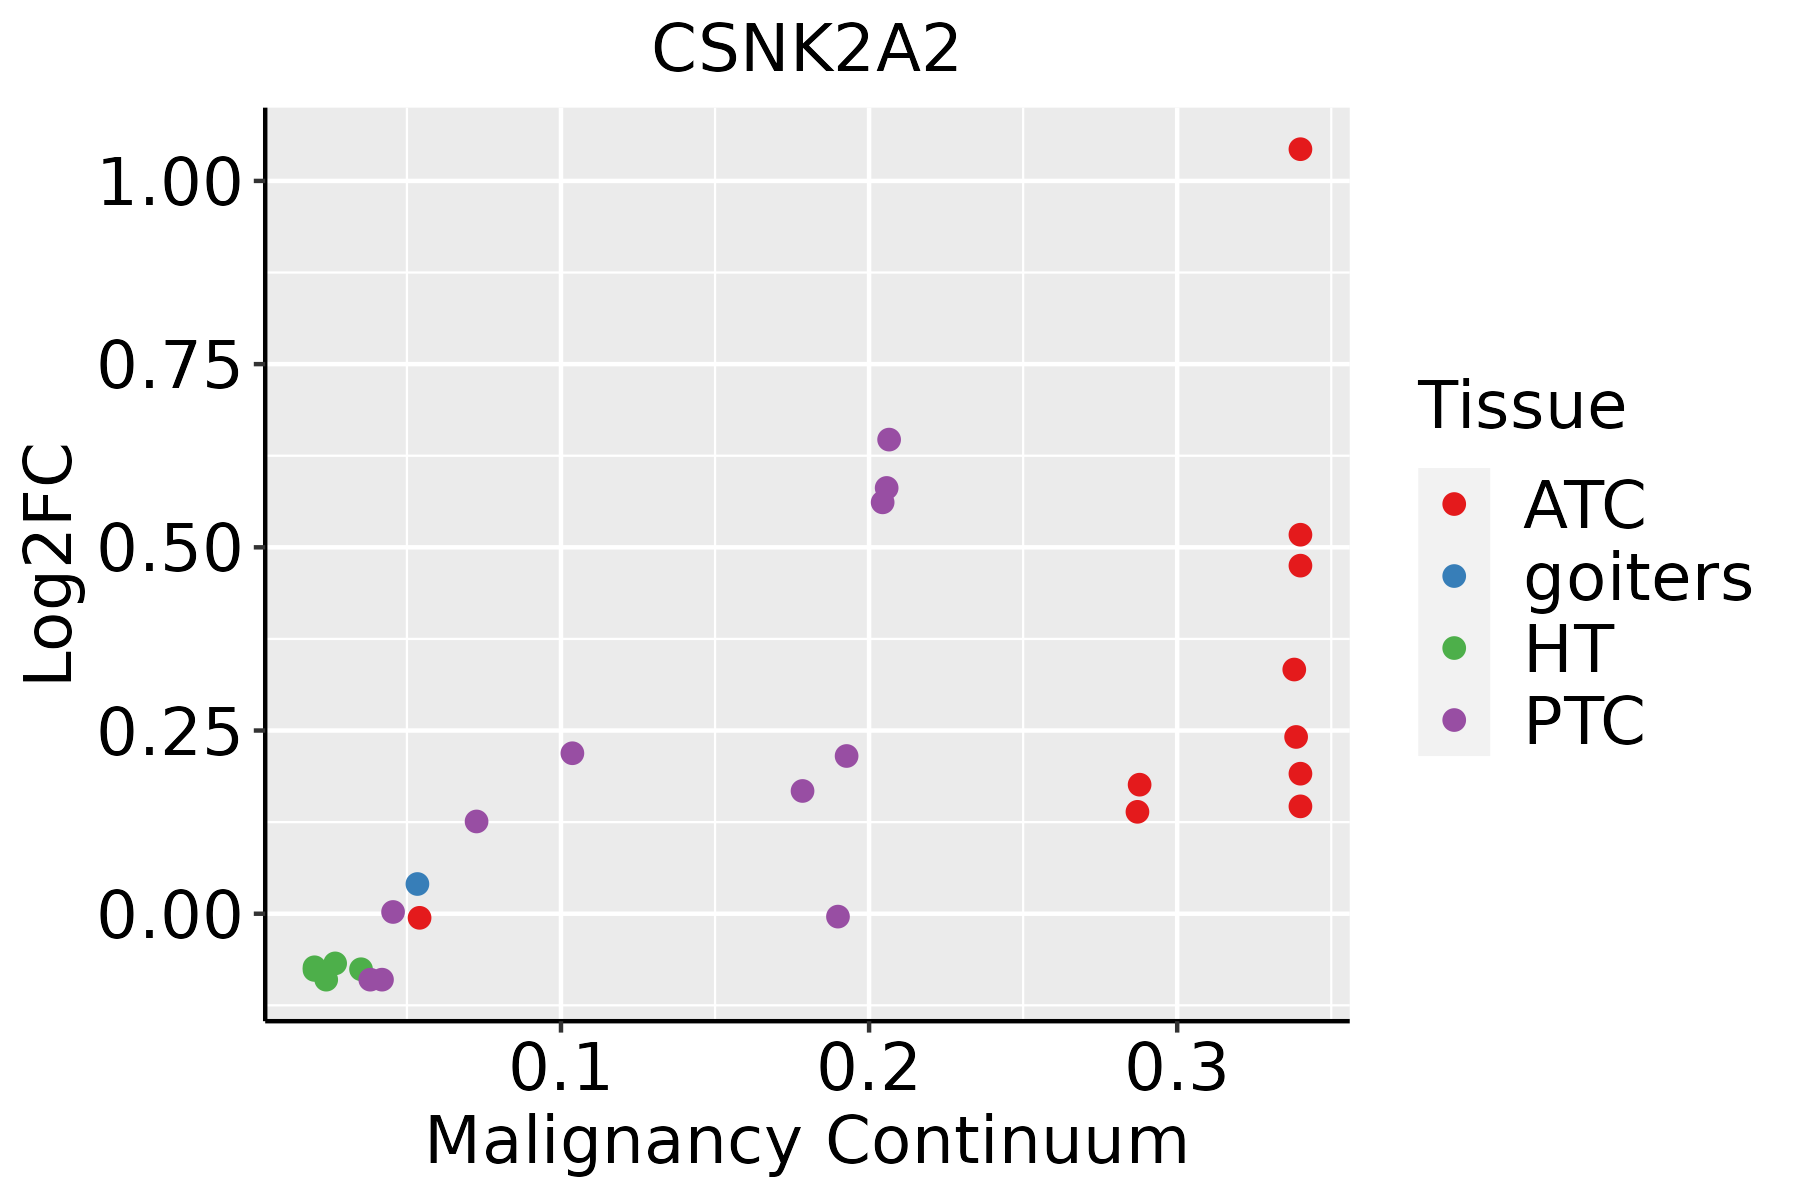 | ATC: Anaplastic thyroid cancer |
| HT: Hashimoto's thyroiditis | ||
| PTC: Papillary thyroid cancer |
| ∗log2FC in expression of this searched gene in stem-like cells from each diseased tissue sample relative to stem-like cells in normal samples in each tissue plotted against the malignancy continuum. Samples are colored based on if they are from different disease stage. |
Top |
Malignant transformation related pathway analysis |
| Find out the enriched GO biological processes and KEGG pathways involved in transition from healthy to precancer to cancer |
| Tissue | Disease Stage | Enriched GO biological Processes |
| Colorectum | AD |  |
| Colorectum | SER |  |
| Colorectum | MSS |  |
| Colorectum | MSI-H |  |
| Colorectum | FAP |  |
| ∗Top 15 enriched GO BP terms are showed in the bar plot of each disease state in each tissue. Each row represents a significant GO biological process which is colored according to the -log10(p.adjust). |
| Page: 1 2 3 4 5 6 7 8 9 |
| GO ID | Tissue | Disease Stage | Description | Gene Ratio | Bg Ratio | pvalue | p.adjust | Count |
| GO:000188922 | Liver | HCC | liver development | 108/7958 | 147/18723 | 2.16e-14 | 1.41e-12 | 108 |
| GO:005122222 | Liver | HCC | positive regulation of protein transport | 194/7958 | 303/18723 | 2.41e-14 | 1.56e-12 | 194 |
| GO:006100822 | Liver | HCC | hepaticobiliary system development | 109/7958 | 150/18723 | 5.72e-14 | 3.42e-12 | 109 |
| GO:000989522 | Liver | HCC | negative regulation of catabolic process | 196/7958 | 320/18723 | 7.98e-12 | 3.35e-10 | 196 |
| GO:200123412 | Liver | HCC | negative regulation of apoptotic signaling pathway | 145/7958 | 224/18723 | 1.33e-11 | 5.36e-10 | 145 |
| GO:000042211 | Liver | HCC | autophagy of mitochondrion | 64/7958 | 81/18723 | 1.96e-11 | 7.72e-10 | 64 |
| GO:006172611 | Liver | HCC | mitochondrion disassembly | 64/7958 | 81/18723 | 1.96e-11 | 7.72e-10 | 64 |
| GO:003133022 | Liver | HCC | negative regulation of cellular catabolic process | 164/7958 | 262/18723 | 3.52e-11 | 1.35e-09 | 164 |
| GO:190374911 | Liver | HCC | positive regulation of establishment of protein localization to mitochondrion | 33/7958 | 36/18723 | 7.67e-10 | 2.37e-08 | 33 |
| GO:19039551 | Liver | HCC | positive regulation of protein targeting to mitochondrion | 30/7958 | 32/18723 | 1.19e-09 | 3.58e-08 | 30 |
| GO:001082112 | Liver | HCC | regulation of mitochondrion organization | 96/7958 | 144/18723 | 3.82e-09 | 1.02e-07 | 96 |
| GO:190353311 | Liver | HCC | regulation of protein targeting | 60/7958 | 81/18723 | 7.70e-09 | 1.94e-07 | 60 |
| GO:190374711 | Liver | HCC | regulation of establishment of protein localization to mitochondrion | 41/7958 | 50/18723 | 1.14e-08 | 2.83e-07 | 41 |
| GO:019873821 | Liver | HCC | cell-cell signaling by wnt | 247/7958 | 446/18723 | 2.11e-08 | 4.96e-07 | 247 |
| GO:004873222 | Liver | HCC | gland development | 242/7958 | 436/18723 | 2.26e-08 | 5.28e-07 | 242 |
| GO:0007059 | Liver | HCC | chromosome segregation | 197/7958 | 346/18723 | 3.57e-08 | 7.87e-07 | 197 |
| GO:001605521 | Liver | HCC | Wnt signaling pathway | 245/7958 | 444/18723 | 3.68e-08 | 8.09e-07 | 245 |
| GO:190321411 | Liver | HCC | regulation of protein targeting to mitochondrion | 36/7958 | 44/18723 | 1.02e-07 | 1.98e-06 | 36 |
| GO:003110021 | Liver | HCC | animal organ regeneration | 54/7958 | 76/18723 | 4.31e-07 | 7.22e-06 | 54 |
| GO:190314611 | Liver | HCC | regulation of autophagy of mitochondrion | 28/7958 | 33/18723 | 6.57e-07 | 1.03e-05 | 28 |
| Page: 1 2 3 4 5 6 7 8 9 10 11 12 13 14 15 16 17 |
| Pathway ID | Tissue | Disease Stage | Description | Gene Ratio | Bg Ratio | pvalue | p.adjust | qvalue | Count |
| hsa0502022 | Liver | HCC | Prion disease | 195/4020 | 273/8465 | 3.26e-16 | 1.56e-14 | 8.67e-15 | 195 |
| hsa0501022 | Liver | HCC | Alzheimer disease | 254/4020 | 384/8465 | 3.75e-14 | 8.97e-13 | 4.99e-13 | 254 |
| hsa0502222 | Liver | HCC | Pathways of neurodegeneration - multiple diseases | 298/4020 | 476/8465 | 6.59e-12 | 1.30e-10 | 7.22e-11 | 298 |
| hsa0452042 | Liver | HCC | Adherens junction | 68/4020 | 93/8465 | 3.99e-07 | 4.46e-06 | 2.48e-06 | 68 |
| hsa0413741 | Liver | HCC | Mitophagy - animal | 53/4020 | 72/8465 | 5.49e-06 | 4.59e-05 | 2.56e-05 | 53 |
| hsa0502032 | Liver | HCC | Prion disease | 195/4020 | 273/8465 | 3.26e-16 | 1.56e-14 | 8.67e-15 | 195 |
| hsa0501032 | Liver | HCC | Alzheimer disease | 254/4020 | 384/8465 | 3.75e-14 | 8.97e-13 | 4.99e-13 | 254 |
| hsa0502232 | Liver | HCC | Pathways of neurodegeneration - multiple diseases | 298/4020 | 476/8465 | 6.59e-12 | 1.30e-10 | 7.22e-11 | 298 |
| hsa0452052 | Liver | HCC | Adherens junction | 68/4020 | 93/8465 | 3.99e-07 | 4.46e-06 | 2.48e-06 | 68 |
| hsa0413751 | Liver | HCC | Mitophagy - animal | 53/4020 | 72/8465 | 5.49e-06 | 4.59e-05 | 2.56e-05 | 53 |
| hsa0501028 | Oral cavity | OSCC | Alzheimer disease | 244/3704 | 384/8465 | 1.18e-15 | 3.60e-14 | 1.83e-14 | 244 |
| hsa0502228 | Oral cavity | OSCC | Pathways of neurodegeneration - multiple diseases | 292/3704 | 476/8465 | 1.60e-15 | 4.47e-14 | 2.28e-14 | 292 |
| hsa0502028 | Oral cavity | OSCC | Prion disease | 181/3704 | 273/8465 | 2.05e-14 | 5.30e-13 | 2.70e-13 | 181 |
| hsa0413728 | Oral cavity | OSCC | Mitophagy - animal | 58/3704 | 72/8465 | 1.48e-10 | 2.07e-09 | 1.05e-09 | 58 |
| hsa051628 | Oral cavity | OSCC | Measles | 90/3704 | 139/8465 | 4.10e-07 | 2.50e-06 | 1.27e-06 | 90 |
| hsa0452029 | Oral cavity | OSCC | Adherens junction | 62/3704 | 93/8465 | 6.34e-06 | 3.12e-05 | 1.59e-05 | 62 |
| hsa040644 | Oral cavity | OSCC | NF-kappa B signaling pathway | 67/3704 | 104/8465 | 1.57e-05 | 6.75e-05 | 3.44e-05 | 67 |
| hsa05235 | Oral cavity | OSCC | PD-L1 expression and PD-1 checkpoint pathway in cancer | 56/3704 | 89/8465 | 1.97e-04 | 6.55e-04 | 3.33e-04 | 56 |
| hsa05010112 | Oral cavity | OSCC | Alzheimer disease | 244/3704 | 384/8465 | 1.18e-15 | 3.60e-14 | 1.83e-14 | 244 |
| hsa05022112 | Oral cavity | OSCC | Pathways of neurodegeneration - multiple diseases | 292/3704 | 476/8465 | 1.60e-15 | 4.47e-14 | 2.28e-14 | 292 |
| Page: 1 2 3 |
Top |
Cell-cell communication analysis |
| Identification of potential cell-cell interactions between two cell types and their ligand-receptor pairs for different disease states |
| Ligand | Receptor | LRpair | Pathway | Tissue | Disease Stage |
| Page: 1 |
Top |
Single-cell gene regulatory network inference analysis |
| Find out the significant the regulons (TFs) and the target genes of each regulon across cell types for different disease states |
| TF | Cell Type | Tissue | Disease Stage | Target Gene | RSS | Regulon Activity |
| ∗The dot plots of a searched regulon are shown for all cell subpopulations in each disease state of each tissue based on the regulon specific score inferred using pySCENIC and by calculating the average expression. |
| Page: 1 |
Top |
Somatic mutation of malignant transformation related genes |
| Annotation of somatic variants for genes involved in malignant transformation |
| Hugo Symbol | Variant Class | Variant Classification | dbSNP RS | HGVSc | HGVSp | HGVSp Short | SWISSPROT | BIOTYPE | SIFT | PolyPhen | Tumor Sample Barcode | Tissue | Histology | Sex | Age | Stage | Therapy Types | Drugs | Outcome |
| CSNK2A2 | SNV | Missense_Mutation | c.734G>C | p.Arg245Pro | p.R245P | P19784 | protein_coding | deleterious(0) | probably_damaging(0.974) | TCGA-A8-A09T-01 | Breast | breast invasive carcinoma | Female | >=65 | I/II | Hormone Therapy | anastrozole | SD | |
| CSNK2A2 | SNV | Missense_Mutation | c.700N>A | p.Phe234Ile | p.F234I | P19784 | protein_coding | deleterious(0) | probably_damaging(1) | TCGA-D8-A13Y-01 | Breast | breast invasive carcinoma | Female | <65 | I/II | Chemotherapy | doxorubicin | SD | |
| CSNK2A2 | deletion | Frame_Shift_Del | novel | c.176delA | p.Asn59IlefsTer10 | p.N59Ifs*10 | P19784 | protein_coding | TCGA-EW-A2FV-01 | Breast | breast invasive carcinoma | Female | <65 | III/IV | Chemotherapy | docetaxel | SD | ||
| CSNK2A2 | SNV | Missense_Mutation | novel | c.938G>C | p.Arg313Thr | p.R313T | P19784 | protein_coding | deleterious(0) | probably_damaging(1) | TCGA-VS-A8EC-01 | Cervix | cervical & endocervical cancer | Female | <65 | III/IV | Chemotherapy | carboplatin | CR |
| CSNK2A2 | SNV | Missense_Mutation | c.533N>A | p.Gly178Asp | p.G178D | P19784 | protein_coding | deleterious(0) | probably_damaging(1) | TCGA-AA-3693-01 | Colorectum | colon adenocarcinoma | Female | >=65 | III/IV | Unknown | Unknown | SD | |
| CSNK2A2 | SNV | Missense_Mutation | c.128N>C | p.Val43Ala | p.V43A | P19784 | protein_coding | deleterious(0.02) | benign(0.02) | TCGA-AA-3715-01 | Colorectum | colon adenocarcinoma | Male | >=65 | I/II | Unknown | Unknown | PD | |
| CSNK2A2 | SNV | Missense_Mutation | c.860N>T | p.His287Leu | p.H287L | P19784 | protein_coding | deleterious(0.01) | benign(0.011) | TCGA-AA-3811-01 | Colorectum | colon adenocarcinoma | Female | >=65 | III/IV | Unknown | Unknown | PD | |
| CSNK2A2 | SNV | Missense_Mutation | novel | c.100N>C | p.Trp34Arg | p.W34R | P19784 | protein_coding | deleterious(0) | benign(0.072) | TCGA-AA-A022-01 | Colorectum | colon adenocarcinoma | Female | >=65 | I/II | Unknown | Unknown | SD |
| CSNK2A2 | SNV | Missense_Mutation | c.403N>T | p.Arg135Trp | p.R135W | P19784 | protein_coding | deleterious(0) | possibly_damaging(0.855) | TCGA-AA-A02R-01 | Colorectum | colon adenocarcinoma | Female | >=65 | I/II | Unknown | Unknown | PD | |
| CSNK2A2 | SNV | Missense_Mutation | novel | c.163T>G | p.Phe55Val | p.F55V | P19784 | protein_coding | deleterious(0) | probably_damaging(0.997) | TCGA-CA-6717-01 | Colorectum | colon adenocarcinoma | Male | <65 | I/II | Chemotherapy | oxaliplatin | CR |
| Page: 1 2 3 4 5 |
Top |
Related drugs of malignant transformation related genes |
| Identification of chemicals and drugs interact with genes involved in malignant transfromation |
| (DGIdb 4.0) |
| Entrez ID | Symbol | Category | Interaction Types | Drug Claim Name | Drug Name | PMIDs |
| 1459 | CSNK2A2 | DRUGGABLE GENOME, KINASE, SERINE THREONINE KINASE, TUMOR SUPPRESSOR, ENZYME, TRANSCRIPTION FACTOR | US8791257, 17 | |||
| 1459 | CSNK2A2 | DRUGGABLE GENOME, KINASE, SERINE THREONINE KINASE, TUMOR SUPPRESSOR, ENZYME, TRANSCRIPTION FACTOR | US8940736, 23 | |||
| 1459 | CSNK2A2 | DRUGGABLE GENOME, KINASE, SERINE THREONINE KINASE, TUMOR SUPPRESSOR, ENZYME, TRANSCRIPTION FACTOR | inhibitor | HESPERADIN | HESPERADIN | 19035792 |
| 1459 | CSNK2A2 | DRUGGABLE GENOME, KINASE, SERINE THREONINE KINASE, TUMOR SUPPRESSOR, ENZYME, TRANSCRIPTION FACTOR | inhibitor | 249565806 | SILMITASERTIB | |
| 1459 | CSNK2A2 | DRUGGABLE GENOME, KINASE, SERINE THREONINE KINASE, TUMOR SUPPRESSOR, ENZYME, TRANSCRIPTION FACTOR | US8940736, 6 | |||
| 1459 | CSNK2A2 | DRUGGABLE GENOME, KINASE, SERINE THREONINE KINASE, TUMOR SUPPRESSOR, ENZYME, TRANSCRIPTION FACTOR | US8791257, 4 | |||
| 1459 | CSNK2A2 | DRUGGABLE GENOME, KINASE, SERINE THREONINE KINASE, TUMOR SUPPRESSOR, ENZYME, TRANSCRIPTION FACTOR | US8940736, 7 | |||
| 1459 | CSNK2A2 | DRUGGABLE GENOME, KINASE, SERINE THREONINE KINASE, TUMOR SUPPRESSOR, ENZYME, TRANSCRIPTION FACTOR | inhibitor | 249565820 | ||
| 1459 | CSNK2A2 | DRUGGABLE GENOME, KINASE, SERINE THREONINE KINASE, TUMOR SUPPRESSOR, ENZYME, TRANSCRIPTION FACTOR | US8791257, 38 |
| Page: 1 |

Copyright 2023-Present -The University of Texas Health Science Center at Houston |