
|
|||||
|
 | |
| |
| |
| |
| |
| |
|
Gene: CREB3L4 |
Gene summary for CREB3L4 |
| Gene information | Species | Human | Gene symbol | CREB3L4 | Gene ID | 148327 |
| Gene name | cAMP responsive element binding protein 3 like 4 | |
| Gene Alias | AIBZIP | |
| Cytomap | 1q21.3 | |
| Gene Type | protein-coding | GO ID | GO:0000003 | UniProtAcc | Q8TEY5 |
Top |
Malignant transformation analysis |
| Identification of the aberrant gene expression in precancerous and cancerous lesions by comparing the gene expression of stem-like cells in diseased tissues with normal stem cells |
| Entrez ID | Symbol | Replicates | Species | Organ | Tissue | Adj P-value | Log2FC | Malignancy |
| 148327 | CREB3L4 | GSM4909286 | Human | Breast | IDC | 1.79e-02 | 2.61e-02 | 0.1081 |
| 148327 | CREB3L4 | GSM4909290 | Human | Breast | IDC | 1.55e-03 | 2.64e-01 | 0.2096 |
| 148327 | CREB3L4 | GSM4909293 | Human | Breast | IDC | 2.06e-29 | 6.57e-01 | 0.1581 |
| 148327 | CREB3L4 | GSM4909294 | Human | Breast | IDC | 2.29e-04 | 3.91e-01 | 0.2022 |
| 148327 | CREB3L4 | GSM4909297 | Human | Breast | IDC | 2.27e-02 | 1.03e-01 | 0.1517 |
| 148327 | CREB3L4 | GSM4909298 | Human | Breast | IDC | 8.66e-11 | 4.37e-01 | 0.1551 |
| 148327 | CREB3L4 | GSM4909302 | Human | Breast | IDC | 2.49e-02 | 2.34e-01 | 0.1545 |
| 148327 | CREB3L4 | GSM4909304 | Human | Breast | IDC | 3.92e-03 | 3.80e-01 | 0.1636 |
| 148327 | CREB3L4 | GSM4909306 | Human | Breast | IDC | 8.71e-09 | 4.46e-01 | 0.1564 |
| 148327 | CREB3L4 | GSM4909308 | Human | Breast | IDC | 2.74e-14 | 4.32e-01 | 0.158 |
| 148327 | CREB3L4 | GSM4909311 | Human | Breast | IDC | 1.24e-06 | 3.37e-02 | 0.1534 |
| 148327 | CREB3L4 | GSM4909312 | Human | Breast | IDC | 4.93e-06 | 4.85e-01 | 0.1552 |
| 148327 | CREB3L4 | GSM4909317 | Human | Breast | IDC | 2.74e-03 | 2.14e-01 | 0.1355 |
| 148327 | CREB3L4 | GSM4909319 | Human | Breast | IDC | 2.45e-13 | 1.31e-01 | 0.1563 |
| 148327 | CREB3L4 | GSM4909321 | Human | Breast | IDC | 5.90e-11 | 5.01e-01 | 0.1559 |
| 148327 | CREB3L4 | M1 | Human | Breast | IDC | 6.55e-07 | 3.17e-01 | 0.1577 |
| 148327 | CREB3L4 | M2 | Human | Breast | IDC | 1.94e-03 | 4.24e-01 | 0.21 |
| 148327 | CREB3L4 | DCIS2 | Human | Breast | DCIS | 2.17e-19 | -2.71e-02 | 0.0085 |
| 148327 | CREB3L4 | LZE22T | Human | Esophagus | ESCC | 5.54e-04 | 3.13e-01 | 0.068 |
| 148327 | CREB3L4 | LZE24T | Human | Esophagus | ESCC | 3.37e-10 | 2.28e-01 | 0.0596 |
| Page: 1 2 3 4 5 |
| Tissue | Expression Dynamics | Abbreviation |
| Breast |  | IDC: Invasive ductal carcinoma |
| DCIS: Ductal carcinoma in situ | ||
| Precancer(BRCA1-mut): Precancerous lesion from BRCA1 mutation carriers | ||
| Esophagus | 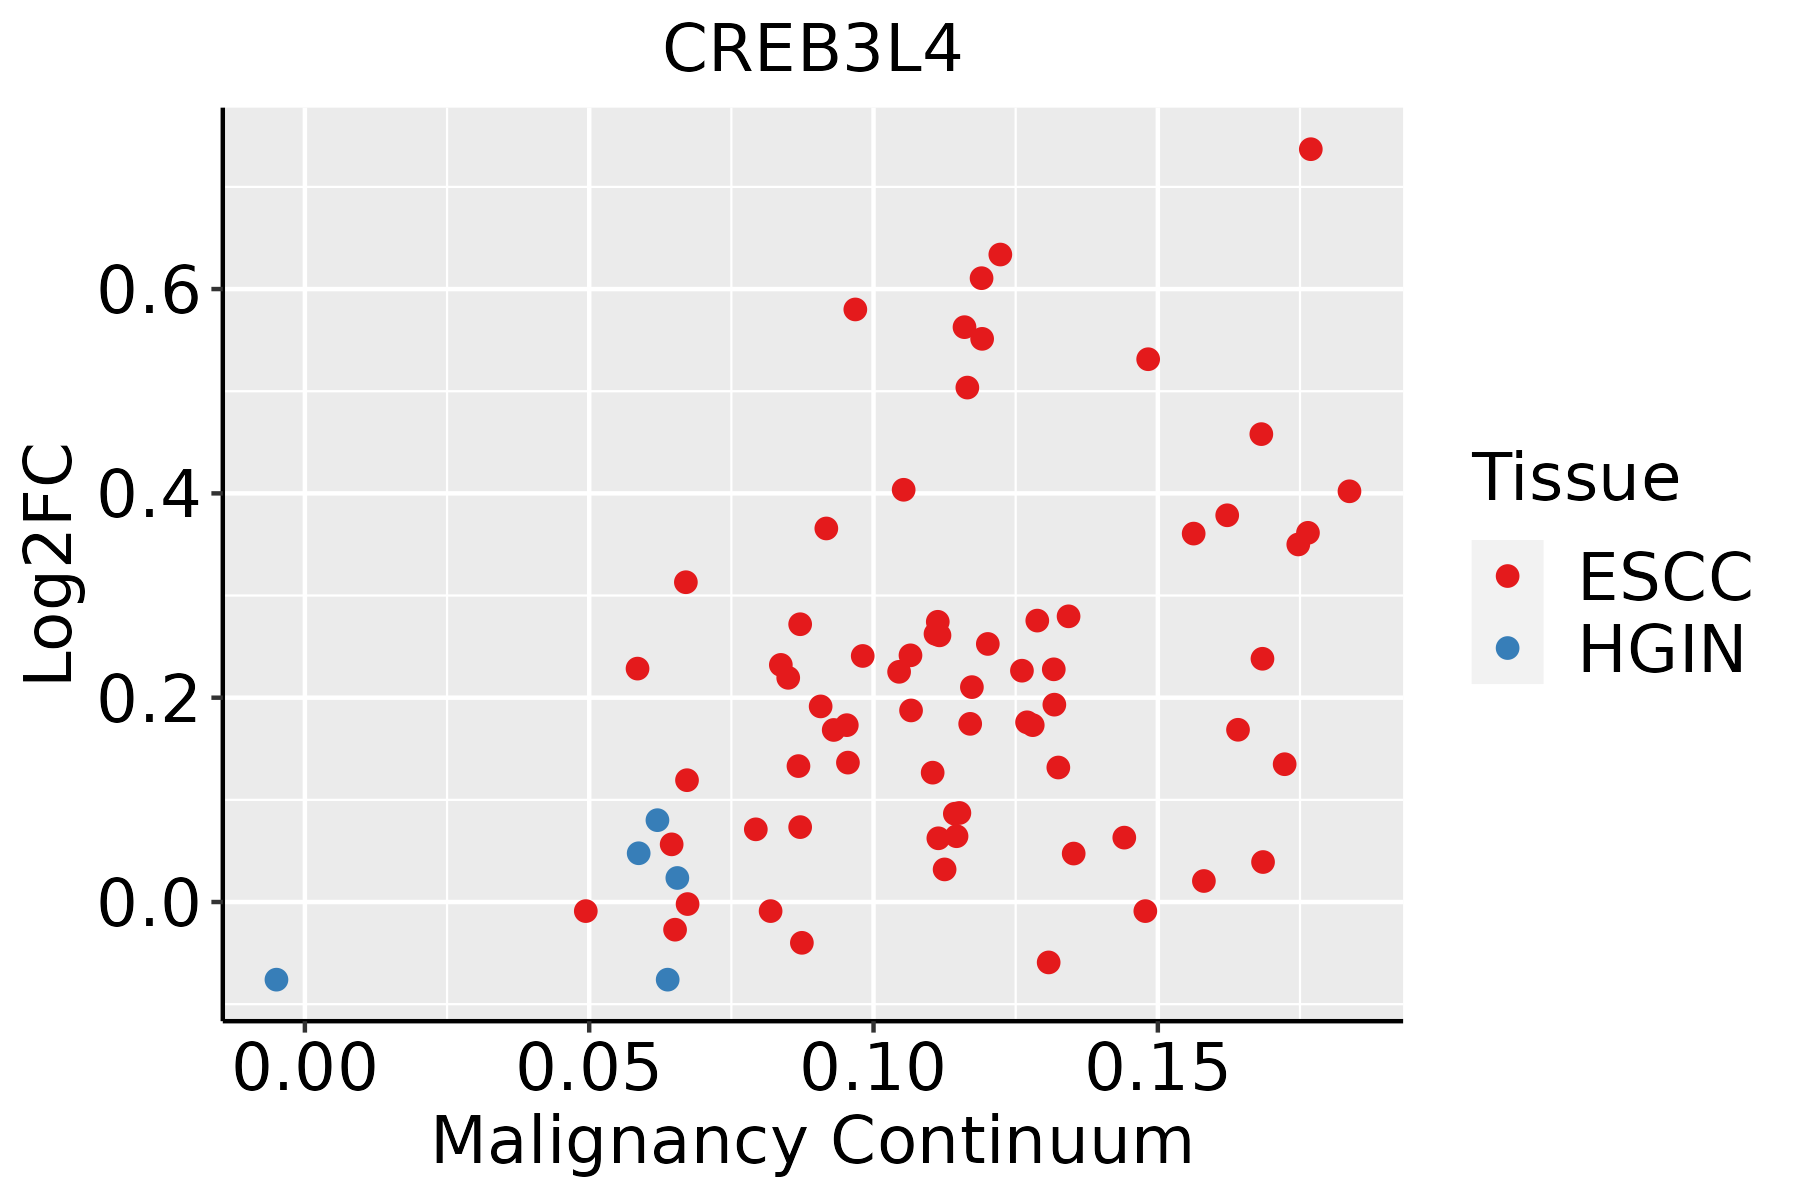 | ESCC: Esophageal squamous cell carcinoma |
| HGIN: High-grade intraepithelial neoplasias | ||
| LGIN: Low-grade intraepithelial neoplasias | ||
| Oral Cavity | 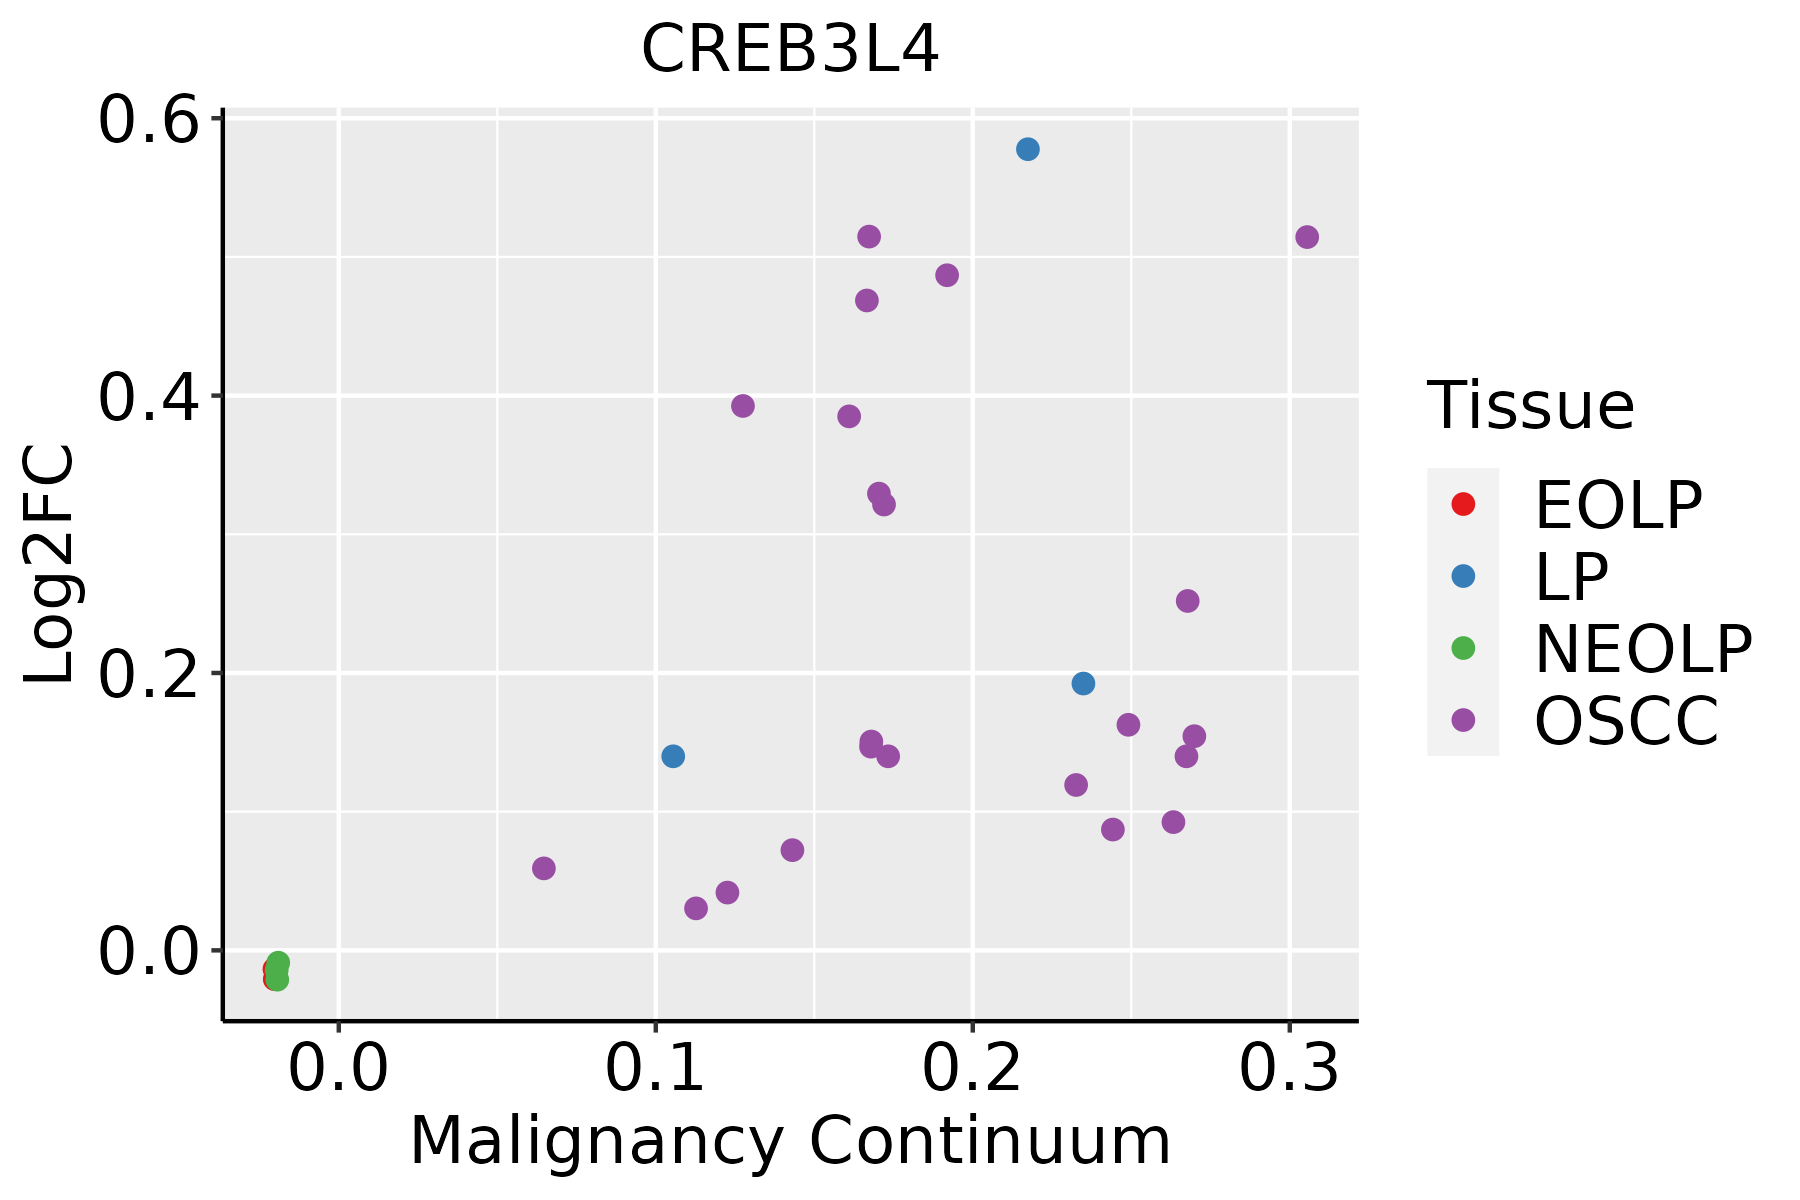 | EOLP: Erosive Oral lichen planus |
| LP: leukoplakia | ||
| NEOLP: Non-erosive oral lichen planus | ||
| OSCC: Oral squamous cell carcinoma | ||
| Prostate | 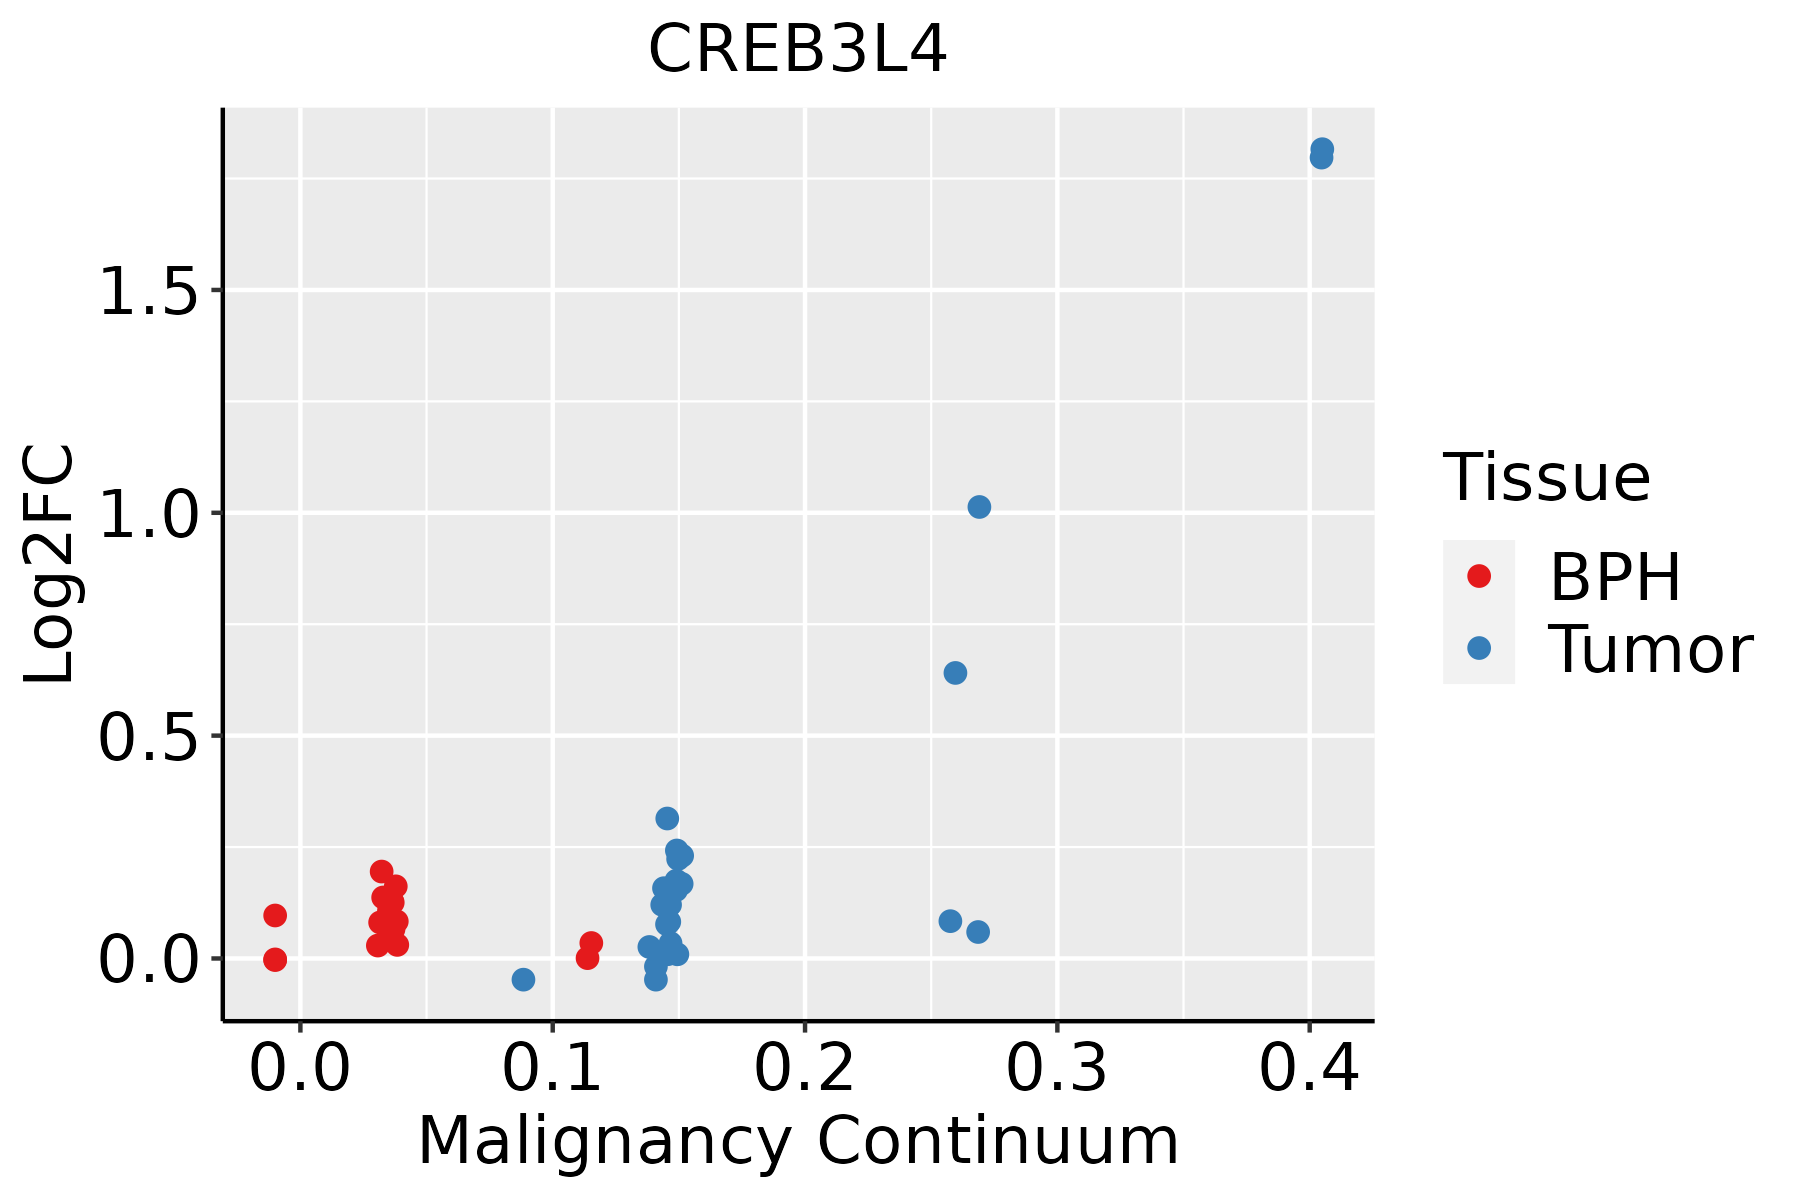 | BPH: Benign Prostatic Hyperplasia |
| ∗log2FC in expression of this searched gene in stem-like cells from each diseased tissue sample relative to stem-like cells in normal samples in each tissue plotted against the malignancy continuum. Samples are colored based on if they are from different disease stage. |
Top |
Malignant transformation related pathway analysis |
| Find out the enriched GO biological processes and KEGG pathways involved in transition from healthy to precancer to cancer |
| Tissue | Disease Stage | Enriched GO biological Processes |
| Colorectum | AD |  |
| Colorectum | SER |  |
| Colorectum | MSS |  |
| Colorectum | MSI-H |  |
| Colorectum | FAP |  |
| ∗Top 15 enriched GO BP terms are showed in the bar plot of each disease state in each tissue. Each row represents a significant GO biological process which is colored according to the -log10(p.adjust). |
| Page: 1 2 3 4 5 6 7 8 9 |
| GO ID | Tissue | Disease Stage | Description | Gene Ratio | Bg Ratio | pvalue | p.adjust | Count |
| GO:000698620 | Oral cavity | OSCC | response to unfolded protein | 103/7305 | 137/18723 | 6.47e-18 | 6.50e-16 | 103 |
| GO:003596720 | Oral cavity | OSCC | cellular response to topologically incorrect protein | 83/7305 | 116/18723 | 1.09e-12 | 4.84e-11 | 83 |
| GO:003462019 | Oral cavity | OSCC | cellular response to unfolded protein | 71/7305 | 96/18723 | 3.45e-12 | 1.35e-10 | 71 |
| GO:003096815 | Oral cavity | OSCC | endoplasmic reticulum unfolded protein response | 55/7305 | 74/18723 | 6.91e-10 | 1.75e-08 | 55 |
| GO:003497618 | Prostate | BPH | response to endoplasmic reticulum stress | 95/3107 | 256/18723 | 1.54e-15 | 2.52e-13 | 95 |
| GO:000698618 | Prostate | BPH | response to unfolded protein | 61/3107 | 137/18723 | 1.40e-14 | 1.80e-12 | 61 |
| GO:003596618 | Prostate | BPH | response to topologically incorrect protein | 66/3107 | 159/18723 | 7.35e-14 | 7.98e-12 | 66 |
| GO:003462017 | Prostate | BPH | cellular response to unfolded protein | 42/3107 | 96/18723 | 3.43e-10 | 1.81e-08 | 42 |
| GO:003596718 | Prostate | BPH | cellular response to topologically incorrect protein | 46/3107 | 116/18723 | 2.54e-09 | 1.01e-07 | 46 |
| GO:003096810 | Prostate | BPH | endoplasmic reticulum unfolded protein response | 33/3107 | 74/18723 | 1.47e-08 | 4.63e-07 | 33 |
| GO:000698619 | Prostate | Tumor | response to unfolded protein | 65/3246 | 137/18723 | 3.56e-16 | 7.50e-14 | 65 |
| GO:003497619 | Prostate | Tumor | response to endoplasmic reticulum stress | 97/3246 | 256/18723 | 2.92e-15 | 4.78e-13 | 97 |
| GO:003596619 | Prostate | Tumor | response to topologically incorrect protein | 69/3246 | 159/18723 | 1.28e-14 | 1.81e-12 | 69 |
| GO:003462018 | Prostate | Tumor | cellular response to unfolded protein | 46/3246 | 96/18723 | 4.68e-12 | 3.83e-10 | 46 |
| GO:003096814 | Prostate | Tumor | endoplasmic reticulum unfolded protein response | 37/3246 | 74/18723 | 1.19e-10 | 7.26e-09 | 37 |
| GO:003596719 | Prostate | Tumor | cellular response to topologically incorrect protein | 49/3246 | 116/18723 | 2.68e-10 | 1.48e-08 | 49 |
| Page: 1 2 |
| Pathway ID | Tissue | Disease Stage | Description | Gene Ratio | Bg Ratio | pvalue | p.adjust | qvalue | Count |
| hsa0502023 | Breast | IDC | Prion disease | 102/867 | 273/8465 | 3.70e-34 | 4.01e-32 | 3.00e-32 | 102 |
| hsa0501623 | Breast | IDC | Huntington disease | 103/867 | 306/8465 | 5.14e-30 | 4.17e-28 | 3.12e-28 | 103 |
| hsa0471424 | Breast | IDC | Thermogenesis | 75/867 | 232/8465 | 8.41e-21 | 3.04e-19 | 2.27e-19 | 75 |
| hsa0491523 | Breast | IDC | Estrogen signaling pathway | 35/867 | 138/8465 | 2.55e-07 | 5.18e-06 | 3.88e-06 | 35 |
| hsa050312 | Breast | IDC | Amphetamine addiction | 18/867 | 69/8465 | 1.42e-04 | 1.36e-03 | 1.01e-03 | 18 |
| hsa0516624 | Breast | IDC | Human T-cell leukemia virus 1 infection | 40/867 | 222/8465 | 2.52e-04 | 2.21e-03 | 1.66e-03 | 40 |
| hsa0516324 | Breast | IDC | Human cytomegalovirus infection | 39/867 | 225/8465 | 6.66e-04 | 5.41e-03 | 4.05e-03 | 39 |
| hsa0520322 | Breast | IDC | Viral carcinogenesis | 34/867 | 204/8465 | 2.82e-03 | 1.86e-02 | 1.39e-02 | 34 |
| hsa0502033 | Breast | IDC | Prion disease | 102/867 | 273/8465 | 3.70e-34 | 4.01e-32 | 3.00e-32 | 102 |
| hsa0501633 | Breast | IDC | Huntington disease | 103/867 | 306/8465 | 5.14e-30 | 4.17e-28 | 3.12e-28 | 103 |
| hsa0471434 | Breast | IDC | Thermogenesis | 75/867 | 232/8465 | 8.41e-21 | 3.04e-19 | 2.27e-19 | 75 |
| hsa0491533 | Breast | IDC | Estrogen signaling pathway | 35/867 | 138/8465 | 2.55e-07 | 5.18e-06 | 3.88e-06 | 35 |
| hsa050313 | Breast | IDC | Amphetamine addiction | 18/867 | 69/8465 | 1.42e-04 | 1.36e-03 | 1.01e-03 | 18 |
| hsa0516634 | Breast | IDC | Human T-cell leukemia virus 1 infection | 40/867 | 222/8465 | 2.52e-04 | 2.21e-03 | 1.66e-03 | 40 |
| hsa0516334 | Breast | IDC | Human cytomegalovirus infection | 39/867 | 225/8465 | 6.66e-04 | 5.41e-03 | 4.05e-03 | 39 |
| hsa0520332 | Breast | IDC | Viral carcinogenesis | 34/867 | 204/8465 | 2.82e-03 | 1.86e-02 | 1.39e-02 | 34 |
| hsa0502043 | Breast | DCIS | Prion disease | 100/846 | 273/8465 | 1.44e-33 | 1.55e-31 | 1.14e-31 | 100 |
| hsa0501643 | Breast | DCIS | Huntington disease | 101/846 | 306/8465 | 1.54e-29 | 1.24e-27 | 9.13e-28 | 101 |
| hsa0471443 | Breast | DCIS | Thermogenesis | 74/846 | 232/8465 | 8.72e-21 | 3.13e-19 | 2.30e-19 | 74 |
| hsa0491542 | Breast | DCIS | Estrogen signaling pathway | 35/846 | 138/8465 | 1.40e-07 | 2.51e-06 | 1.85e-06 | 35 |
| Page: 1 2 3 4 5 6 7 8 9 |
Top |
Cell-cell communication analysis |
| Identification of potential cell-cell interactions between two cell types and their ligand-receptor pairs for different disease states |
| Ligand | Receptor | LRpair | Pathway | Tissue | Disease Stage |
| Page: 1 |
Top |
Single-cell gene regulatory network inference analysis |
| Find out the significant the regulons (TFs) and the target genes of each regulon across cell types for different disease states |
| TF | Cell Type | Tissue | Disease Stage | Target Gene | RSS | Regulon Activity |
| CREB3L4 | STM | Breast | ADJ | MIEN1,CD9,LRRC26, etc. | 2.79e-02 |  |
| CREB3L4 | GOB | Esophagus | Healthy | GOLM1,TFF3,CPE, etc. | 2.01e-01 |  |
| CREB3L4 | BN | Liver | Healthy | CLIC3,TTC39C-AS1,TMEM70, etc. | 4.34e-02 |  |
| CREB3L4 | FIB | Prostate | Tumor | TRGC1,KLK3,SPDEF, etc. | 5.19e-01 |  |
| CREB3L4 | CHIEF | Stomach | ADJ | PGC,C6orf58,FMOD, etc. | 4.01e-01 |  |
| ∗The dot plots of a searched regulon are shown for all cell subpopulations in each disease state of each tissue based on the regulon specific score inferred using pySCENIC and by calculating the average expression. |
| Page: 1 |
Top |
Somatic mutation of malignant transformation related genes |
| Annotation of somatic variants for genes involved in malignant transformation |
| Hugo Symbol | Variant Class | Variant Classification | dbSNP RS | HGVSc | HGVSp | HGVSp Short | SWISSPROT | BIOTYPE | SIFT | PolyPhen | Tumor Sample Barcode | Tissue | Histology | Sex | Age | Stage | Therapy Types | Drugs | Outcome |
| CREB3L4 | SNV | Missense_Mutation | novel | c.605N>G | p.Val202Gly | p.V202G | Q8TEY5 | protein_coding | deleterious(0) | possibly_damaging(0.767) | TCGA-AN-A0G0-01 | Breast | breast invasive carcinoma | Female | <65 | I/II | Unknown | Unknown | SD |
| CREB3L4 | SNV | Missense_Mutation | c.806A>G | p.His269Arg | p.H269R | Q8TEY5 | protein_coding | tolerated(0.11) | benign(0.108) | TCGA-BH-A18G-01 | Breast | breast invasive carcinoma | Female | >=65 | I/II | Unknown | Unknown | SD | |
| CREB3L4 | SNV | Missense_Mutation | rs777111235 | c.458N>A | p.Cys153Tyr | p.C153Y | Q8TEY5 | protein_coding | tolerated(0.05) | benign(0.166) | TCGA-BH-A28Q-01 | Breast | breast invasive carcinoma | Female | <65 | I/II | Unknown | Unknown | SD |
| CREB3L4 | SNV | Missense_Mutation | rs371608503 | c.584G>A | p.Arg195His | p.R195H | Q8TEY5 | protein_coding | tolerated(0.18) | benign(0.001) | TCGA-D8-A1XQ-01 | Breast | breast invasive carcinoma | Female | >=65 | I/II | Unknown | Unknown | SD |
| CREB3L4 | SNV | Missense_Mutation | novel | c.793N>C | p.Glu265Gln | p.E265Q | Q8TEY5 | protein_coding | tolerated(0.35) | possibly_damaging(0.457) | TCGA-E2-A1LI-01 | Breast | breast invasive carcinoma | Female | <65 | I/II | Chemotherapy | adriamycin | SD |
| CREB3L4 | insertion | Frame_Shift_Ins | novel | c.99_100insATGTTGACCAGGCTGGTCTTGAACT | p.Pro34MetfsTer16 | p.P34Mfs*16 | Q8TEY5 | protein_coding | TCGA-AO-A03R-01 | Breast | breast invasive carcinoma | Female | <65 | I/II | Chemotherapy | doxorubicin | SD | ||
| CREB3L4 | insertion | Frame_Shift_Ins | novel | c.361_362insGTTTCCCGGAGCTTTCTCCCAGCTTCCCGGCGATTCATATT | p.Ala121GlyfsTer27 | p.A121Gfs*27 | Q8TEY5 | protein_coding | TCGA-AO-A0J9-01 | Breast | breast invasive carcinoma | Female | <65 | III/IV | Chemotherapy | cyclophosphamide | PD | ||
| CREB3L4 | SNV | Missense_Mutation | rs762042967 | c.517N>A | p.Val173Ile | p.V173I | Q8TEY5 | protein_coding | tolerated(0.36) | benign(0) | TCGA-C5-A1ME-01 | Cervix | cervical & endocervical cancer | Female | <65 | I/II | Unknown | Unknown | SD |
| CREB3L4 | SNV | Missense_Mutation | c.328N>T | p.Pro110Ser | p.P110S | Q8TEY5 | protein_coding | deleterious(0.03) | probably_damaging(0.997) | TCGA-EK-A2RN-01 | Cervix | cervical & endocervical cancer | Female | <65 | I/II | Unknown | Unknown | SD | |
| CREB3L4 | SNV | Missense_Mutation | novel | c.586N>G | p.Leu196Val | p.L196V | Q8TEY5 | protein_coding | deleterious(0) | possibly_damaging(0.727) | TCGA-VS-A94X-01 | Cervix | cervical & endocervical cancer | Female | <65 | I/II | Chemotherapy | cisplatin | PD |
| Page: 1 2 3 4 |
Top |
Related drugs of malignant transformation related genes |
| Identification of chemicals and drugs interact with genes involved in malignant transfromation |
| (DGIdb 4.0) |
| Entrez ID | Symbol | Category | Interaction Types | Drug Claim Name | Drug Name | PMIDs |
| Page: 1 |

Copyright 2023-Present -The University of Texas Health Science Center at Houston |