
|
|||||
|
 | |
| |
| |
| |
| |
| |
|
Gene: CRBN |
Gene summary for CRBN |
| Gene information | Species | Human | Gene symbol | CRBN | Gene ID | 51185 |
| Gene name | cereblon | |
| Gene Alias | MRT2 | |
| Cytomap | 3p26.2 | |
| Gene Type | protein-coding | GO ID | GO:0006464 | UniProtAcc | Q96SW2 |
Top |
Malignant transformation analysis |
| Identification of the aberrant gene expression in precancerous and cancerous lesions by comparing the gene expression of stem-like cells in diseased tissues with normal stem cells |
| Entrez ID | Symbol | Replicates | Species | Organ | Tissue | Adj P-value | Log2FC | Malignancy |
| 51185 | CRBN | LZE4T | Human | Esophagus | ESCC | 8.87e-10 | 2.53e-01 | 0.0811 |
| 51185 | CRBN | LZE7T | Human | Esophagus | ESCC | 3.88e-04 | 2.34e-01 | 0.0667 |
| 51185 | CRBN | LZE24T | Human | Esophagus | ESCC | 2.43e-09 | 3.14e-01 | 0.0596 |
| 51185 | CRBN | LZE6T | Human | Esophagus | ESCC | 1.10e-02 | 1.81e-01 | 0.0845 |
| 51185 | CRBN | P1T-E | Human | Esophagus | ESCC | 9.84e-05 | 1.59e-01 | 0.0875 |
| 51185 | CRBN | P2T-E | Human | Esophagus | ESCC | 1.24e-19 | 2.01e-01 | 0.1177 |
| 51185 | CRBN | P4T-E | Human | Esophagus | ESCC | 3.20e-16 | 4.18e-01 | 0.1323 |
| 51185 | CRBN | P5T-E | Human | Esophagus | ESCC | 2.38e-15 | 3.32e-01 | 0.1327 |
| 51185 | CRBN | P8T-E | Human | Esophagus | ESCC | 2.36e-18 | 2.61e-01 | 0.0889 |
| 51185 | CRBN | P9T-E | Human | Esophagus | ESCC | 2.58e-11 | 1.96e-01 | 0.1131 |
| 51185 | CRBN | P10T-E | Human | Esophagus | ESCC | 5.38e-17 | 3.05e-01 | 0.116 |
| 51185 | CRBN | P11T-E | Human | Esophagus | ESCC | 1.63e-05 | 2.21e-01 | 0.1426 |
| 51185 | CRBN | P12T-E | Human | Esophagus | ESCC | 2.14e-29 | 4.86e-01 | 0.1122 |
| 51185 | CRBN | P15T-E | Human | Esophagus | ESCC | 1.35e-15 | 2.15e-01 | 0.1149 |
| 51185 | CRBN | P16T-E | Human | Esophagus | ESCC | 5.61e-21 | 3.64e-01 | 0.1153 |
| 51185 | CRBN | P17T-E | Human | Esophagus | ESCC | 7.92e-06 | 3.14e-01 | 0.1278 |
| 51185 | CRBN | P20T-E | Human | Esophagus | ESCC | 7.04e-20 | 4.37e-01 | 0.1124 |
| 51185 | CRBN | P21T-E | Human | Esophagus | ESCC | 3.63e-09 | 1.28e-01 | 0.1617 |
| 51185 | CRBN | P22T-E | Human | Esophagus | ESCC | 1.63e-18 | 2.60e-01 | 0.1236 |
| 51185 | CRBN | P23T-E | Human | Esophagus | ESCC | 7.92e-30 | 6.48e-01 | 0.108 |
| Page: 1 2 3 4 5 6 |
| Tissue | Expression Dynamics | Abbreviation |
| Esophagus | 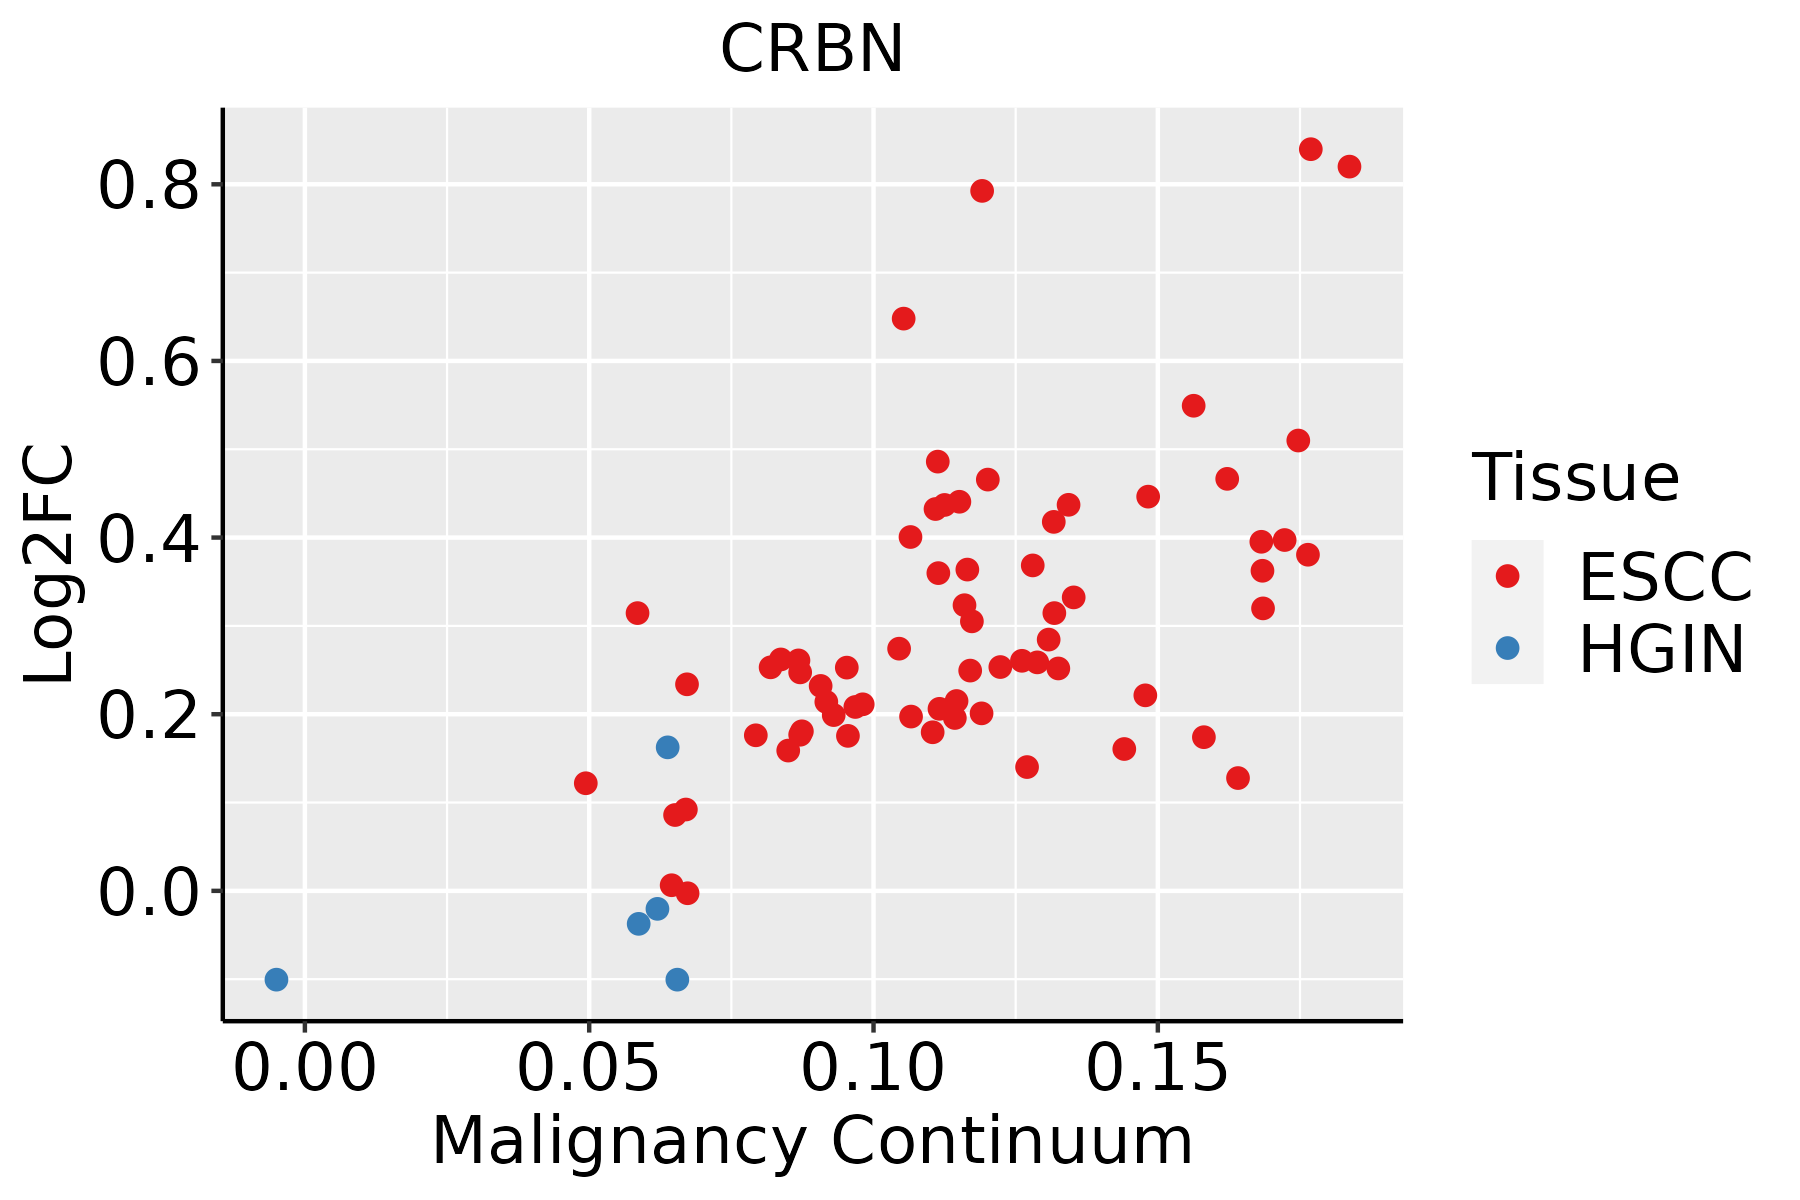 | ESCC: Esophageal squamous cell carcinoma |
| HGIN: High-grade intraepithelial neoplasias | ||
| LGIN: Low-grade intraepithelial neoplasias | ||
| Liver | 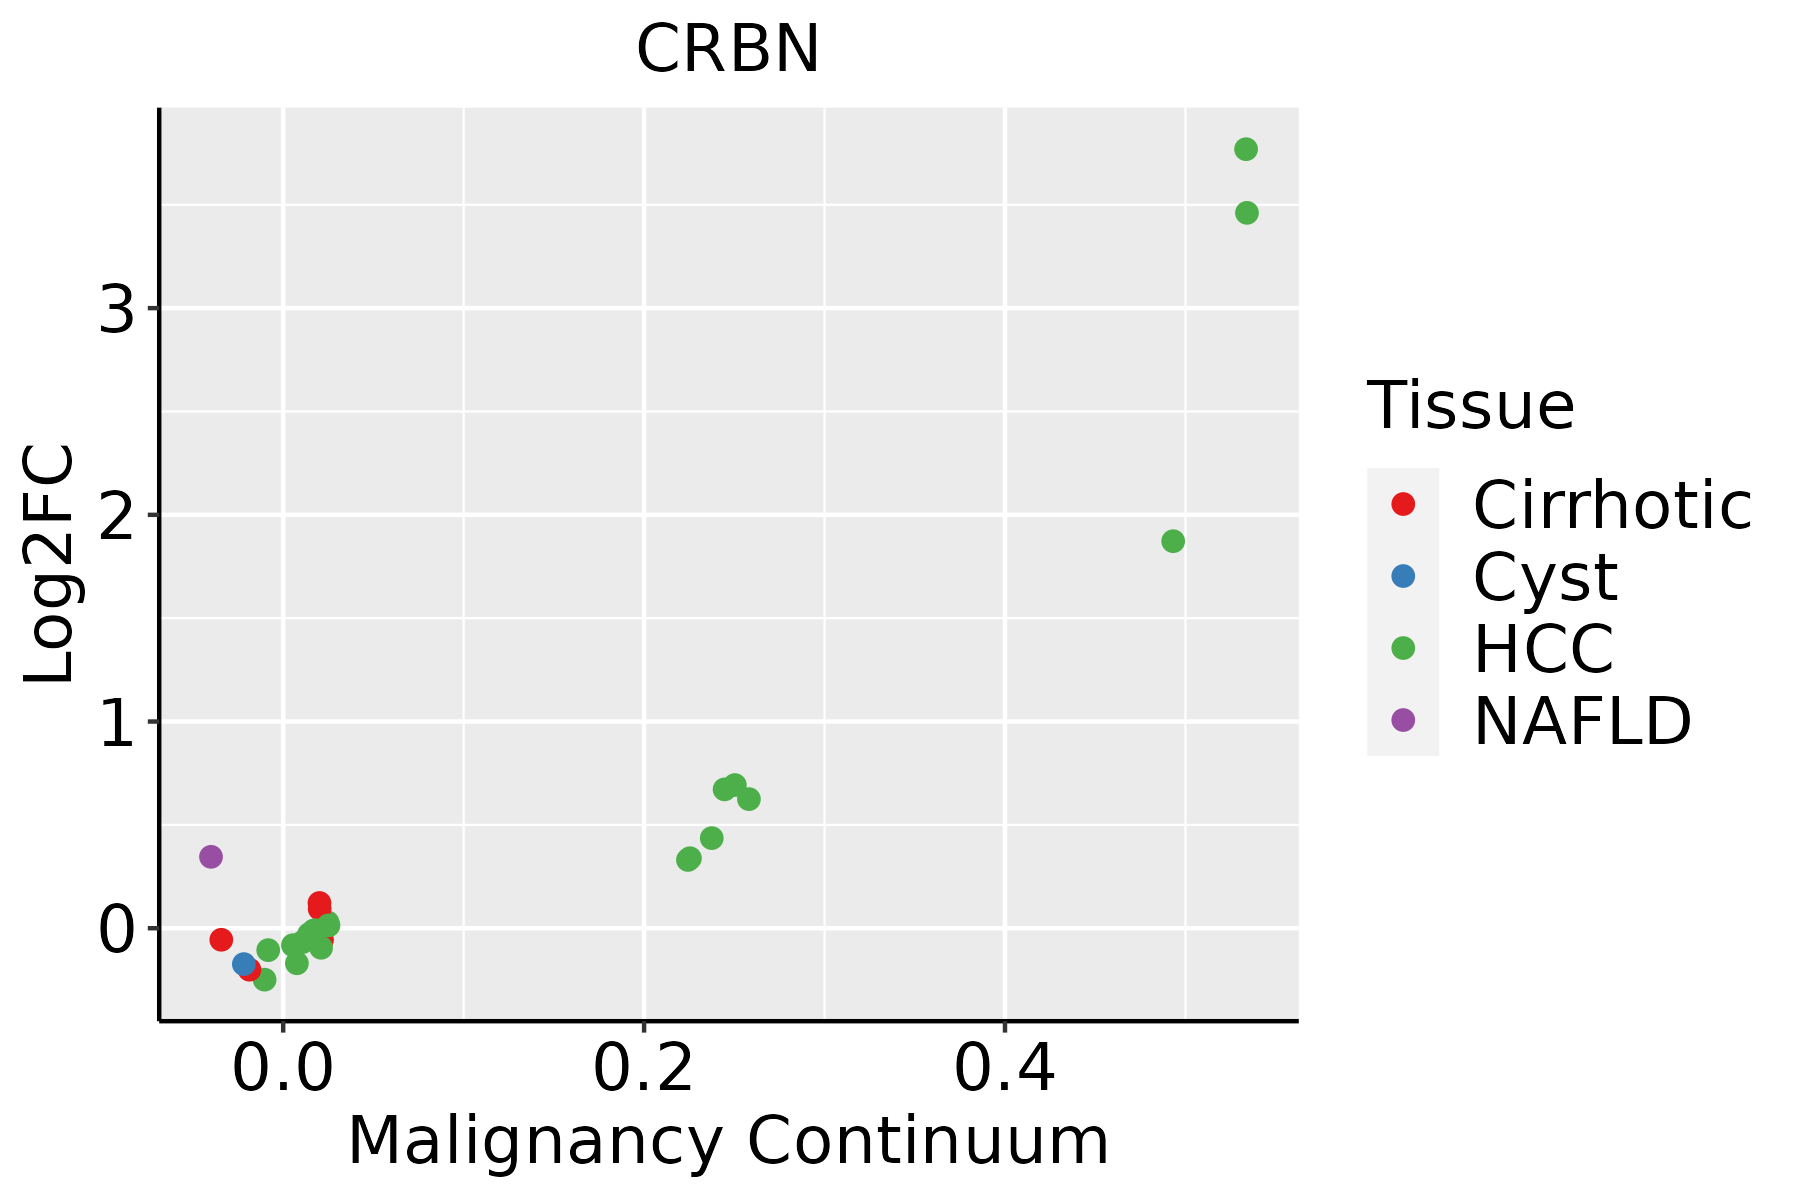 | HCC: Hepatocellular carcinoma |
| NAFLD: Non-alcoholic fatty liver disease | ||
| Oral Cavity | 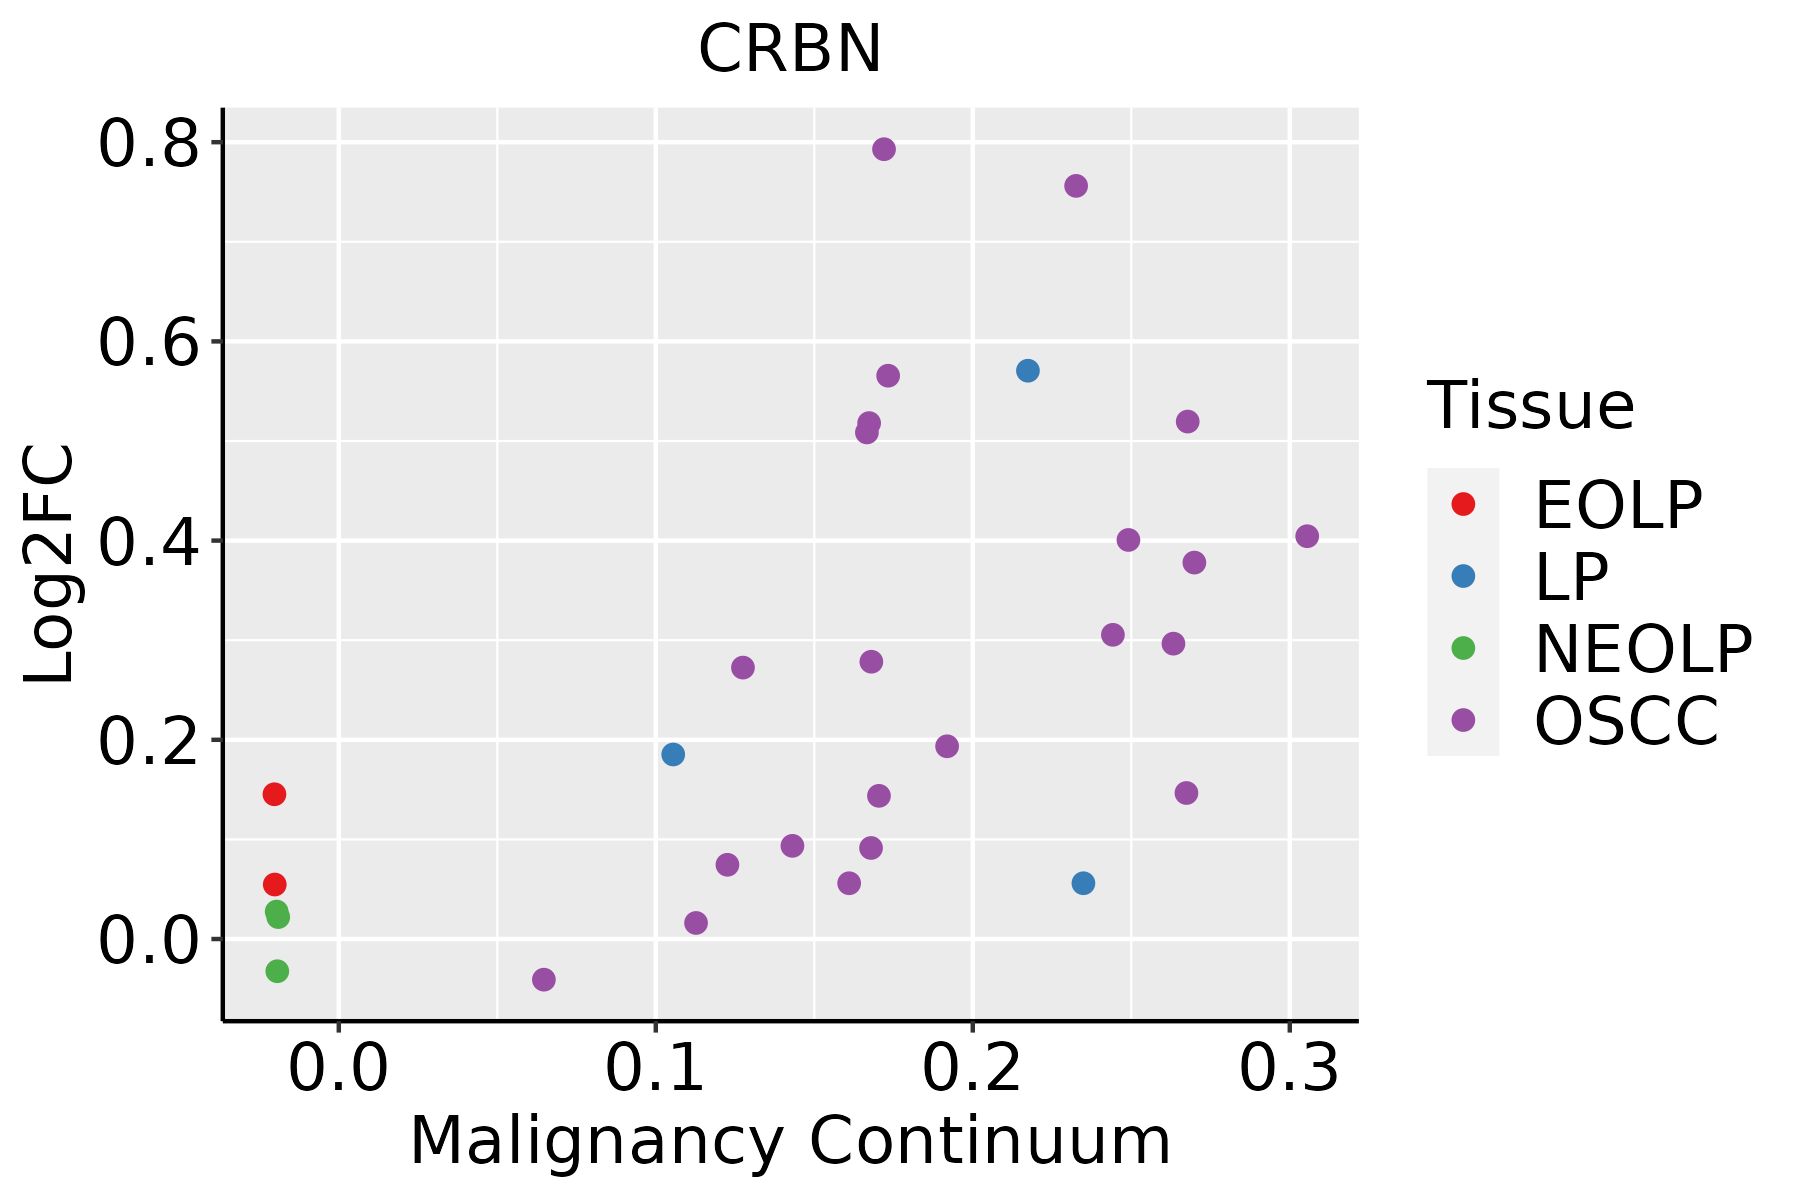 | EOLP: Erosive Oral lichen planus |
| LP: leukoplakia | ||
| NEOLP: Non-erosive oral lichen planus | ||
| OSCC: Oral squamous cell carcinoma | ||
| Skin | 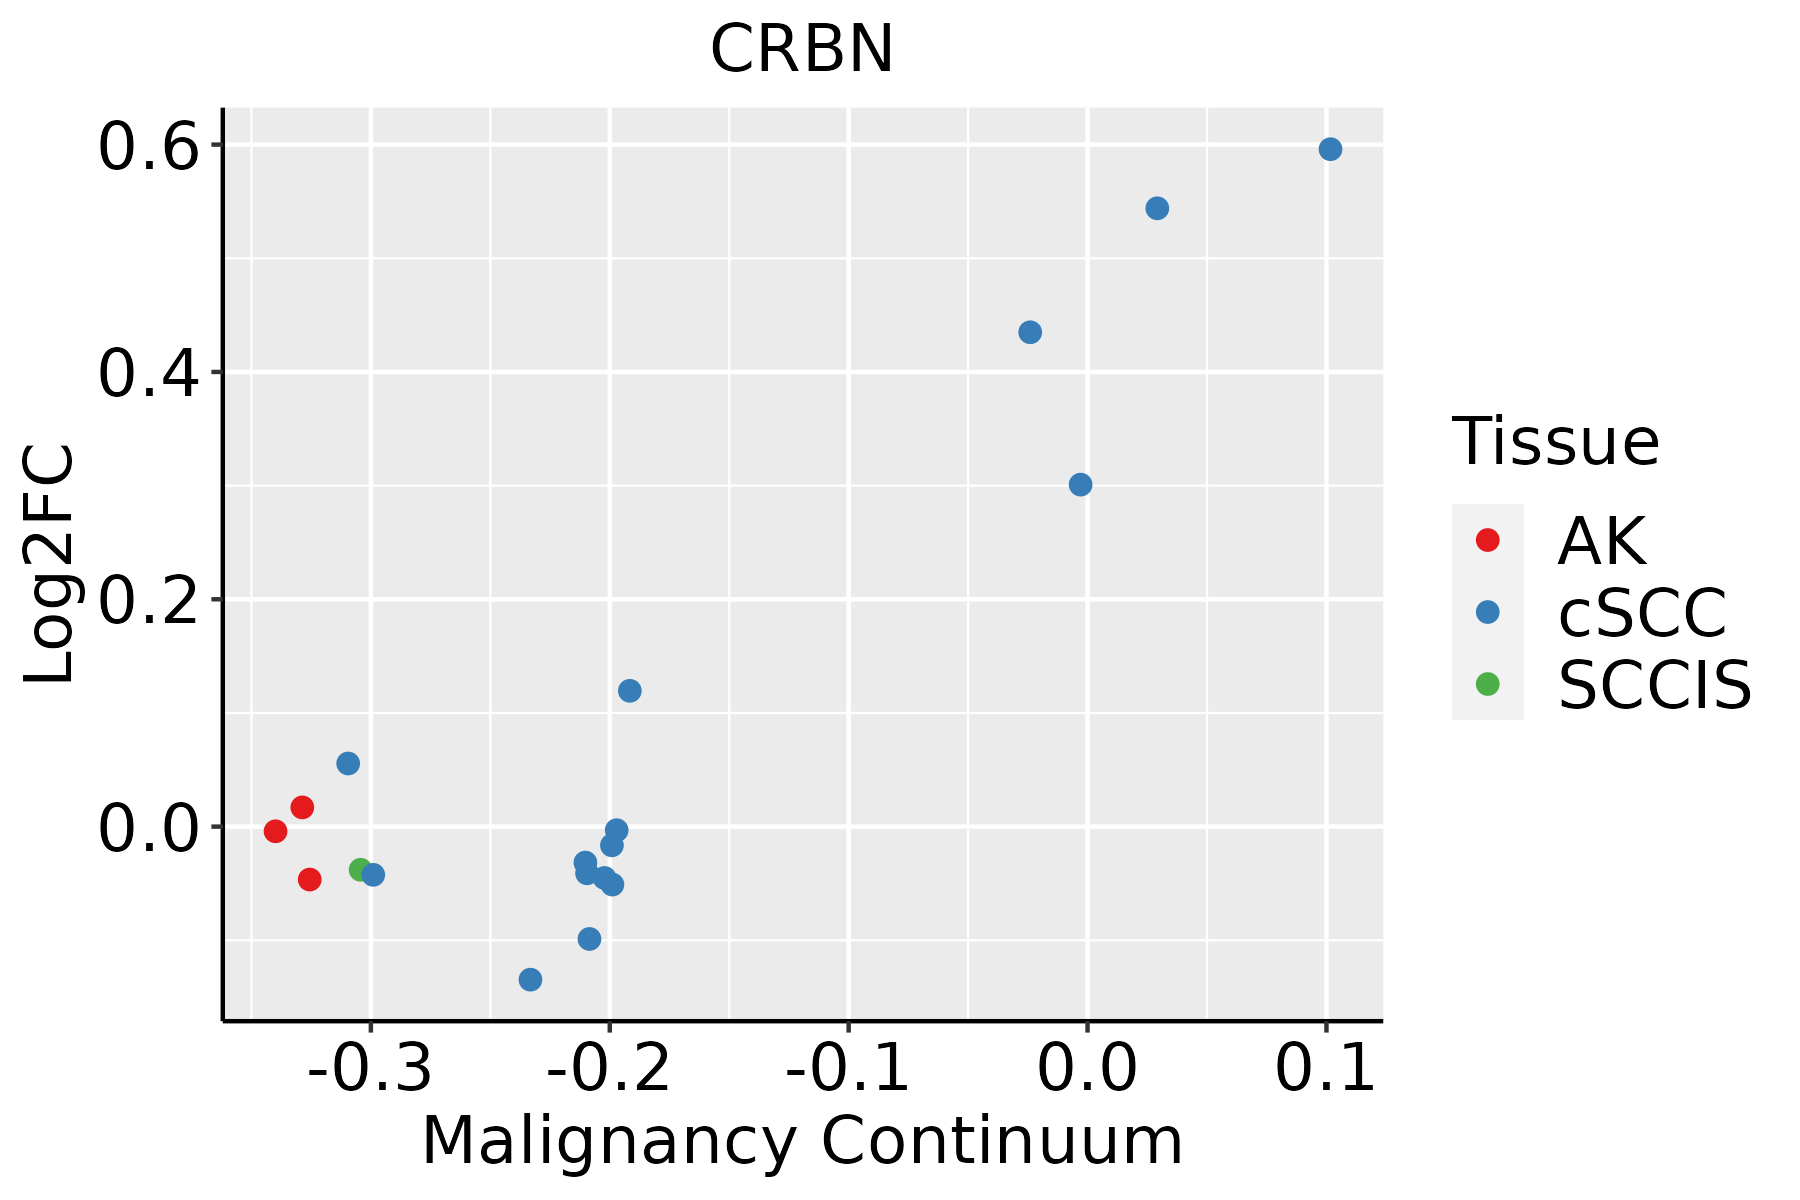 | AK: Actinic keratosis |
| cSCC: Cutaneous squamous cell carcinoma | ||
| SCCIS:squamous cell carcinoma in situ | ||
| Thyroid | 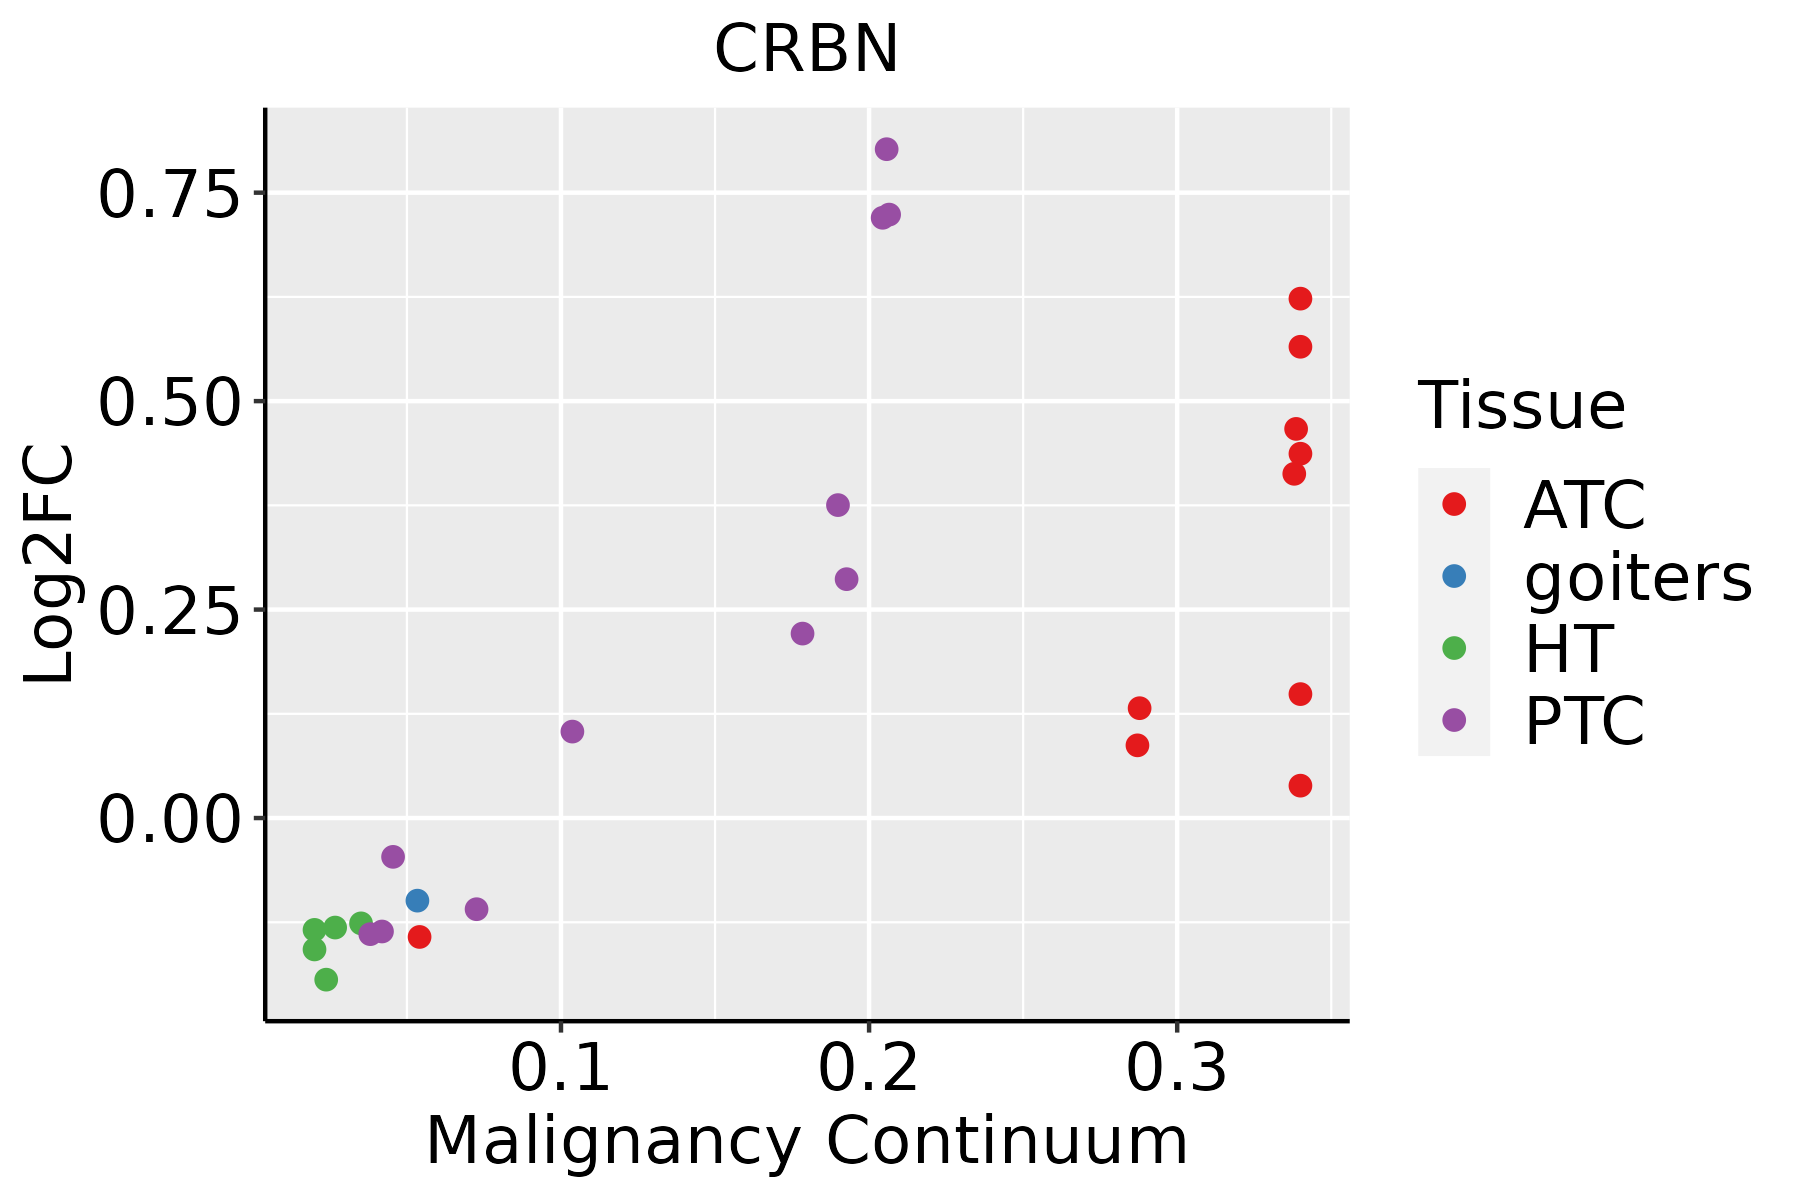 | ATC: Anaplastic thyroid cancer |
| HT: Hashimoto's thyroiditis | ||
| PTC: Papillary thyroid cancer |
| ∗log2FC in expression of this searched gene in stem-like cells from each diseased tissue sample relative to stem-like cells in normal samples in each tissue plotted against the malignancy continuum. Samples are colored based on if they are from different disease stage. |
Top |
Malignant transformation related pathway analysis |
| Find out the enriched GO biological processes and KEGG pathways involved in transition from healthy to precancer to cancer |
| Tissue | Disease Stage | Enriched GO biological Processes |
| Colorectum | AD |  |
| Colorectum | SER |  |
| Colorectum | MSS |  |
| Colorectum | MSI-H |  |
| Colorectum | FAP |  |
| ∗Top 15 enriched GO BP terms are showed in the bar plot of each disease state in each tissue. Each row represents a significant GO biological process which is colored according to the -log10(p.adjust). |
| Page: 1 2 3 4 5 6 7 8 9 |
| GO ID | Tissue | Disease Stage | Description | Gene Ratio | Bg Ratio | pvalue | p.adjust | Count |
| GO:003133318 | Oral cavity | OSCC | negative regulation of protein-containing complex assembly | 79/7305 | 141/18723 | 3.01e-05 | 2.76e-04 | 79 |
| GO:001049828 | Skin | cSCC | proteasomal protein catabolic process | 243/4864 | 490/18723 | 7.85e-30 | 4.10e-27 | 243 |
| GO:004316128 | Skin | cSCC | proteasome-mediated ubiquitin-dependent protein catabolic process | 205/4864 | 412/18723 | 1.46e-25 | 4.16e-23 | 205 |
| GO:004325429 | Skin | cSCC | regulation of protein-containing complex assembly | 167/4864 | 428/18723 | 1.60e-09 | 5.97e-08 | 167 |
| GO:0031334112 | Skin | cSCC | positive regulation of protein-containing complex assembly | 97/4864 | 237/18723 | 3.22e-07 | 6.51e-06 | 97 |
| GO:003133326 | Skin | cSCC | negative regulation of protein-containing complex assembly | 55/4864 | 141/18723 | 4.57e-04 | 3.49e-03 | 55 |
| GO:0010498113 | Thyroid | PTC | proteasomal protein catabolic process | 297/5968 | 490/18723 | 4.58e-40 | 9.63e-37 | 297 |
| GO:0043161113 | Thyroid | PTC | proteasome-mediated ubiquitin-dependent protein catabolic process | 254/5968 | 412/18723 | 3.91e-36 | 4.54e-33 | 254 |
| GO:0043254113 | Thyroid | PTC | regulation of protein-containing complex assembly | 215/5968 | 428/18723 | 1.23e-15 | 9.09e-14 | 215 |
| GO:0031334113 | Thyroid | PTC | positive regulation of protein-containing complex assembly | 121/5968 | 237/18723 | 5.70e-10 | 1.81e-08 | 121 |
| GO:0031333112 | Thyroid | PTC | negative regulation of protein-containing complex assembly | 68/5968 | 141/18723 | 3.61e-05 | 3.37e-04 | 68 |
| GO:00510518 | Thyroid | PTC | negative regulation of transport | 176/5968 | 470/18723 | 5.44e-03 | 2.49e-02 | 176 |
| GO:001049832 | Thyroid | ATC | proteasomal protein catabolic process | 309/6293 | 490/18723 | 1.78e-41 | 1.13e-37 | 309 |
| GO:0043161210 | Thyroid | ATC | proteasome-mediated ubiquitin-dependent protein catabolic process | 265/6293 | 412/18723 | 7.09e-38 | 1.49e-34 | 265 |
| GO:0043254210 | Thyroid | ATC | regulation of protein-containing complex assembly | 225/6293 | 428/18723 | 2.72e-16 | 2.33e-14 | 225 |
| GO:003133428 | Thyroid | ATC | positive regulation of protein-containing complex assembly | 127/6293 | 237/18723 | 1.64e-10 | 4.93e-09 | 127 |
| GO:003133333 | Thyroid | ATC | negative regulation of protein-containing complex assembly | 71/6293 | 141/18723 | 2.83e-05 | 2.38e-04 | 71 |
| GO:005105114 | Thyroid | ATC | negative regulation of transport | 183/6293 | 470/18723 | 8.12e-03 | 3.13e-02 | 183 |
| Page: 1 2 |
| Pathway ID | Tissue | Disease Stage | Description | Gene Ratio | Bg Ratio | pvalue | p.adjust | qvalue | Count |
| Page: 1 |
Top |
Cell-cell communication analysis |
| Identification of potential cell-cell interactions between two cell types and their ligand-receptor pairs for different disease states |
| Ligand | Receptor | LRpair | Pathway | Tissue | Disease Stage |
| Page: 1 |
Top |
Single-cell gene regulatory network inference analysis |
| Find out the significant the regulons (TFs) and the target genes of each regulon across cell types for different disease states |
| TF | Cell Type | Tissue | Disease Stage | Target Gene | RSS | Regulon Activity |
| ∗The dot plots of a searched regulon are shown for all cell subpopulations in each disease state of each tissue based on the regulon specific score inferred using pySCENIC and by calculating the average expression. |
| Page: 1 |
Top |
Somatic mutation of malignant transformation related genes |
| Annotation of somatic variants for genes involved in malignant transformation |
| Hugo Symbol | Variant Class | Variant Classification | dbSNP RS | HGVSc | HGVSp | HGVSp Short | SWISSPROT | BIOTYPE | SIFT | PolyPhen | Tumor Sample Barcode | Tissue | Histology | Sex | Age | Stage | Therapy Types | Drugs | Outcome |
| CRBN | SNV | Missense_Mutation | novel | c.1240N>C | p.Phe414Leu | p.F414L | Q96SW2 | protein_coding | deleterious(0) | probably_damaging(0.931) | TCGA-LL-A5YO-01 | Breast | breast invasive carcinoma | Female | <65 | I/II | Chemotherapy | taxotere | CR |
| CRBN | insertion | Frame_Shift_Ins | novel | c.948_949insGGTCTTAGCA | p.Lys317GlyfsTer11 | p.K317Gfs*11 | Q96SW2 | protein_coding | TCGA-AR-A0U0-01 | Breast | breast invasive carcinoma | Female | >=65 | I/II | Unknown | Unknown | SD | ||
| CRBN | SNV | Missense_Mutation | novel | c.311C>A | p.Pro104His | p.P104H | Q96SW2 | protein_coding | tolerated(0.06) | probably_damaging(0.999) | TCGA-C5-A2LX-01 | Cervix | cervical & endocervical cancer | Female | <65 | I/II | Chemotherapy | cisplatin | SD |
| CRBN | SNV | Missense_Mutation | rs758183266 | c.316N>A | p.Glu106Lys | p.E106K | Q96SW2 | protein_coding | tolerated(0.13) | probably_damaging(0.992) | TCGA-EK-A2RN-01 | Cervix | cervical & endocervical cancer | Female | <65 | I/II | Unknown | Unknown | SD |
| CRBN | SNV | Missense_Mutation | c.193G>A | p.Glu65Lys | p.E65K | Q96SW2 | protein_coding | deleterious(0.01) | possibly_damaging(0.676) | TCGA-3L-AA1B-01 | Colorectum | colon adenocarcinoma | Female | <65 | I/II | Unknown | Unknown | SD | |
| CRBN | SNV | Missense_Mutation | rs151127854 | c.332G>A | p.Arg111Gln | p.R111Q | Q96SW2 | protein_coding | tolerated(0.18) | probably_damaging(0.992) | TCGA-A6-5661-01 | Colorectum | colon adenocarcinoma | Female | >=65 | I/II | Unknown | Unknown | SD |
| CRBN | SNV | Missense_Mutation | rs566932471 | c.1274N>T | p.Thr425Met | p.T425M | Q96SW2 | protein_coding | tolerated(0.11) | benign(0.003) | TCGA-AA-3864-01 | Colorectum | colon adenocarcinoma | Male | >=65 | I/II | Unknown | Unknown | SD |
| CRBN | SNV | Missense_Mutation | novel | c.1153G>A | p.Ala385Thr | p.A385T | Q96SW2 | protein_coding | deleterious(0) | probably_damaging(0.989) | TCGA-AA-3950-01 | Colorectum | colon adenocarcinoma | Female | >=65 | I/II | Unknown | Unknown | SD |
| CRBN | SNV | Missense_Mutation | c.707N>C | p.Asn236Thr | p.N236T | Q96SW2 | protein_coding | tolerated(0.28) | benign(0.042) | TCGA-AA-3977-01 | Colorectum | colon adenocarcinoma | Male | >=65 | I/II | Unknown | Unknown | SD | |
| CRBN | SNV | Missense_Mutation | novel | c.431A>G | p.Tyr144Cys | p.Y144C | Q96SW2 | protein_coding | deleterious(0.01) | probably_damaging(0.947) | TCGA-CK-4951-01 | Colorectum | colon adenocarcinoma | Female | >=65 | I/II | Unknown | Unknown | PD |
| Page: 1 2 3 4 5 |
Top |
Related drugs of malignant transformation related genes |
| Identification of chemicals and drugs interact with genes involved in malignant transfromation |
| (DGIdb 4.0) |
| Entrez ID | Symbol | Category | Interaction Types | Drug Claim Name | Drug Name | PMIDs |
| 51185 | CRBN | ENZYME, DRUG RESISTANCE | inhibitor | CHEMBL43452 | POMALIDOMIDE | |
| 51185 | CRBN | ENZYME, DRUG RESISTANCE | inhibitor | CHEMBL468 | THALIDOMIDE | |
| 51185 | CRBN | ENZYME, DRUG RESISTANCE | 178103899 | THALIDOMIDE | ||
| 51185 | CRBN | ENZYME, DRUG RESISTANCE | 178103903 | LENALIDOMIDE | ||
| 51185 | CRBN | ENZYME, DRUG RESISTANCE | 178103920 | POMALIDOMIDE | ||
| 51185 | CRBN | ENZYME, DRUG RESISTANCE | CC-122 | AVADOMIDE | ||
| 51185 | CRBN | ENZYME, DRUG RESISTANCE | 387065615 | |||
| 51185 | CRBN | ENZYME, DRUG RESISTANCE | 387065622 | |||
| 51185 | CRBN | ENZYME, DRUG RESISTANCE | 340590248 | IBERDOMIDE | ||
| 51185 | CRBN | ENZYME, DRUG RESISTANCE | 387065604 | AVADOMIDE |
| Page: 1 2 |

Copyright 2023-Present -The University of Texas Health Science Center at Houston |