
|
|||||
|
 | |
| |
| |
| |
| |
| |
|
Gene: COX17 |
Gene summary for COX17 |
| Gene information | Species | Human | Gene symbol | COX17 | Gene ID | 10063 |
| Gene name | cytochrome c oxidase copper chaperone COX17 | |
| Gene Alias | COX17 | |
| Cytomap | 3q13.33 | |
| Gene Type | protein-coding | GO ID | GO:0000041 | UniProtAcc | Q14061 |
Top |
Malignant transformation analysis |
| Identification of the aberrant gene expression in precancerous and cancerous lesions by comparing the gene expression of stem-like cells in diseased tissues with normal stem cells |
| Entrez ID | Symbol | Replicates | Species | Organ | Tissue | Adj P-value | Log2FC | Malignancy |
| 10063 | COX17 | GSM4909286 | Human | Breast | IDC | 2.26e-02 | -1.25e-01 | 0.1081 |
| 10063 | COX17 | GSM4909287 | Human | Breast | IDC | 1.22e-02 | -2.58e-01 | 0.2057 |
| 10063 | COX17 | GSM4909288 | Human | Breast | IDC | 5.37e-03 | -3.36e-01 | 0.0988 |
| 10063 | COX17 | GSM4909290 | Human | Breast | IDC | 4.68e-09 | 4.81e-01 | 0.2096 |
| 10063 | COX17 | GSM4909291 | Human | Breast | IDC | 1.29e-16 | 6.13e-01 | 0.1753 |
| 10063 | COX17 | GSM4909293 | Human | Breast | IDC | 4.75e-13 | 4.09e-01 | 0.1581 |
| 10063 | COX17 | GSM4909294 | Human | Breast | IDC | 7.66e-04 | 1.40e-01 | 0.2022 |
| 10063 | COX17 | GSM4909296 | Human | Breast | IDC | 1.59e-09 | 3.17e-02 | 0.1524 |
| 10063 | COX17 | GSM4909297 | Human | Breast | IDC | 3.28e-17 | 8.89e-02 | 0.1517 |
| 10063 | COX17 | GSM4909298 | Human | Breast | IDC | 1.56e-04 | 2.76e-01 | 0.1551 |
| 10063 | COX17 | GSM4909301 | Human | Breast | IDC | 1.07e-43 | 7.05e-01 | 0.1577 |
| 10063 | COX17 | GSM4909302 | Human | Breast | IDC | 1.79e-02 | 2.12e-01 | 0.1545 |
| 10063 | COX17 | GSM4909304 | Human | Breast | IDC | 6.19e-26 | 5.42e-01 | 0.1636 |
| 10063 | COX17 | GSM4909306 | Human | Breast | IDC | 9.37e-07 | 3.05e-01 | 0.1564 |
| 10063 | COX17 | GSM4909309 | Human | Breast | IDC | 1.78e-08 | 2.21e-01 | 0.0483 |
| 10063 | COX17 | GSM4909311 | Human | Breast | IDC | 8.10e-33 | -6.94e-02 | 0.1534 |
| 10063 | COX17 | GSM4909312 | Human | Breast | IDC | 3.80e-07 | 4.84e-02 | 0.1552 |
| 10063 | COX17 | GSM4909316 | Human | Breast | IDC | 1.15e-05 | 2.02e-01 | 0.21 |
| 10063 | COX17 | GSM4909318 | Human | Breast | IDC | 3.47e-03 | 2.97e-01 | 0.2031 |
| 10063 | COX17 | GSM4909319 | Human | Breast | IDC | 8.22e-59 | 2.08e-01 | 0.1563 |
| Page: 1 2 3 4 5 6 7 8 9 10 11 |
| Tissue | Expression Dynamics | Abbreviation |
| Breast | 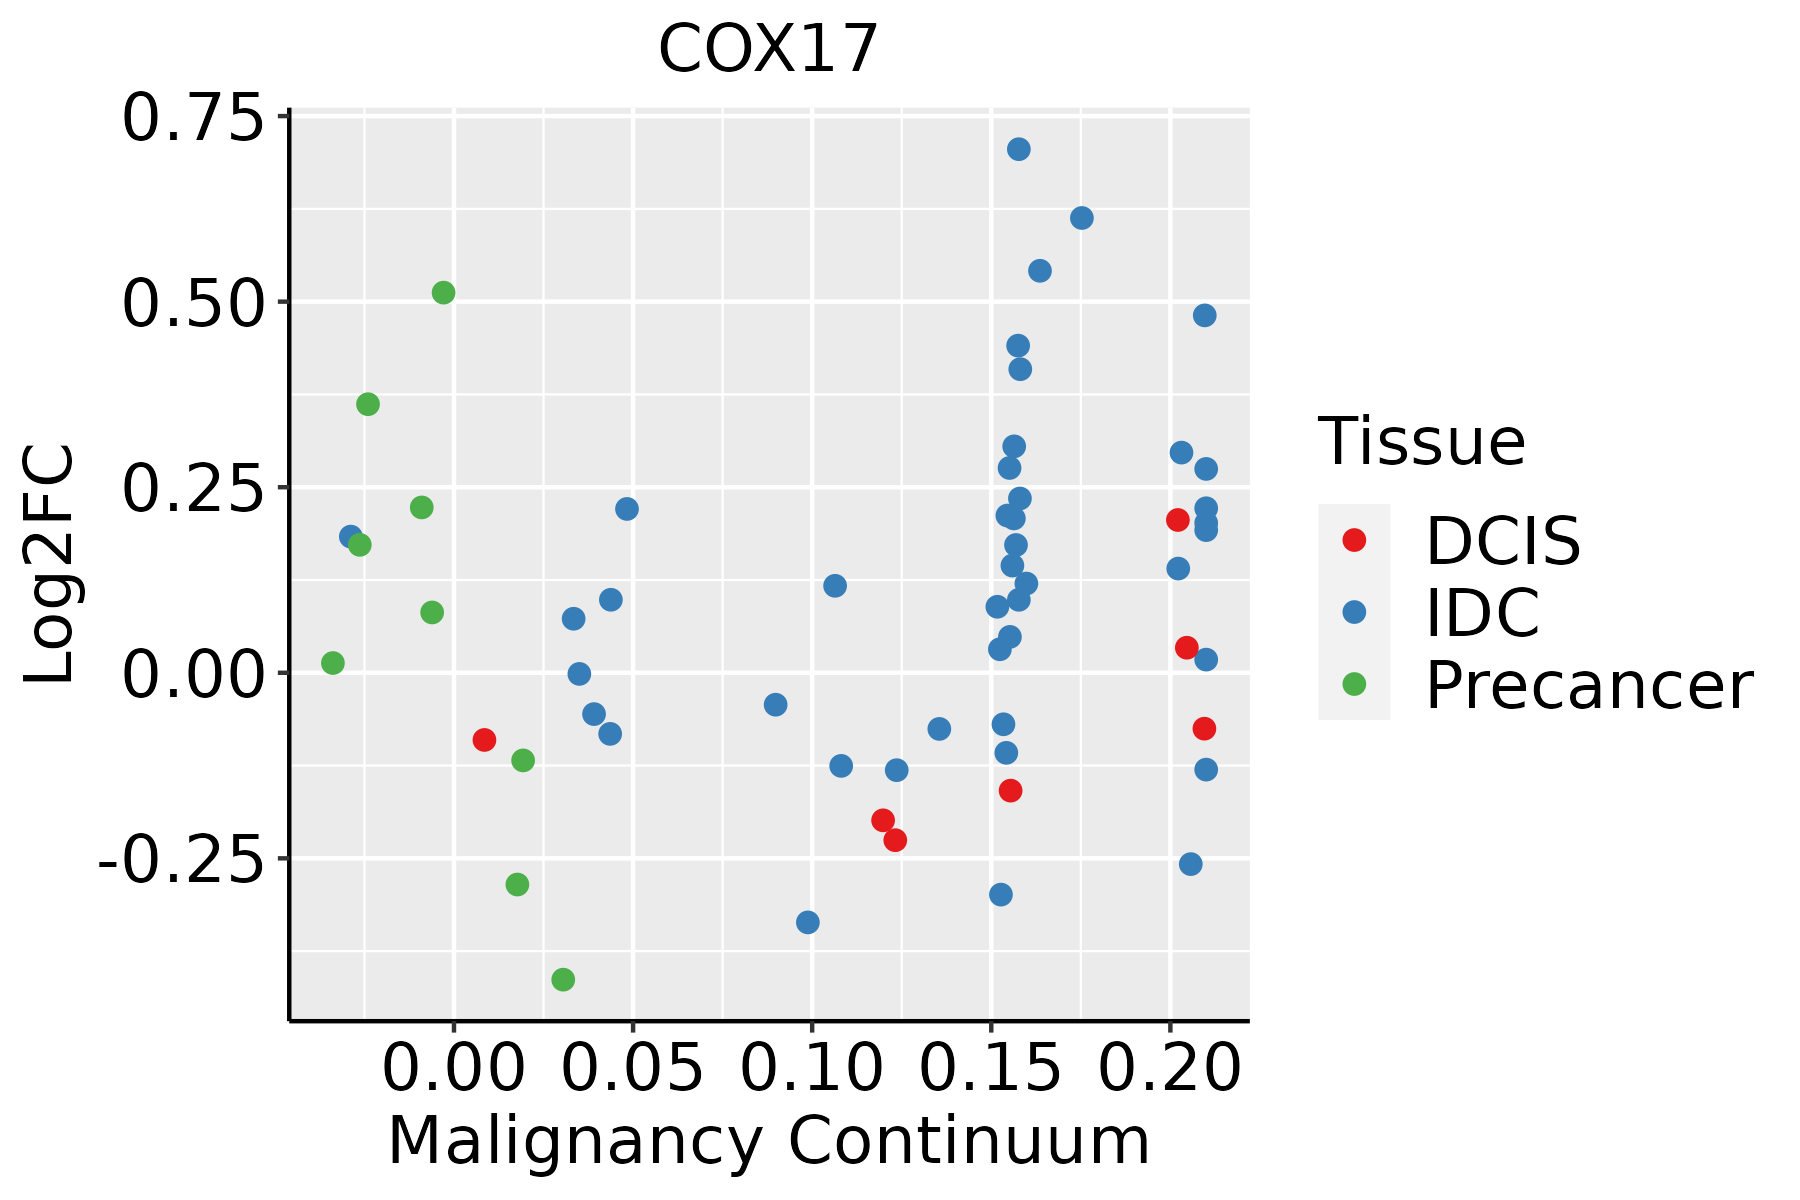 | IDC: Invasive ductal carcinoma |
| DCIS: Ductal carcinoma in situ | ||
| Precancer(BRCA1-mut): Precancerous lesion from BRCA1 mutation carriers | ||
| Cervix | 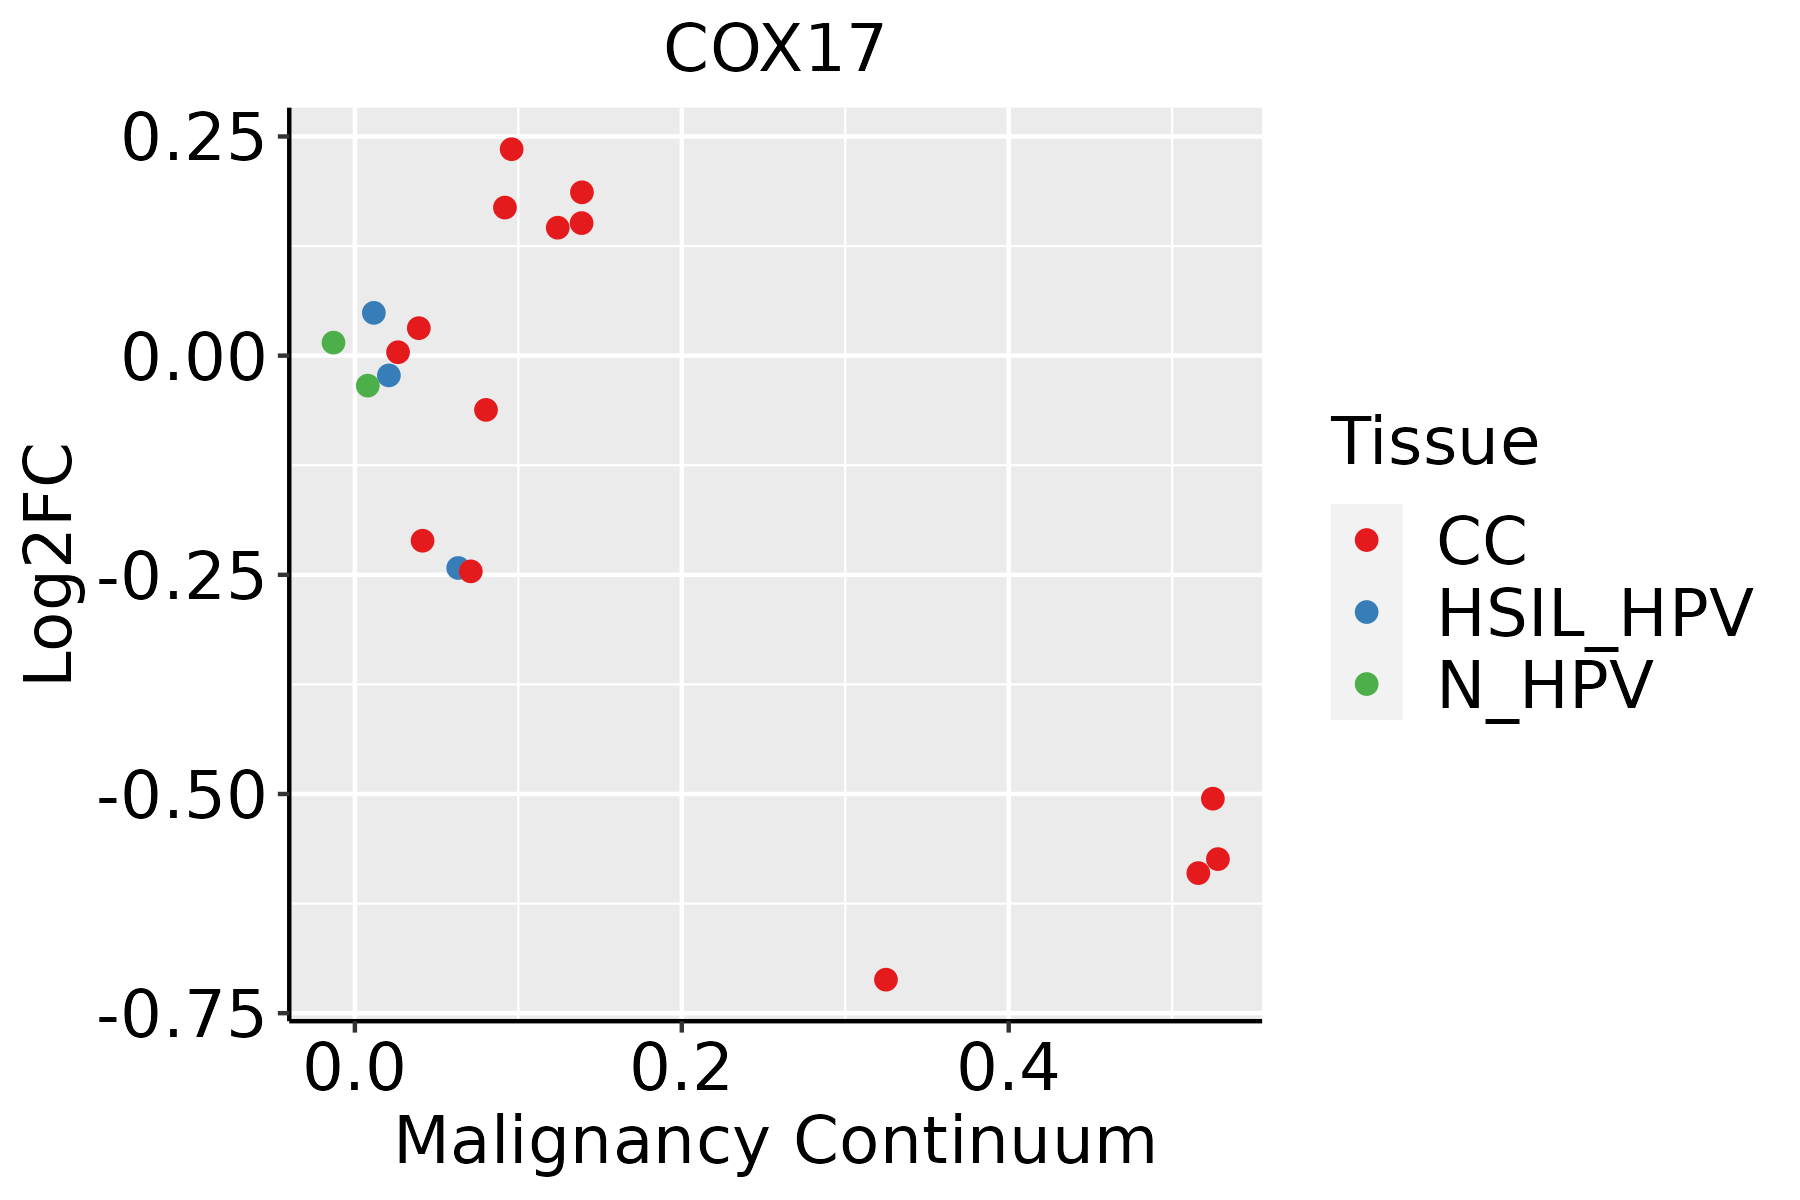 | CC: Cervix cancer |
| HSIL_HPV: HPV-infected high-grade squamous intraepithelial lesions | ||
| N_HPV: HPV-infected normal cervix | ||
| Colorectum (GSE201348) |  | FAP: Familial adenomatous polyposis |
| CRC: Colorectal cancer | ||
| Colorectum (HTA11) |  | AD: Adenomas |
| SER: Sessile serrated lesions | ||
| MSI-H: Microsatellite-high colorectal cancer | ||
| MSS: Microsatellite stable colorectal cancer | ||
| Esophagus | 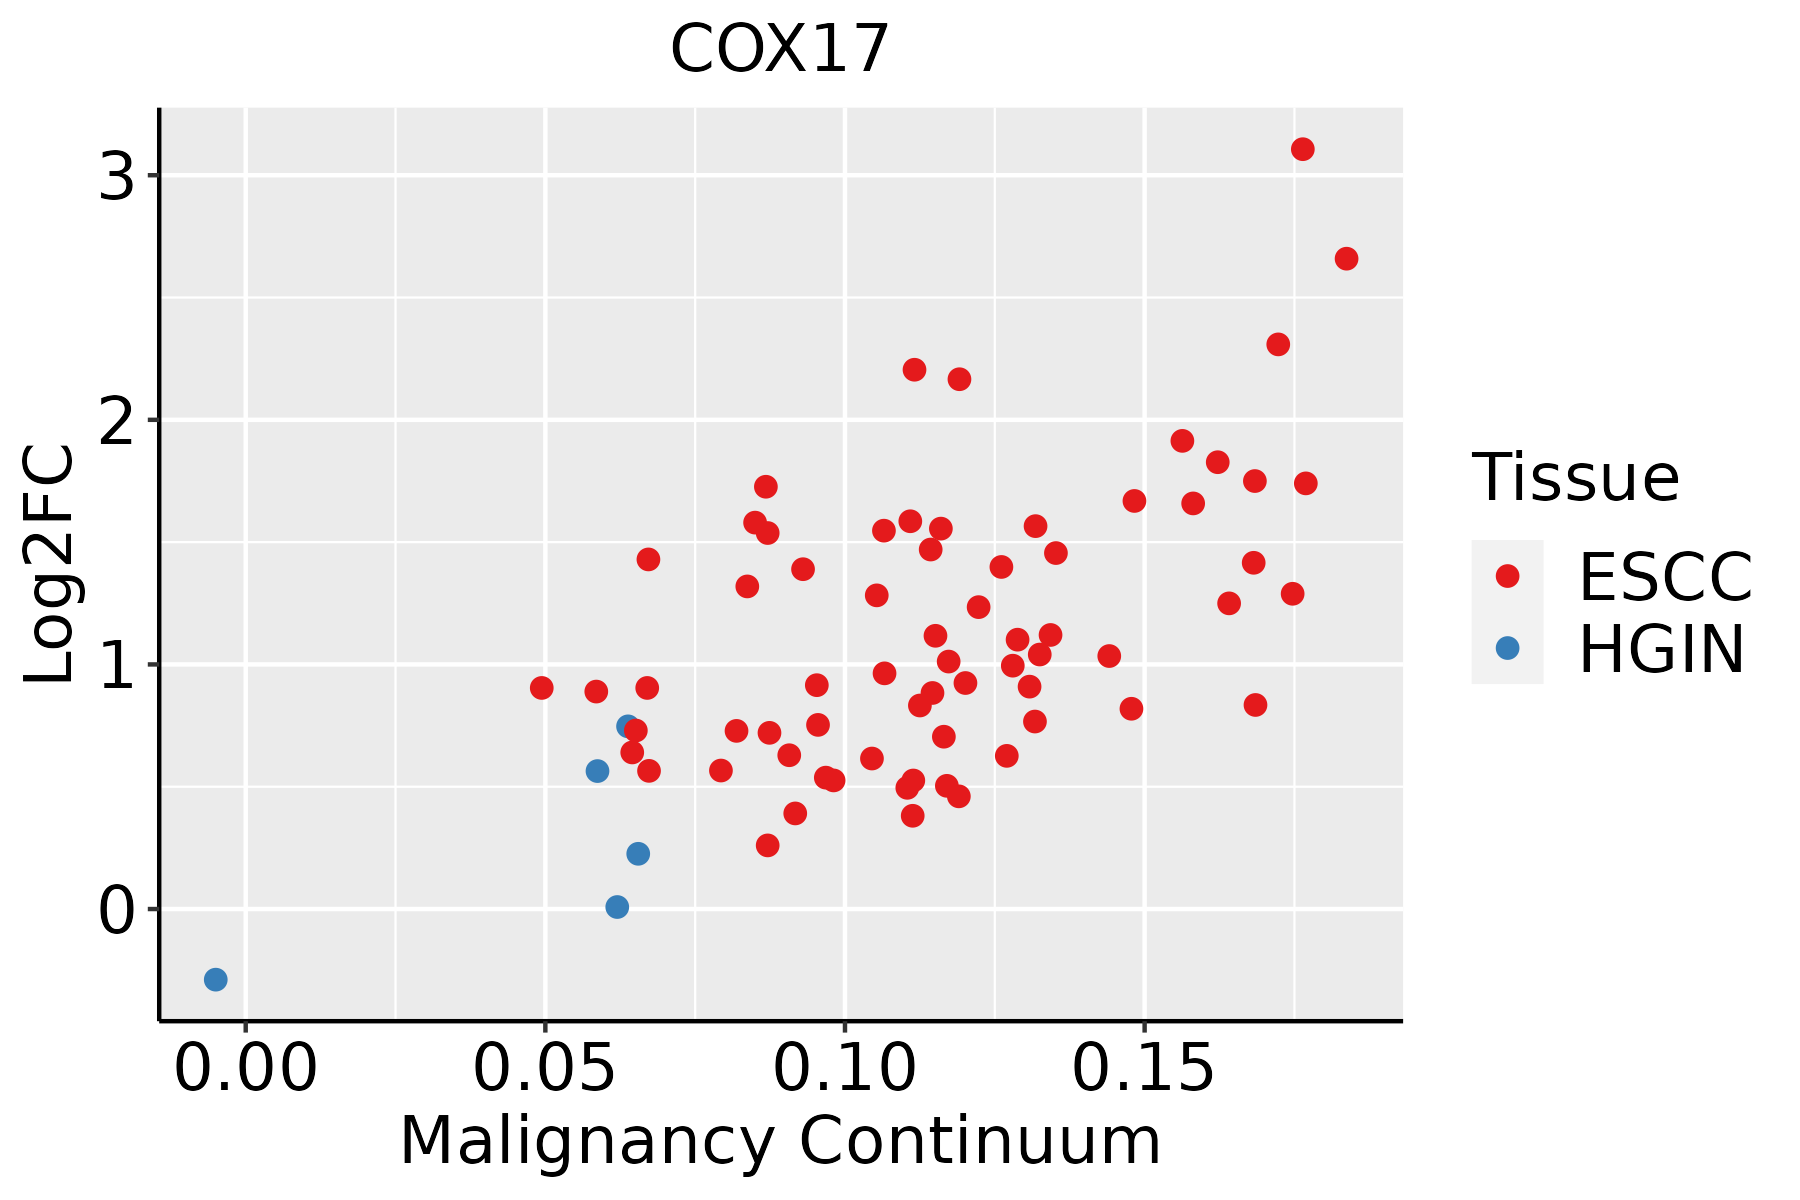 | ESCC: Esophageal squamous cell carcinoma |
| HGIN: High-grade intraepithelial neoplasias | ||
| LGIN: Low-grade intraepithelial neoplasias | ||
| Liver |  | HCC: Hepatocellular carcinoma |
| NAFLD: Non-alcoholic fatty liver disease | ||
| Oral Cavity | 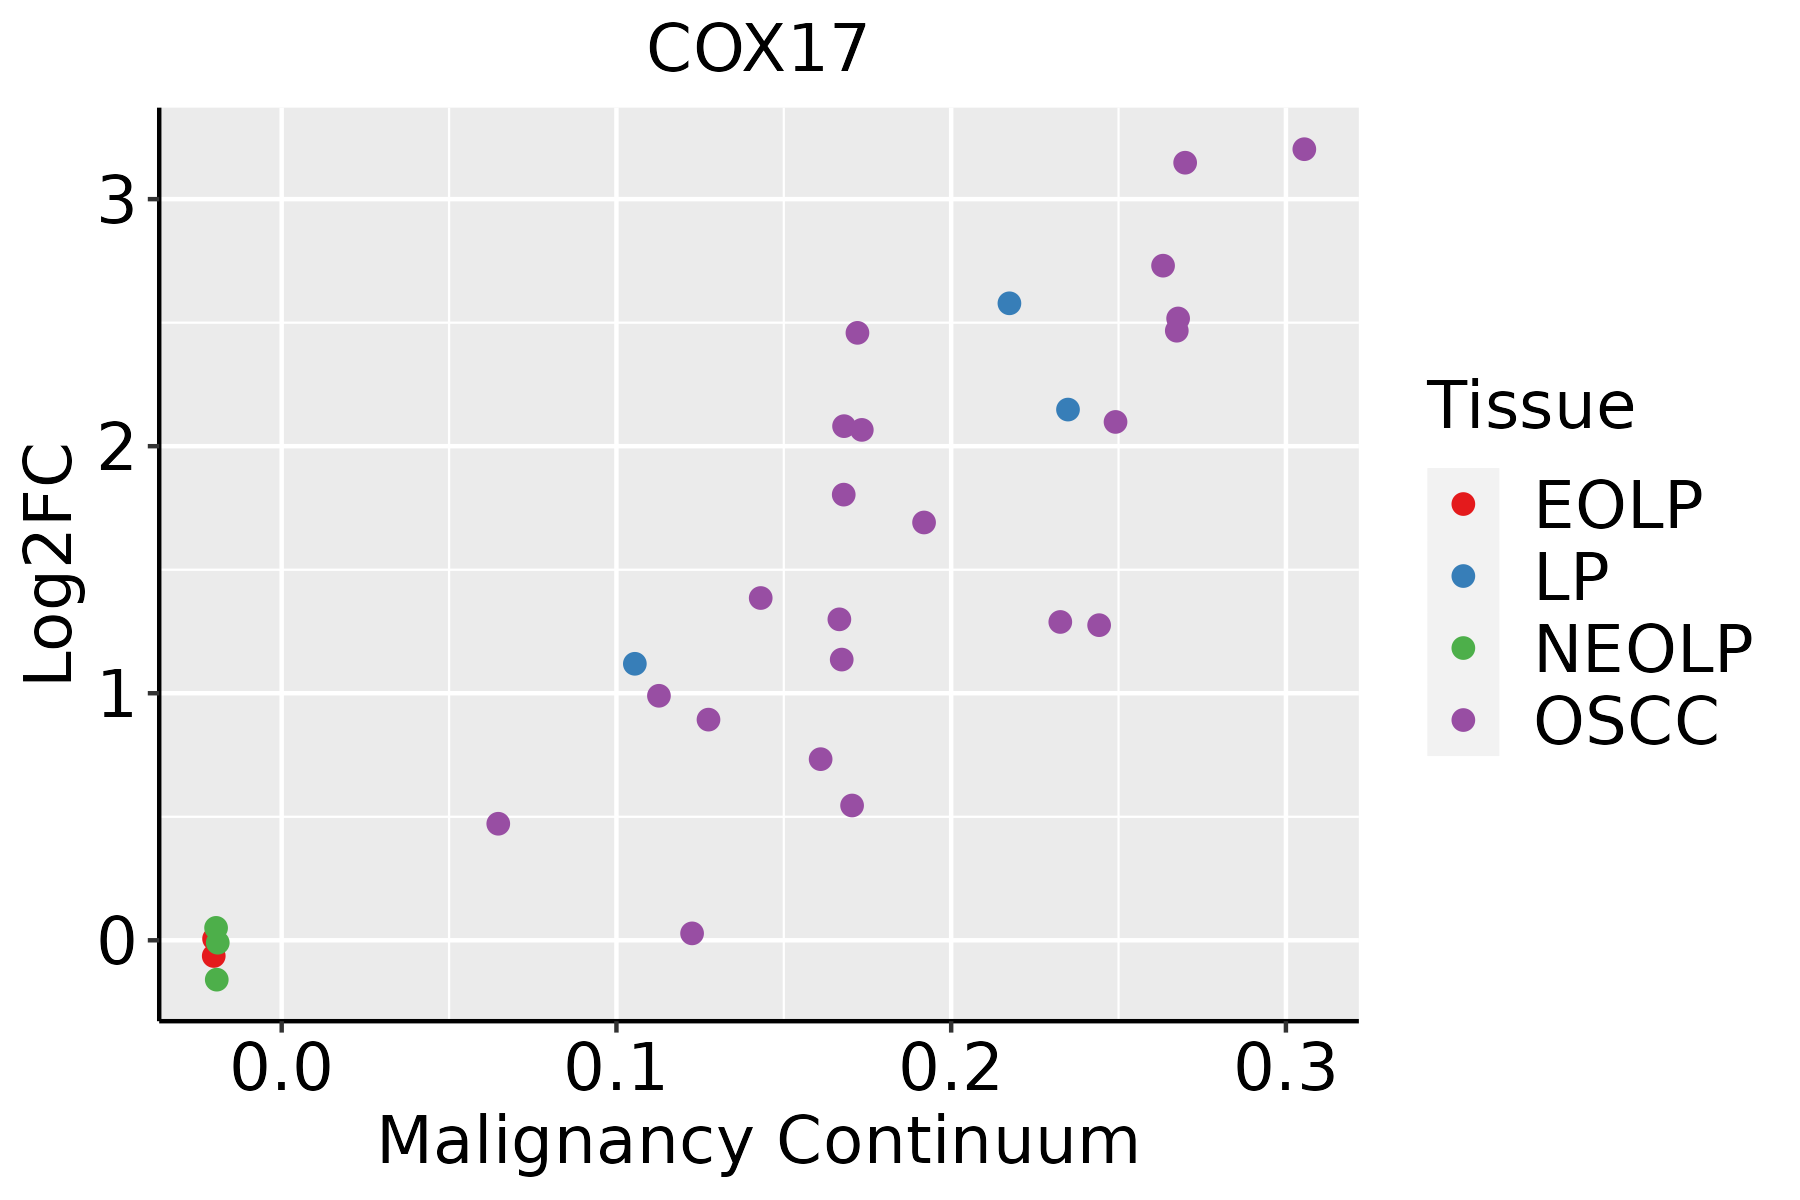 | EOLP: Erosive Oral lichen planus |
| LP: leukoplakia | ||
| NEOLP: Non-erosive oral lichen planus | ||
| OSCC: Oral squamous cell carcinoma | ||
| Prostate | 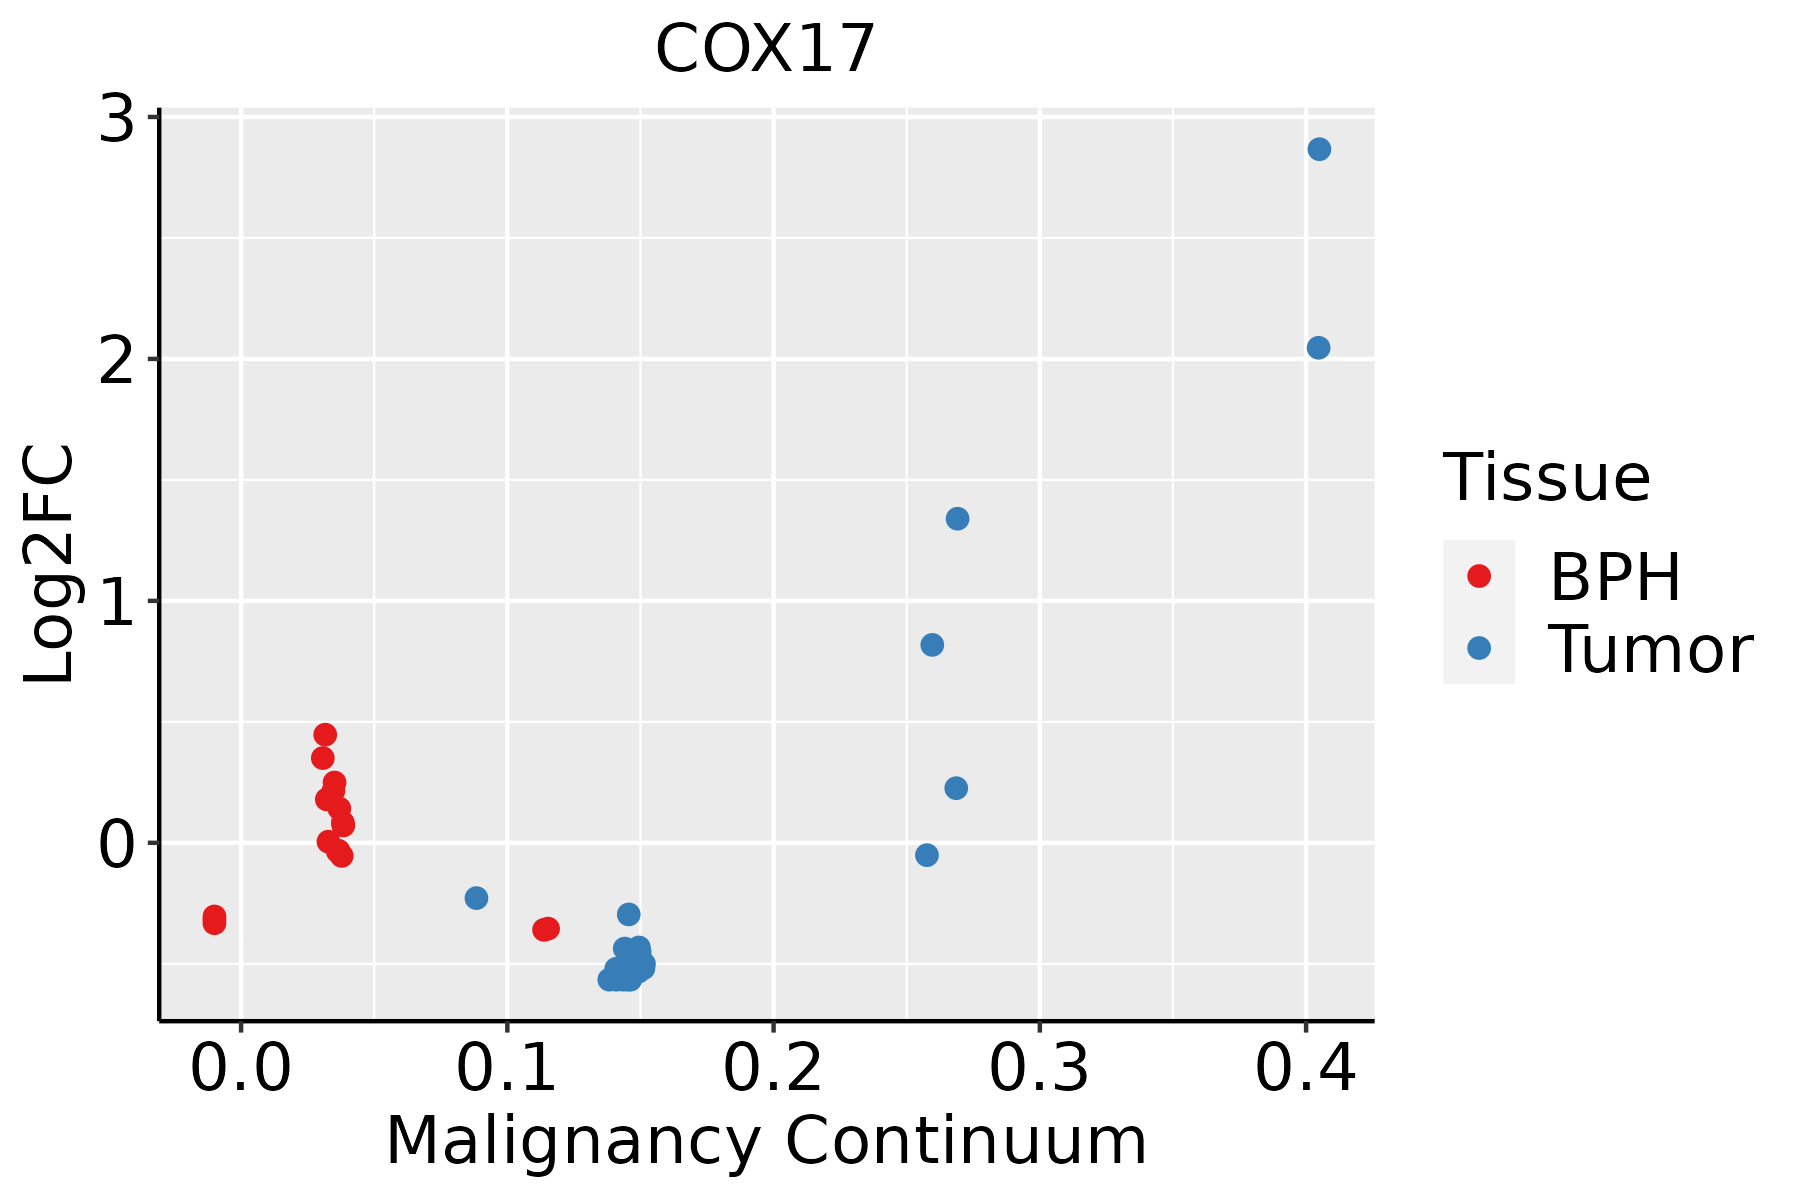 | BPH: Benign Prostatic Hyperplasia |
| Skin | 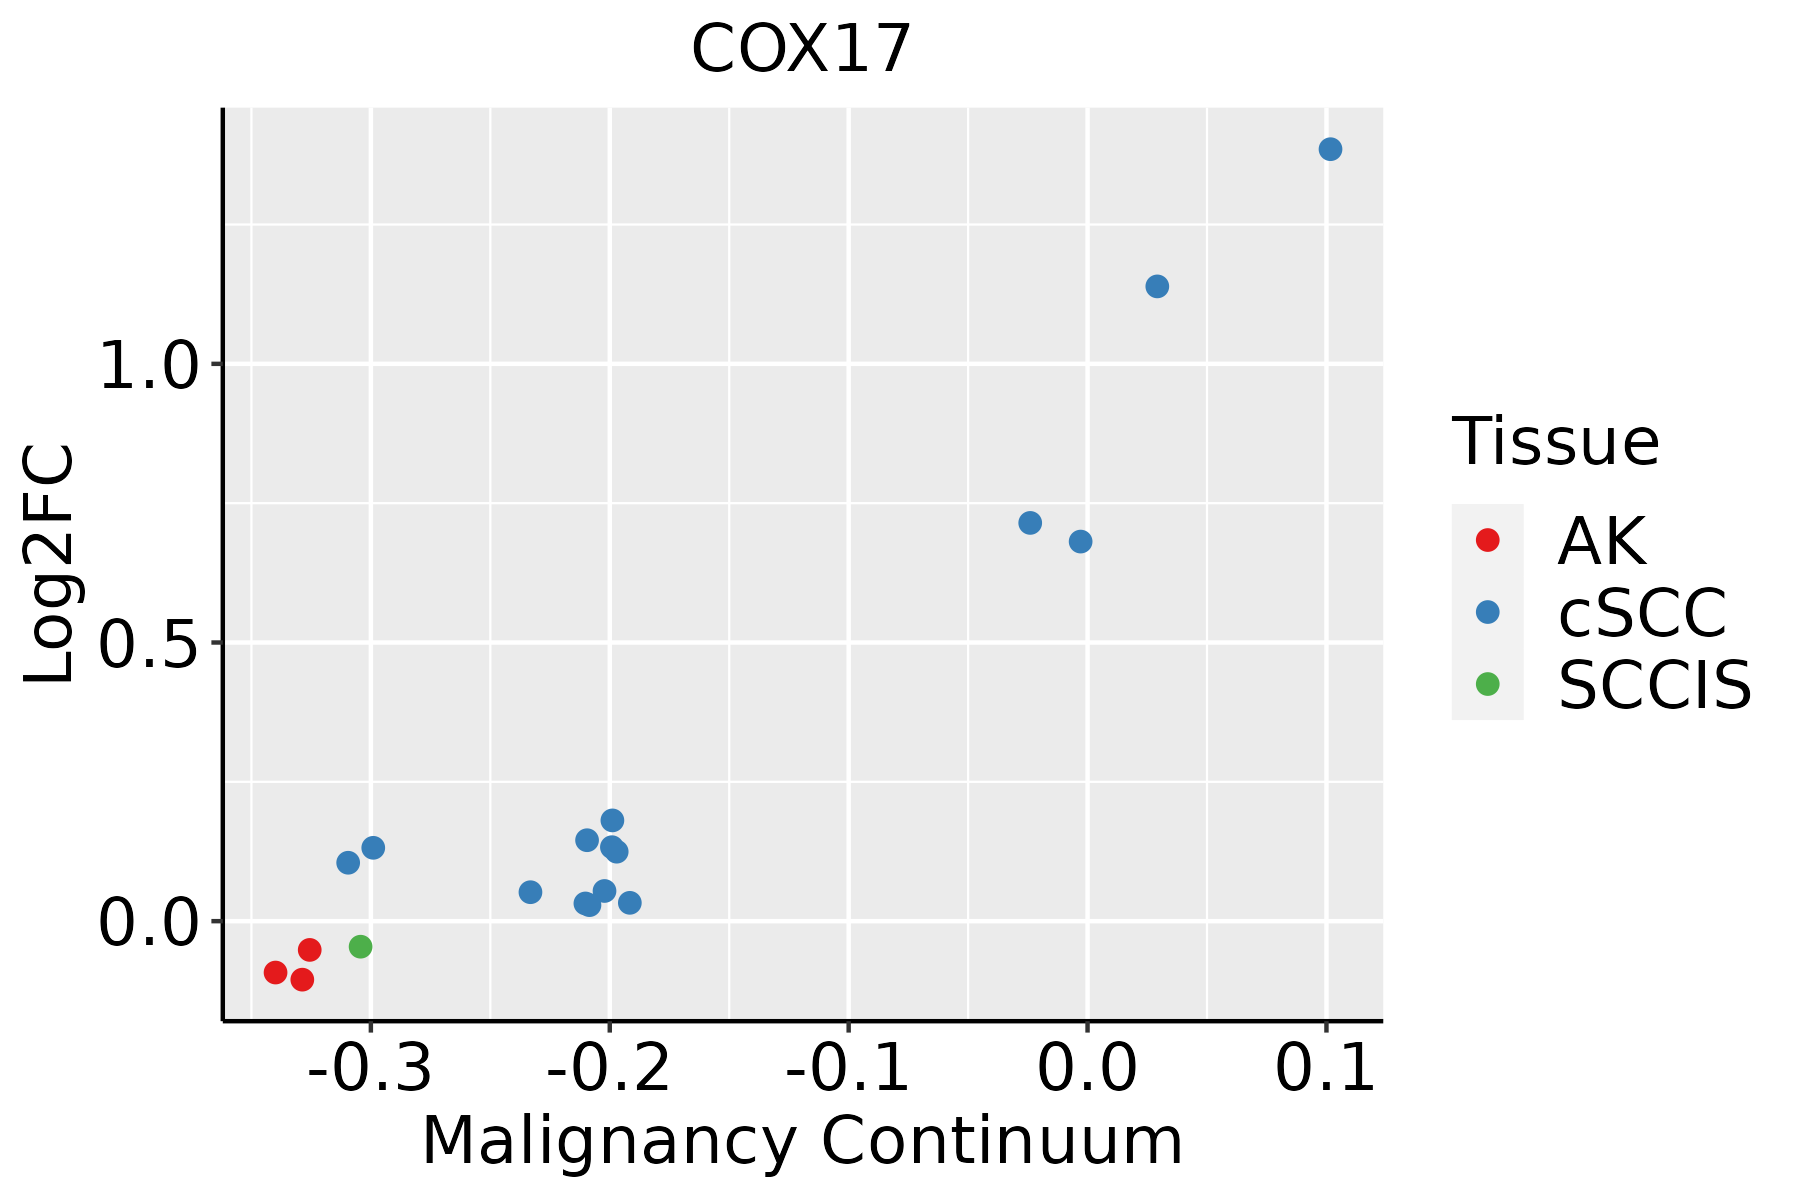 | AK: Actinic keratosis |
| cSCC: Cutaneous squamous cell carcinoma | ||
| SCCIS:squamous cell carcinoma in situ | ||
| Thyroid |  | ATC: Anaplastic thyroid cancer |
| HT: Hashimoto's thyroiditis | ||
| PTC: Papillary thyroid cancer |
| ∗log2FC in expression of this searched gene in stem-like cells from each diseased tissue sample relative to stem-like cells in normal samples in each tissue plotted against the malignancy continuum. Samples are colored based on if they are from different disease stage. |
Top |
Malignant transformation related pathway analysis |
| Find out the enriched GO biological processes and KEGG pathways involved in transition from healthy to precancer to cancer |
| Tissue | Disease Stage | Enriched GO biological Processes |
| Colorectum | AD |  |
| Colorectum | SER |  |
| Colorectum | MSS |  |
| Colorectum | MSI-H |  |
| Colorectum | FAP |  |
| ∗Top 15 enriched GO BP terms are showed in the bar plot of each disease state in each tissue. Each row represents a significant GO biological process which is colored according to the -log10(p.adjust). |
| Page: 1 2 3 4 5 6 7 8 9 |
| GO ID | Tissue | Disease Stage | Description | Gene Ratio | Bg Ratio | pvalue | p.adjust | Count |
| GO:00347644 | Breast | IDC | positive regulation of transmembrane transport | 28/1434 | 219/18723 | 5.19e-03 | 3.86e-02 | 28 |
| GO:000609123 | Breast | DCIS | generation of precursor metabolites and energy | 103/1390 | 490/18723 | 1.46e-22 | 1.65e-19 | 103 |
| GO:190260022 | Breast | DCIS | proton transmembrane transport | 40/1390 | 157/18723 | 2.77e-12 | 5.80e-10 | 40 |
| GO:003310823 | Breast | DCIS | mitochondrial respiratory chain complex assembly | 28/1390 | 93/18723 | 7.50e-11 | 9.43e-09 | 28 |
| GO:004346723 | Breast | DCIS | regulation of generation of precursor metabolites and energy | 23/1390 | 130/18723 | 8.06e-05 | 1.54e-03 | 23 |
| GO:003241121 | Breast | DCIS | positive regulation of transporter activity | 20/1390 | 120/18723 | 5.16e-04 | 6.73e-03 | 20 |
| GO:003241421 | Breast | DCIS | positive regulation of ion transmembrane transporter activity | 18/1390 | 109/18723 | 1.07e-03 | 1.17e-02 | 18 |
| GO:003476721 | Breast | DCIS | positive regulation of ion transmembrane transport | 24/1390 | 167/18723 | 1.37e-03 | 1.42e-02 | 24 |
| GO:002289822 | Breast | DCIS | regulation of transmembrane transporter activity | 35/1390 | 278/18723 | 1.50e-03 | 1.51e-02 | 35 |
| GO:004327011 | Breast | DCIS | positive regulation of ion transport | 34/1390 | 275/18723 | 2.35e-03 | 2.13e-02 | 34 |
| GO:003241212 | Breast | DCIS | regulation of ion transmembrane transporter activity | 32/1390 | 267/18723 | 4.97e-03 | 3.72e-02 | 32 |
| GO:003240912 | Breast | DCIS | regulation of transporter activity | 36/1390 | 310/18723 | 5.05e-03 | 3.74e-02 | 36 |
| GO:003476412 | Breast | DCIS | positive regulation of transmembrane transport | 27/1390 | 219/18723 | 6.47e-03 | 4.59e-02 | 27 |
| GO:00060919 | Cervix | CC | generation of precursor metabolites and energy | 105/2311 | 490/18723 | 7.40e-09 | 6.61e-07 | 105 |
| GO:19026009 | Cervix | CC | proton transmembrane transport | 39/2311 | 157/18723 | 1.23e-05 | 2.57e-04 | 39 |
| GO:00331089 | Cervix | CC | mitochondrial respiratory chain complex assembly | 26/2311 | 93/18723 | 3.97e-05 | 6.18e-04 | 26 |
| GO:00347645 | Cervix | CC | positive regulation of transmembrane transport | 40/2311 | 219/18723 | 6.97e-03 | 3.76e-02 | 40 |
| GO:0006091 | Colorectum | AD | generation of precursor metabolites and energy | 209/3918 | 490/18723 | 3.17e-28 | 6.61e-25 | 209 |
| GO:0033108 | Colorectum | AD | mitochondrial respiratory chain complex assembly | 46/3918 | 93/18723 | 8.95e-10 | 6.91e-08 | 46 |
| GO:1902600 | Colorectum | AD | proton transmembrane transport | 66/3918 | 157/18723 | 1.59e-09 | 1.17e-07 | 66 |
| Page: 1 2 3 4 5 6 7 8 |
| Pathway ID | Tissue | Disease Stage | Description | Gene Ratio | Bg Ratio | pvalue | p.adjust | qvalue | Count |
| hsa0019016 | Breast | Precancer | Oxidative phosphorylation | 59/684 | 134/8465 | 6.15e-30 | 3.24e-28 | 2.48e-28 | 59 |
| hsa0471418 | Breast | Precancer | Thermogenesis | 68/684 | 232/8465 | 4.40e-22 | 1.26e-20 | 9.69e-21 | 68 |
| hsa0019017 | Breast | Precancer | Oxidative phosphorylation | 59/684 | 134/8465 | 6.15e-30 | 3.24e-28 | 2.48e-28 | 59 |
| hsa0471419 | Breast | Precancer | Thermogenesis | 68/684 | 232/8465 | 4.40e-22 | 1.26e-20 | 9.69e-21 | 68 |
| hsa0019023 | Breast | IDC | Oxidative phosphorylation | 62/867 | 134/8465 | 4.78e-27 | 2.59e-25 | 1.94e-25 | 62 |
| hsa0471424 | Breast | IDC | Thermogenesis | 75/867 | 232/8465 | 8.41e-21 | 3.04e-19 | 2.27e-19 | 75 |
| hsa0019033 | Breast | IDC | Oxidative phosphorylation | 62/867 | 134/8465 | 4.78e-27 | 2.59e-25 | 1.94e-25 | 62 |
| hsa0471434 | Breast | IDC | Thermogenesis | 75/867 | 232/8465 | 8.41e-21 | 3.04e-19 | 2.27e-19 | 75 |
| hsa0019043 | Breast | DCIS | Oxidative phosphorylation | 61/846 | 134/8465 | 9.84e-27 | 5.30e-25 | 3.90e-25 | 61 |
| hsa0471443 | Breast | DCIS | Thermogenesis | 74/846 | 232/8465 | 8.72e-21 | 3.13e-19 | 2.30e-19 | 74 |
| hsa0019053 | Breast | DCIS | Oxidative phosphorylation | 61/846 | 134/8465 | 9.84e-27 | 5.30e-25 | 3.90e-25 | 61 |
| hsa0471453 | Breast | DCIS | Thermogenesis | 74/846 | 232/8465 | 8.72e-21 | 3.13e-19 | 2.30e-19 | 74 |
| hsa0019018 | Cervix | CC | Oxidative phosphorylation | 64/1267 | 134/8465 | 1.25e-19 | 8.07e-18 | 4.77e-18 | 64 |
| hsa0471420 | Cervix | CC | Thermogenesis | 76/1267 | 232/8465 | 4.29e-12 | 1.16e-10 | 6.85e-11 | 76 |
| hsa0019019 | Cervix | CC | Oxidative phosphorylation | 64/1267 | 134/8465 | 1.25e-19 | 8.07e-18 | 4.77e-18 | 64 |
| hsa04714110 | Cervix | CC | Thermogenesis | 76/1267 | 232/8465 | 4.29e-12 | 1.16e-10 | 6.85e-11 | 76 |
| hsa00190 | Colorectum | AD | Oxidative phosphorylation | 86/2092 | 134/8465 | 2.47e-22 | 2.76e-20 | 1.76e-20 | 86 |
| hsa04714 | Colorectum | AD | Thermogenesis | 120/2092 | 232/8465 | 2.76e-19 | 1.16e-17 | 7.37e-18 | 120 |
| hsa001901 | Colorectum | AD | Oxidative phosphorylation | 86/2092 | 134/8465 | 2.47e-22 | 2.76e-20 | 1.76e-20 | 86 |
| hsa047141 | Colorectum | AD | Thermogenesis | 120/2092 | 232/8465 | 2.76e-19 | 1.16e-17 | 7.37e-18 | 120 |
| Page: 1 2 3 4 |
Top |
Cell-cell communication analysis |
| Identification of potential cell-cell interactions between two cell types and their ligand-receptor pairs for different disease states |
| Ligand | Receptor | LRpair | Pathway | Tissue | Disease Stage |
| Page: 1 |
Top |
Single-cell gene regulatory network inference analysis |
| Find out the significant the regulons (TFs) and the target genes of each regulon across cell types for different disease states |
| TF | Cell Type | Tissue | Disease Stage | Target Gene | RSS | Regulon Activity |
| ∗The dot plots of a searched regulon are shown for all cell subpopulations in each disease state of each tissue based on the regulon specific score inferred using pySCENIC and by calculating the average expression. |
| Page: 1 |
Top |
Somatic mutation of malignant transformation related genes |
| Annotation of somatic variants for genes involved in malignant transformation |
| Hugo Symbol | Variant Class | Variant Classification | dbSNP RS | HGVSc | HGVSp | HGVSp Short | SWISSPROT | BIOTYPE | SIFT | PolyPhen | Tumor Sample Barcode | Tissue | Histology | Sex | Age | Stage | Therapy Types | Drugs | Outcome |
| COX17 | SNV | Missense_Mutation | novel | c.100G>C | p.Asp34His | p.D34H | Q14061 | protein_coding | deleterious(0) | probably_damaging(1) | TCGA-AQ-A7U7-01 | Breast | breast invasive carcinoma | Female | <65 | III/IV | Targeted Molecular therapy | rituximab | CR |
| COX17 | SNV | Missense_Mutation | novel | c.44A>G | p.Gln15Arg | p.Q15R | Q14061 | protein_coding | tolerated(0.24) | benign(0.124) | TCGA-AP-A1DK-01 | Endometrium | uterine corpus endometrioid carcinoma | Female | <65 | I/II | Unknown | Unknown | SD |
| COX17 | SNV | Missense_Mutation | novel | c.118A>G | p.Lys40Glu | p.K40E | Q14061 | protein_coding | tolerated(0.13) | possibly_damaging(0.524) | TCGA-AX-A0J1-01 | Endometrium | uterine corpus endometrioid carcinoma | Female | >=65 | I/II | Unknown | Unknown | SD |
| COX17 | SNV | Missense_Mutation | c.115G>A | p.Glu39Lys | p.E39K | Q14061 | protein_coding | tolerated(0.07) | possibly_damaging(0.857) | TCGA-B5-A0JY-01 | Endometrium | uterine corpus endometrioid carcinoma | Female | <65 | III/IV | Chemotherapy | doxorubicin | SD | |
| COX17 | SNV | Missense_Mutation | novel | c.104N>T | p.Ala35Val | p.A35V | Q14061 | protein_coding | tolerated(0.12) | benign(0.01) | TCGA-SJ-A6ZI-01 | Endometrium | uterine corpus endometrioid carcinoma | Female | <65 | I/II | Unknown | Unknown | SD |
| COX17 | SNV | Missense_Mutation | novel | c.10N>G | p.Leu4Val | p.L4V | Q14061 | protein_coding | tolerated(0.46) | benign(0.001) | TCGA-CR-6480-01 | Oral cavity | head & neck squamous cell carcinoma | Male | <65 | I/II | Chemotherapy | paclitaxel | SD |
| Page: 1 |
Top |
Related drugs of malignant transformation related genes |
| Identification of chemicals and drugs interact with genes involved in malignant transfromation |
| (DGIdb 4.0) |
| Entrez ID | Symbol | Category | Interaction Types | Drug Claim Name | Drug Name | PMIDs |
| Page: 1 |

Copyright 2023-Present -The University of Texas Health Science Center at Houston |