Schematic overview of the cellular and molecular mechanisms involved in the cancer progression, including the proposed cellular and molecular mechanisms in cancer cells trajectory. AT1: alveolar type 1 cells; AT2: alveolar type 2 cells; AAH: atypical adenomatous hyperplasia; AIS: adenocarcinoma in situ; MIA: minimally invasive adenocarcinoma; IA: invasive adenocarcinoma; EMT: epithelial-mesenchymal transition

Home

Download

Statistics

Help

Contact

Center for Computational Systems Medicine
leaf

Gene summary

leaf

Malignant transformation analysis

leaf

Malignant transformation related pathway analysis

leaf

Cell-cell communication analysis

leaf

Single-cell gene regulatory network inference analysis

leaf

Somatic mutation of malignant transformation related genes

leaf

Related drugs of malignant transformation related genes

Gene: COPG2

Gene summary for COPG2

check button Gene summary.

Gene informationSpeciesHuman
Gene symbol

COPG2

Gene ID

26958

Gene nameCOPI coat complex subunit gamma 2
Gene Alias2-COP
Cytomap7q32.2
Gene Typeprotein-coding
GO ID

GO:0006810

UniProtAcc

Q9NSM7


Top

Malignant transformation analysis

check button Identification of the aberrant gene expression in precancerous and cancerous lesions by comparing the gene expression of stem-like cells in diseased tissues with normal stem cells
check button Malignant transformation involving gene list.
Entrez IDSymbolReplicatesSpeciesOrganTissueAdj P-valueLog2FCMalignancy
26958COPG2HTA11_78_2000001011HumanColorectumAD3.10e-034.17e-01-0.1088
26958COPG2HTA11_347_2000001011HumanColorectumAD2.76e-095.88e-01-0.1954
26958COPG2HTA11_696_2000001011HumanColorectumAD2.29e-022.81e-01-0.1464
26958COPG2HTA11_866_2000001011HumanColorectumAD1.30e-074.77e-01-0.1001
26958COPG2HTA11_1391_2000001011HumanColorectumAD1.63e-034.60e-01-0.059
26958COPG2HTA11_10623_2000001011HumanColorectumAD3.87e-046.97e-01-0.0177
26958COPG2HTA11_7696_3000711011HumanColorectumAD4.34e-247.59e-010.0674
26958COPG2HTA11_99999970781_79442HumanColorectumMSS6.47e-033.35e-010.294
26958COPG2HTA11_99999965104_69814HumanColorectumMSS2.64e-201.15e+000.281
26958COPG2A015-C-203HumanColorectumFAP4.72e-03-1.78e-01-0.1294
26958COPG2A002-C-205HumanColorectumFAP3.60e-03-1.69e-01-0.1236
26958COPG2A015-C-006HumanColorectumFAP3.53e-02-2.19e-01-0.0994
26958COPG2A002-C-114HumanColorectumFAP3.41e-04-2.54e-01-0.1561
26958COPG2A015-C-104HumanColorectumFAP4.21e-04-2.41e-01-0.1899
26958COPG2A002-C-116HumanColorectumFAP2.67e-03-2.15e-01-0.0452
26958COPG2A018-E-020HumanColorectumFAP1.20e-04-2.37e-01-0.2034
26958COPG2LZE4THumanEsophagusESCC3.08e-021.63e-010.0811
26958COPG2LZE7THumanEsophagusESCC4.54e-042.98e-010.0667
26958COPG2LZE20THumanEsophagusESCC1.09e-021.88e-010.0662
26958COPG2LZE24THumanEsophagusESCC6.53e-112.78e-010.0596
Page: 1 2 3 4 5 

check button Transcriptomic changes along malignancy continuum.
TissueExpression DynamicsAbbreviation
Colorectum (GSE201348)The image shows the transcriptomic changes along malignancy continuum.log2FC in expression of this searched gene in stem-like cells from each diseased tissue sample relative to stem-like cells in normal samples in each tissue plotted against the malignancy continuum. Samples are colored based on if they are from different disease stage.FAP: Familial adenomatous polyposis
CRC: Colorectal cancer
Colorectum (HTA11)The image shows the transcriptomic changes along malignancy continuum.log2FC in expression of this searched gene in stem-like cells from each diseased tissue sample relative to stem-like cells in normal samples in each tissue plotted against the malignancy continuum. Samples are colored based on if they are from different disease stage.AD: Adenomas
SER: Sessile serrated lesions
MSI-H: Microsatellite-high colorectal cancer
MSS: Microsatellite stable colorectal cancer
EsophagusThe image shows the transcriptomic changes along malignancy continuum.log2FC in expression of this searched gene in stem-like cells from each diseased tissue sample relative to stem-like cells in normal samples in each tissue plotted against the malignancy continuum. Samples are colored based on if they are from different disease stage.
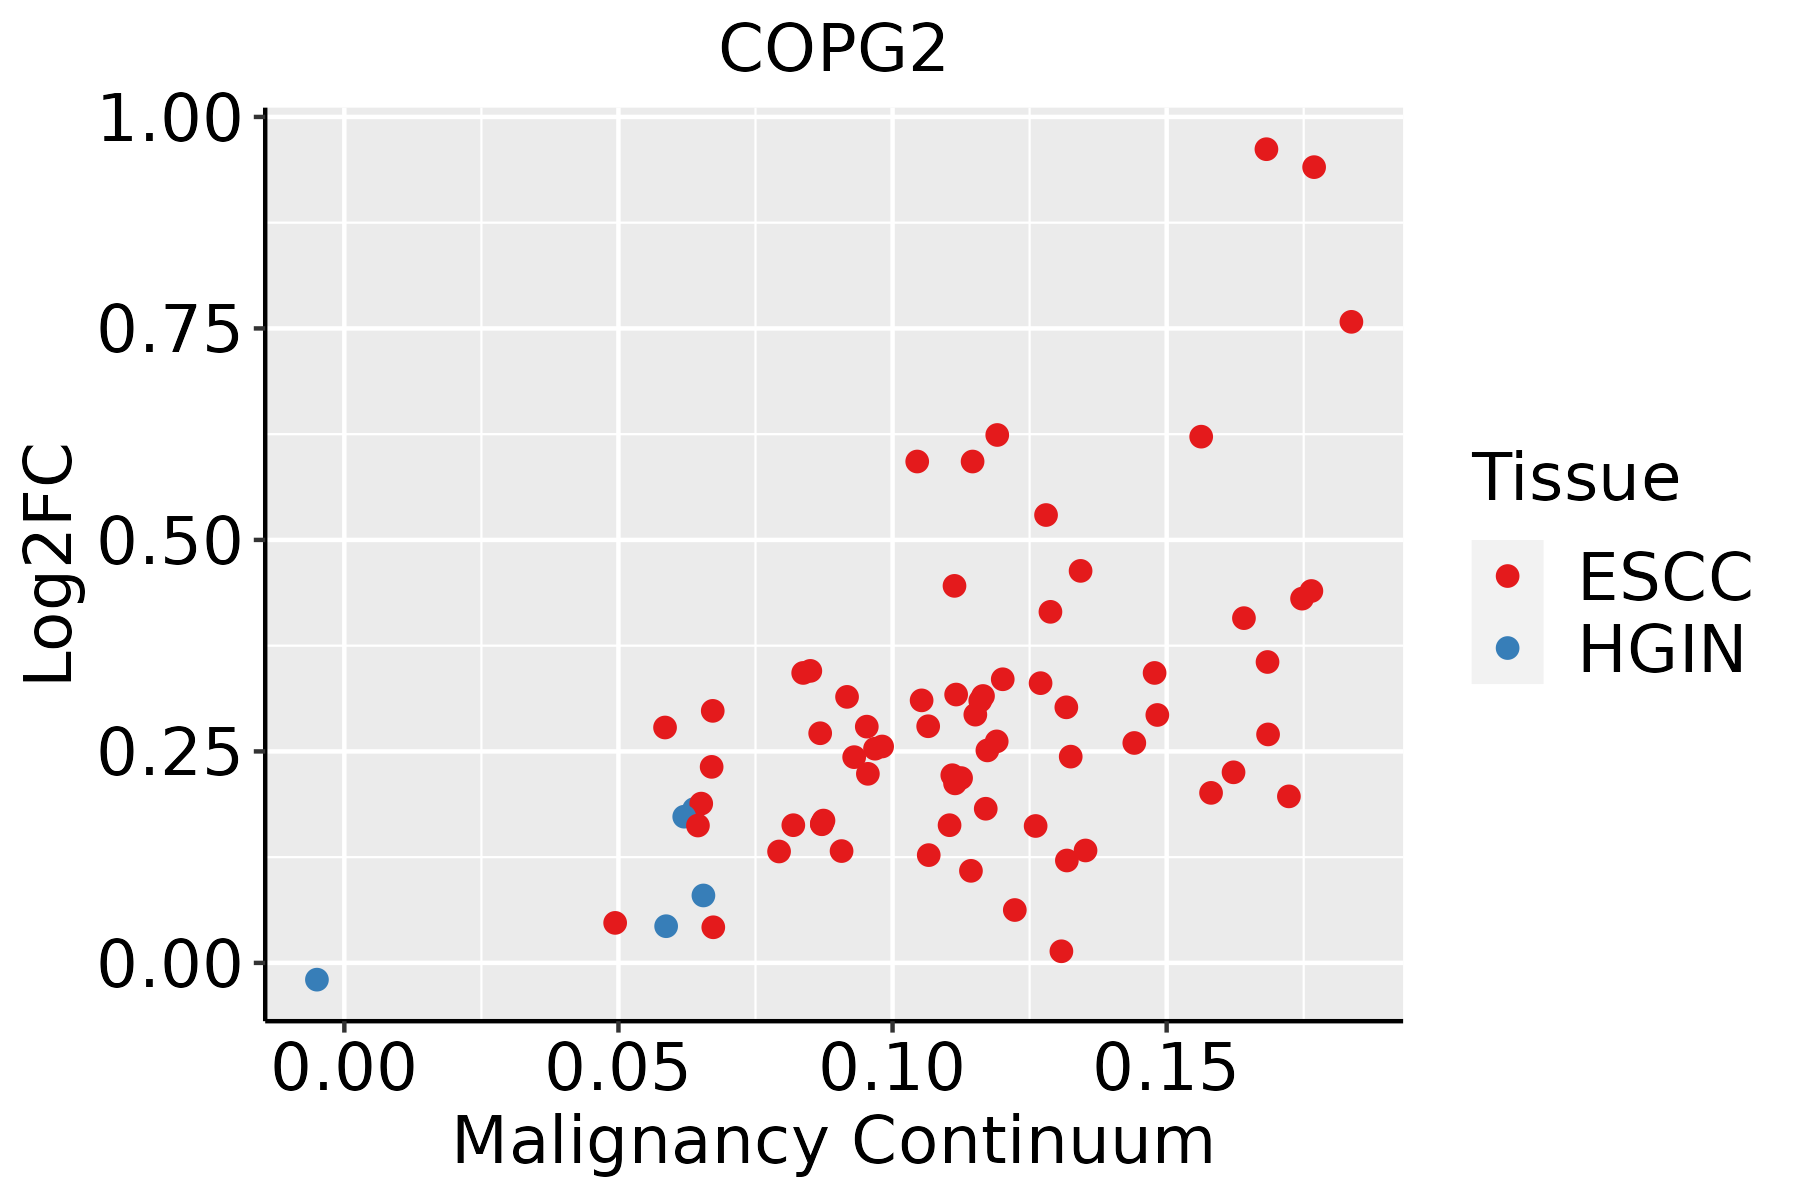
ESCC: Esophageal squamous cell carcinoma
HGIN: High-grade intraepithelial neoplasias
LGIN: Low-grade intraepithelial neoplasias
Oral CavityThe image shows the transcriptomic changes along malignancy continuum.log2FC in expression of this searched gene in stem-like cells from each diseased tissue sample relative to stem-like cells in normal samples in each tissue plotted against the malignancy continuum. Samples are colored based on if they are from different disease stage.
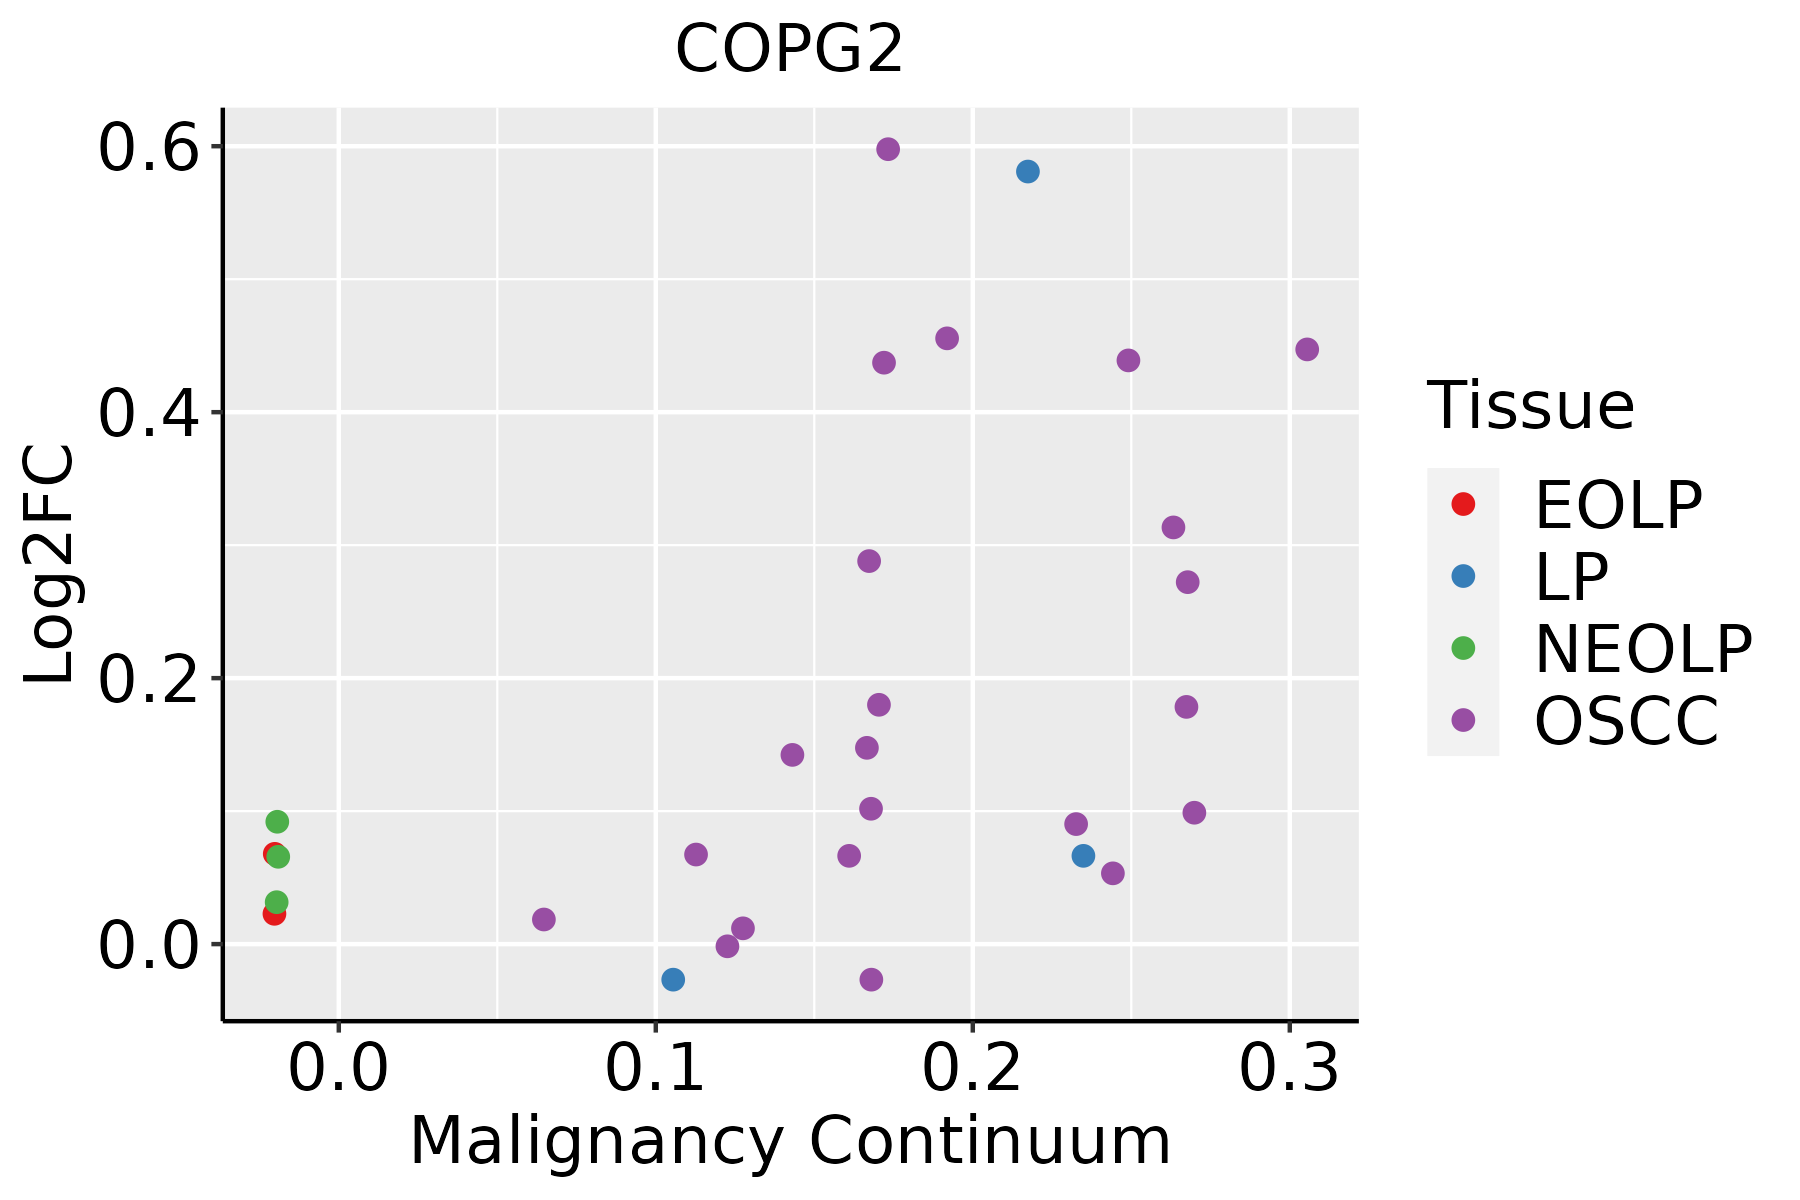
EOLP: Erosive Oral lichen planus
LP: leukoplakia
NEOLP: Non-erosive oral lichen planus
OSCC: Oral squamous cell carcinoma
∗log2FC in expression of this searched gene in stem-like cells from each diseased tissue sample relative to stem-like cells in normal samples in each tissue plotted against the malignancy continuum. Samples are colored based on if they are from different disease stage.

Top

Malignant transformation related pathway analysis

check buttonFind out the enriched GO biological processes and KEGG pathways involved in transition from healthy to precancer to cancer
check button Figure of enriched GO biological processes.
TissueDisease StageEnriched GO biological Processes
ColorectumADGO analysis - Figure of enriched GO biological processes: Top 15 enriched GO BP terms are showed in the bar plot of each disease state in each tissue. Each row represents a significant GO biological process which is colored according to the -log10(p.adjust).
ColorectumSERGO analysis - Figure of enriched GO biological processes: Top 15 enriched GO BP terms are showed in the bar plot of each disease state in each tissue. Each row represents a significant GO biological process which is colored according to the -log10(p.adjust).
ColorectumMSSGO analysis - Figure of enriched GO biological processes: Top 15 enriched GO BP terms are showed in the bar plot of each disease state in each tissue. Each row represents a significant GO biological process which is colored according to the -log10(p.adjust).
ColorectumMSI-HGO analysis - Figure of enriched GO biological processes: Top 15 enriched GO BP terms are showed in the bar plot of each disease state in each tissue. Each row represents a significant GO biological process which is colored according to the -log10(p.adjust).
ColorectumFAPGO analysis - Figure of enriched GO biological processes: Top 15 enriched GO BP terms are showed in the bar plot of each disease state in each tissue. Each row represents a significant GO biological process which is colored according to the -log10(p.adjust).
∗Top 15 enriched GO BP terms are showed in the bar plot of each disease state in each tissue. Each row represents a significant GO biological process which is colored according to the -log10(p.adjust).
Page: 1 2 3 4 5 6 7 8 9 

check button Enriched GO biological processes.
GO IDTissueDisease StageDescriptionGene RatioBg Ratiopvaluep.adjustCount
GO:00355923ColorectumFAPestablishment of protein localization to extracellular region79/2622360/187232.48e-055.77e-0479
GO:00716923ColorectumFAPprotein localization to extracellular region79/2622368/187235.50e-051.10e-0379
GO:00307053ColorectumFAPcytoskeleton-dependent intracellular transport47/2622195/187231.06e-041.76e-0347
GO:00068904ColorectumFAPretrograde vesicle-mediated transport, Golgi to endoplasmic reticulum18/262252/187231.48e-042.29e-0318
GO:00723841ColorectumFAPorganelle transport along microtubule22/262285/187232.66e-032.07e-0222
GO:00068884ColorectumFAPendoplasmic reticulum to Golgi vesicle-mediated transport30/2622130/187233.51e-032.53e-0230
GO:004819318EsophagusESCCGolgi vesicle transport231/8552296/187231.82e-309.63e-28231
GO:005165617EsophagusESCCestablishment of organelle localization273/8552390/187239.13e-231.81e-20273
GO:000688815EsophagusESCCendoplasmic reticulum to Golgi vesicle-mediated transport102/8552130/187231.73e-149.22e-13102
GO:000689017EsophagusESCCretrograde vesicle-mediated transport, Golgi to endoplasmic reticulum46/855252/187231.23e-103.66e-0946
GO:003070518EsophagusESCCcytoskeleton-dependent intracellular transport133/8552195/187231.48e-104.27e-09133
GO:001097013EsophagusESCCtransport along microtubule107/8552155/187233.17e-096.80e-08107
GO:00723846EsophagusESCCorganelle transport along microtubule65/855285/187236.61e-091.35e-0765
GO:00991114EsophagusESCCmicrotubule-based transport115/8552190/187232.54e-052.15e-04115
GO:00068914EsophagusESCCintra-Golgi vesicle-mediated transport26/855233/187231.06e-047.43e-0426
GO:000930617EsophagusESCCprotein secretion190/8552359/187233.22e-031.34e-02190
GO:003559217EsophagusESCCestablishment of protein localization to extracellular region190/8552360/187233.77e-031.53e-02190
GO:007169210EsophagusESCCprotein localization to extracellular region193/8552368/187235.01e-031.92e-02193
GO:004819315Oral cavityOSCCGolgi vesicle transport209/7305296/187231.39e-286.30e-26209
GO:005165610Oral cavityOSCCestablishment of organelle localization239/7305390/187232.46e-193.31e-17239
Page: 1 2 3 

check button Enriched KEGG pathways.
Pathway IDTissueDisease StageDescriptionGene RatioBg Ratiopvaluep.adjustqvalueCount
Page: 1 

Top

Cell-cell communication analysis

check buttonIdentification of potential cell-cell interactions between two cell types and their ligand-receptor pairs for different disease states
LigandReceptorLRpairPathwayTissueDisease Stage
Page: 1 

Top

Single-cell gene regulatory network inference analysis

check buttonFind out the significant the regulons (TFs) and the target genes of each regulon across cell types for different disease states
TFCell TypeTissueDisease StageTarget GeneRSSRegulon Activity
∗The dot plots of a searched regulon are shown for all cell subpopulations in each disease state of each tissue based on the regulon specific score inferred using pySCENIC and by calculating the average expression.
Page: 1 

Top

Somatic mutation of malignant transformation related genes

check buttonAnnotation of somatic variants for genes involved in malignant transformation
Hugo SymbolVariant ClassVariant ClassificationdbSNP RSHGVScHGVSpHGVSp ShortSWISSPROTBIOTYPESIFTPolyPhenTumor Sample BarcodeTissueHistologySexAgeStageTherapy TypesDrugsOutcome
COPG2SNVMissense_Mutationrs782187967c.290N>Ap.Thr97Asnp.T97NQ9UBF2protein_codingtolerated(0.51)benign(0.005)TCGA-A2-A0D0-01Breastbreast invasive carcinomaFemale<65I/IIChemotherapycytoxanSD
COPG2SNVMissense_Mutationc.234A>Cp.Gln78Hisp.Q78HQ9UBF2protein_codingdeleterious(0)probably_damaging(1)TCGA-A2-A0EQ-01Breastbreast invasive carcinomaFemale<65I/IIChemotherapyadriamycinSD
COPG2SNVMissense_Mutationc.724N>Cp.Glu242Glnp.E242QQ9UBF2protein_codingdeleterious(0.02)possibly_damaging(0.644)TCGA-AC-A23H-01Breastbreast invasive carcinomaFemale>=65I/IIUnknownUnknownPD
COPG2SNVMissense_Mutationrs372285287c.2606C>Ap.Ser869Tyrp.S869YQ9UBF2protein_codingdeleterious(0)probably_damaging(0.956)TCGA-AN-A046-01Breastbreast invasive carcinomaFemale>=65I/IIUnknownUnknownSD
COPG2SNVMissense_Mutationrs782187967c.290N>Ap.Thr97Asnp.T97NQ9UBF2protein_codingtolerated(0.51)benign(0.005)TCGA-BH-A0BG-01Breastbreast invasive carcinomaFemale>=65I/IIUnknownUnknownSD
COPG2SNVMissense_Mutationrs782187967c.290N>Ap.Thr97Asnp.T97NQ9UBF2protein_codingtolerated(0.51)benign(0.005)TCGA-C8-A12X-01Breastbreast invasive carcinomaFemale<65I/IIUnknownUnknownSD
COPG2SNVMissense_Mutationnovelc.2275N>Cp.Asp759Hisp.D759HQ9UBF2protein_codingdeleterious(0)probably_damaging(1)TCGA-E2-A1B1-01Breastbreast invasive carcinomaFemale<65I/IIOther, specify in notesbiphosphonatezoledronicSD
COPG2SNVMissense_Mutationc.421N>Ap.Glu141Lysp.E141KQ9UBF2protein_codingdeleterious(0)probably_damaging(1)TCGA-E9-A1N9-01Breastbreast invasive carcinomaFemale<65I/IIChemotherapydoxorubicinSD
COPG2insertionFrame_Shift_Insnovelc.84dupAp.Gln29ThrfsTer8p.Q29Tfs*8Q9UBF2protein_codingTCGA-S3-AA11-01Breastbreast invasive carcinomaFemale>=65I/IIHormone TherapyletrozoleCR
COPG2SNVMissense_Mutationc.28N>Ap.Glu10Lysp.E10KQ9UBF2protein_codingdeleterious(0)benign(0.223)TCGA-WL-A834-01Cervixcervical & endocervical cancerFemale<65I/IIChemotherapypaclitaxelSD
Page: 1 2 3 4 

Top

Related drugs of malignant transformation related genes

check buttonIdentification of chemicals and drugs interact with genes involved in malignant transfromation
(DGIdb 4.0)
Entrez IDSymbolCategoryInteraction TypesDrug Claim NameDrug NamePMIDs
Page: 1