Schematic overview of the cellular and molecular mechanisms involved in the cancer progression, including the proposed cellular and molecular mechanisms in cancer cells trajectory. AT1: alveolar type 1 cells; AT2: alveolar type 2 cells; AAH: atypical adenomatous hyperplasia; AIS: adenocarcinoma in situ; MIA: minimally invasive adenocarcinoma; IA: invasive adenocarcinoma; EMT: epithelial-mesenchymal transition

Home

Download

Statistics

Help

Contact

Center for Computational Systems Medicine
leaf

Gene summary

leaf

Malignant transformation analysis

leaf

Malignant transformation related pathway analysis

leaf

Cell-cell communication analysis

leaf

Single-cell gene regulatory network inference analysis

leaf

Somatic mutation of malignant transformation related genes

leaf

Related drugs of malignant transformation related genes

Gene: COPB2

Gene summary for COPB2

check button Gene summary.

Gene informationSpeciesHuman
Gene symbol

COPB2

Gene ID

9276

Gene nameCOPI coat complex subunit beta 2
Gene AliasMCPH19
Cytomap3q23
Gene Typeprotein-coding
GO ID

GO:0006810

UniProtAcc

P35606


Top

Malignant transformation analysis

check button Identification of the aberrant gene expression in precancerous and cancerous lesions by comparing the gene expression of stem-like cells in diseased tissues with normal stem cells
check button Malignant transformation involving gene list.
Entrez IDSymbolReplicatesSpeciesOrganTissueAdj P-valueLog2FCMalignancy
9276COPB2GSM4909281HumanBreastIDC5.69e-063.50e-010.21
9276COPB2GSM4909285HumanBreastIDC2.80e-104.07e-010.21
9276COPB2GSM4909293HumanBreastIDC2.20e-124.03e-010.1581
9276COPB2GSM4909296HumanBreastIDC6.81e-05-1.55e-010.1524
9276COPB2GSM4909297HumanBreastIDC6.52e-04-1.14e-010.1517
9276COPB2GSM4909304HumanBreastIDC5.49e-032.65e-010.1636
9276COPB2GSM4909311HumanBreastIDC2.15e-14-1.26e-010.1534
9276COPB2GSM4909312HumanBreastIDC1.44e-054.00e-020.1552
9276COPB2GSM4909319HumanBreastIDC1.38e-14-1.64e-010.1563
9276COPB2GSM4909321HumanBreastIDC1.75e-06-1.36e-010.1559
9276COPB2brca2HumanBreastPrecancer1.37e-093.29e-01-0.024
9276COPB2brca3HumanBreastPrecancer2.79e-032.58e-01-0.0263
9276COPB2NCCBC14HumanBreastDCIS2.54e-145.67e-010.2021
9276COPB2P1HumanBreastIDC1.11e-03-1.50e-020.1527
9276COPB2P2HumanBreastIDC6.53e-074.89e-010.21
9276COPB2DCIS2HumanBreastDCIS4.64e-603.00e-010.0085
9276COPB2HTA11_347_2000001011HumanColorectumAD7.55e-064.27e-01-0.1954
9276COPB2HTA11_99999970781_79442HumanColorectumMSS2.46e-054.72e-010.294
9276COPB2A015-C-203HumanColorectumFAP2.64e-08-1.64e-01-0.1294
9276COPB2A001-C-108HumanColorectumFAP1.73e-021.15e-02-0.0272
Page: 1 2 3 4 5 6 7 8 9 10 

check button Transcriptomic changes along malignancy continuum.
TissueExpression DynamicsAbbreviation
BreastThe image shows the transcriptomic changes along malignancy continuum.log2FC in expression of this searched gene in stem-like cells from each diseased tissue sample relative to stem-like cells in normal samples in each tissue plotted against the malignancy continuum. Samples are colored based on if they are from different disease stage.
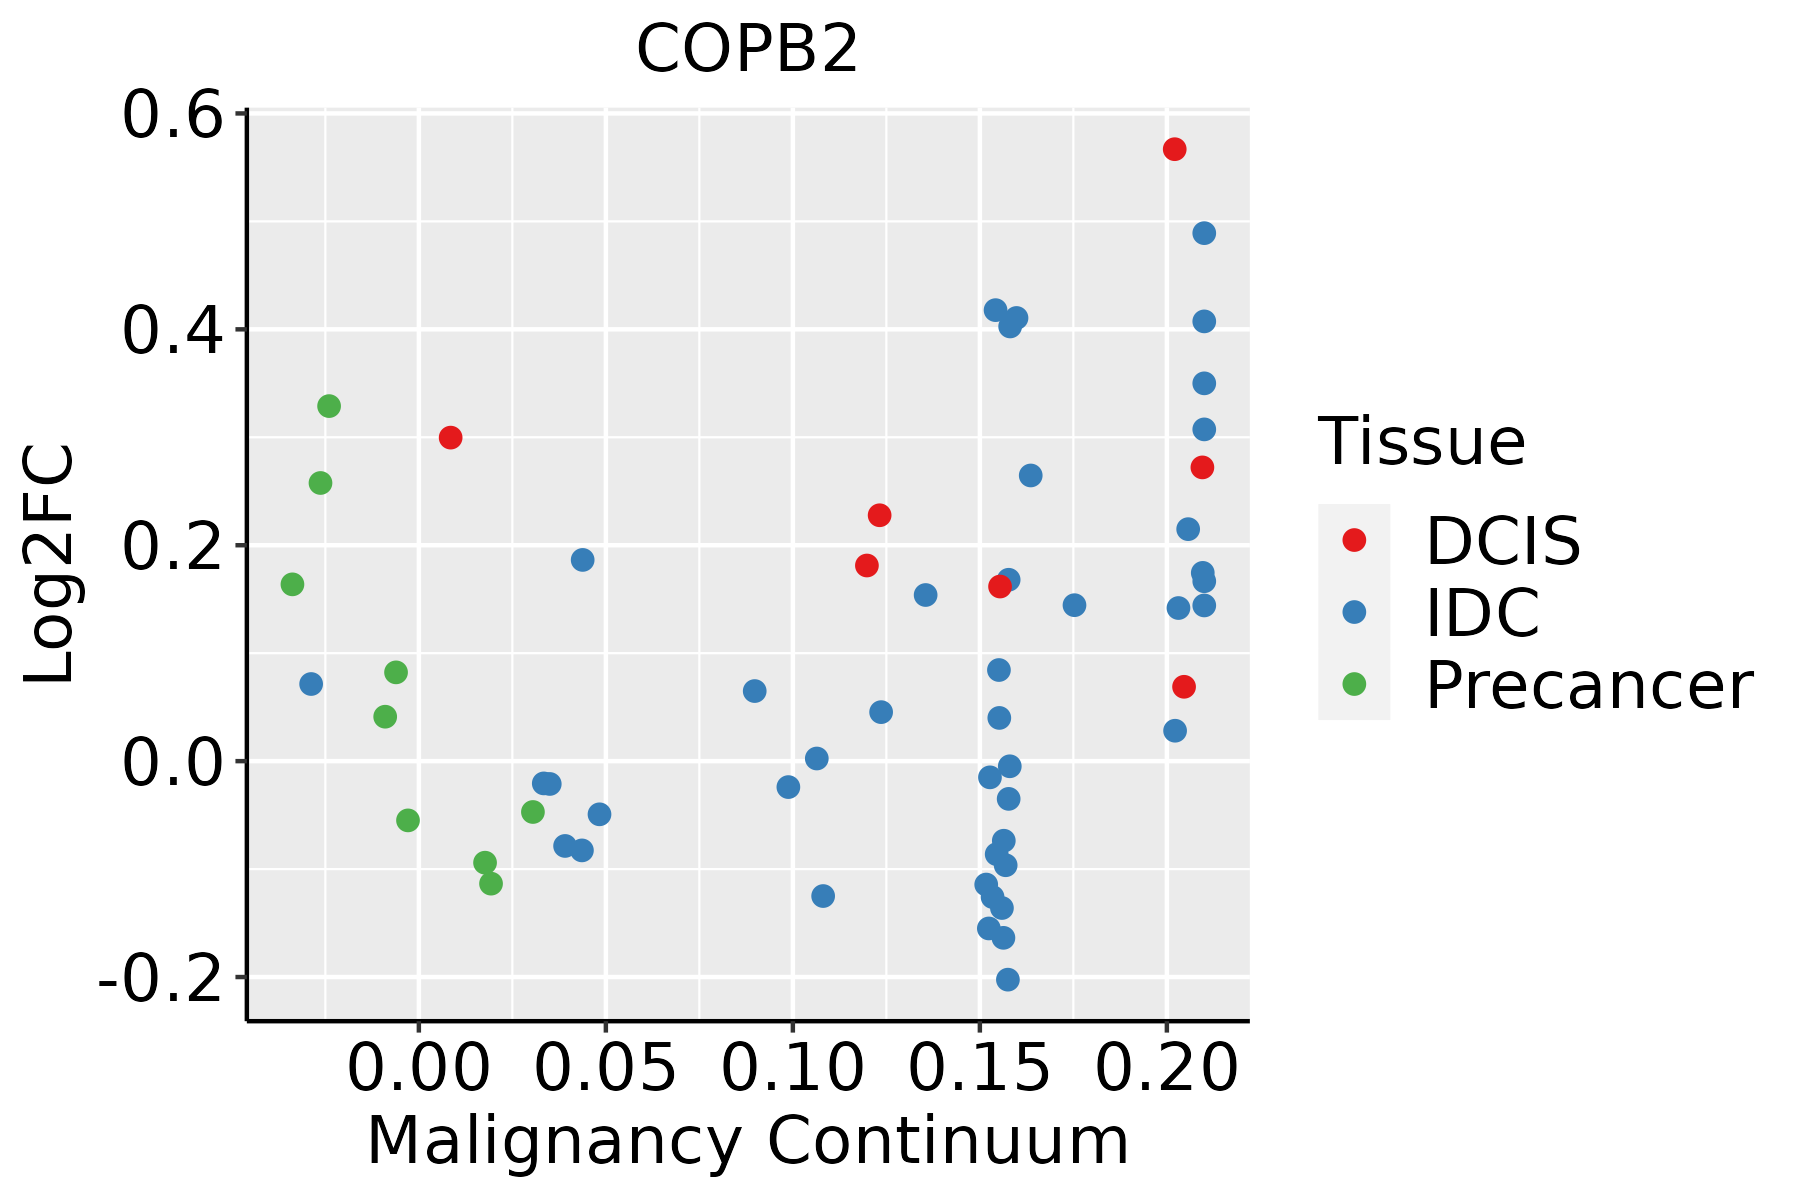
IDC: Invasive ductal carcinoma
DCIS: Ductal carcinoma in situ
Precancer(BRCA1-mut): Precancerous lesion from BRCA1 mutation carriers
Colorectum (GSE201348)The image shows the transcriptomic changes along malignancy continuum.log2FC in expression of this searched gene in stem-like cells from each diseased tissue sample relative to stem-like cells in normal samples in each tissue plotted against the malignancy continuum. Samples are colored based on if they are from different disease stage.FAP: Familial adenomatous polyposis
CRC: Colorectal cancer
Colorectum (HTA11)The image shows the transcriptomic changes along malignancy continuum.log2FC in expression of this searched gene in stem-like cells from each diseased tissue sample relative to stem-like cells in normal samples in each tissue plotted against the malignancy continuum. Samples are colored based on if they are from different disease stage.AD: Adenomas
SER: Sessile serrated lesions
MSI-H: Microsatellite-high colorectal cancer
MSS: Microsatellite stable colorectal cancer
EsophagusThe image shows the transcriptomic changes along malignancy continuum.log2FC in expression of this searched gene in stem-like cells from each diseased tissue sample relative to stem-like cells in normal samples in each tissue plotted against the malignancy continuum. Samples are colored based on if they are from different disease stage.
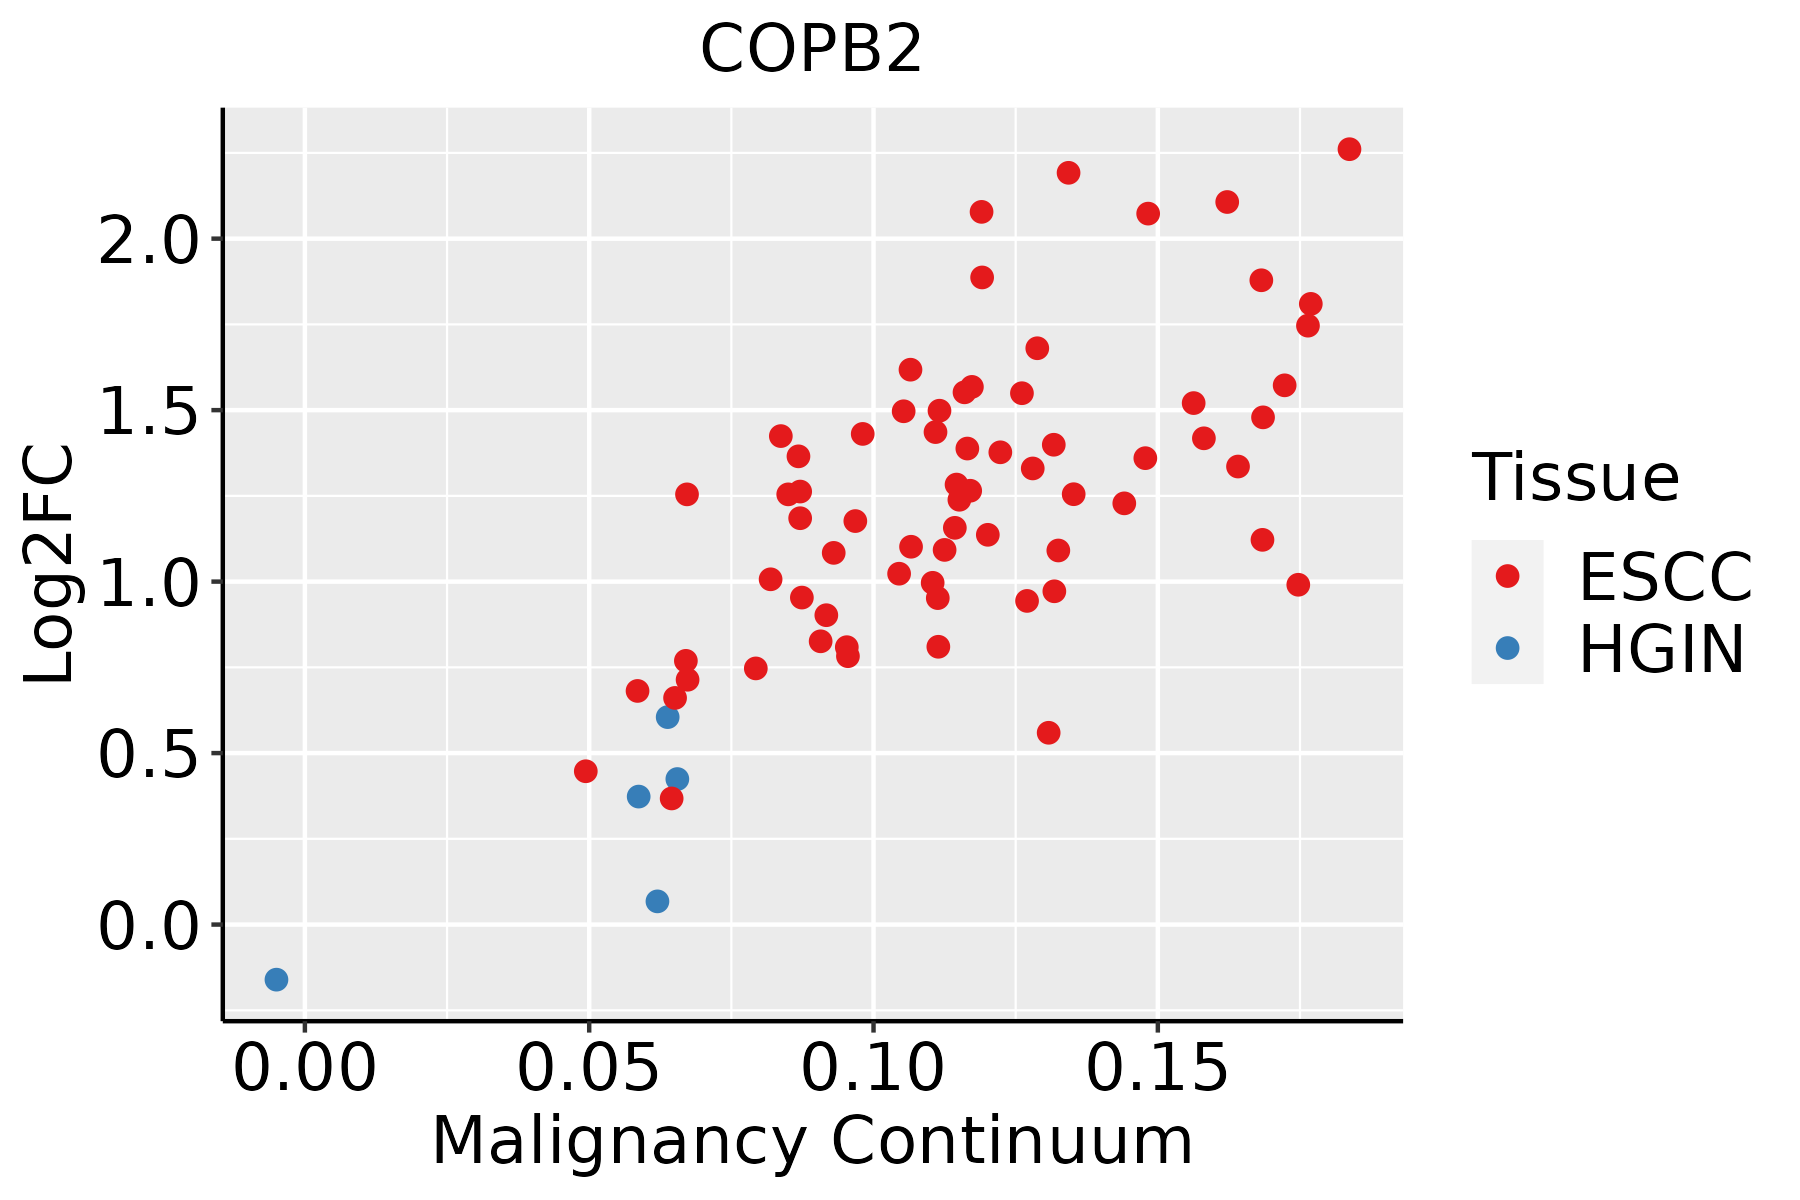
ESCC: Esophageal squamous cell carcinoma
HGIN: High-grade intraepithelial neoplasias
LGIN: Low-grade intraepithelial neoplasias
LiverThe image shows the transcriptomic changes along malignancy continuum.log2FC in expression of this searched gene in stem-like cells from each diseased tissue sample relative to stem-like cells in normal samples in each tissue plotted against the malignancy continuum. Samples are colored based on if they are from different disease stage.
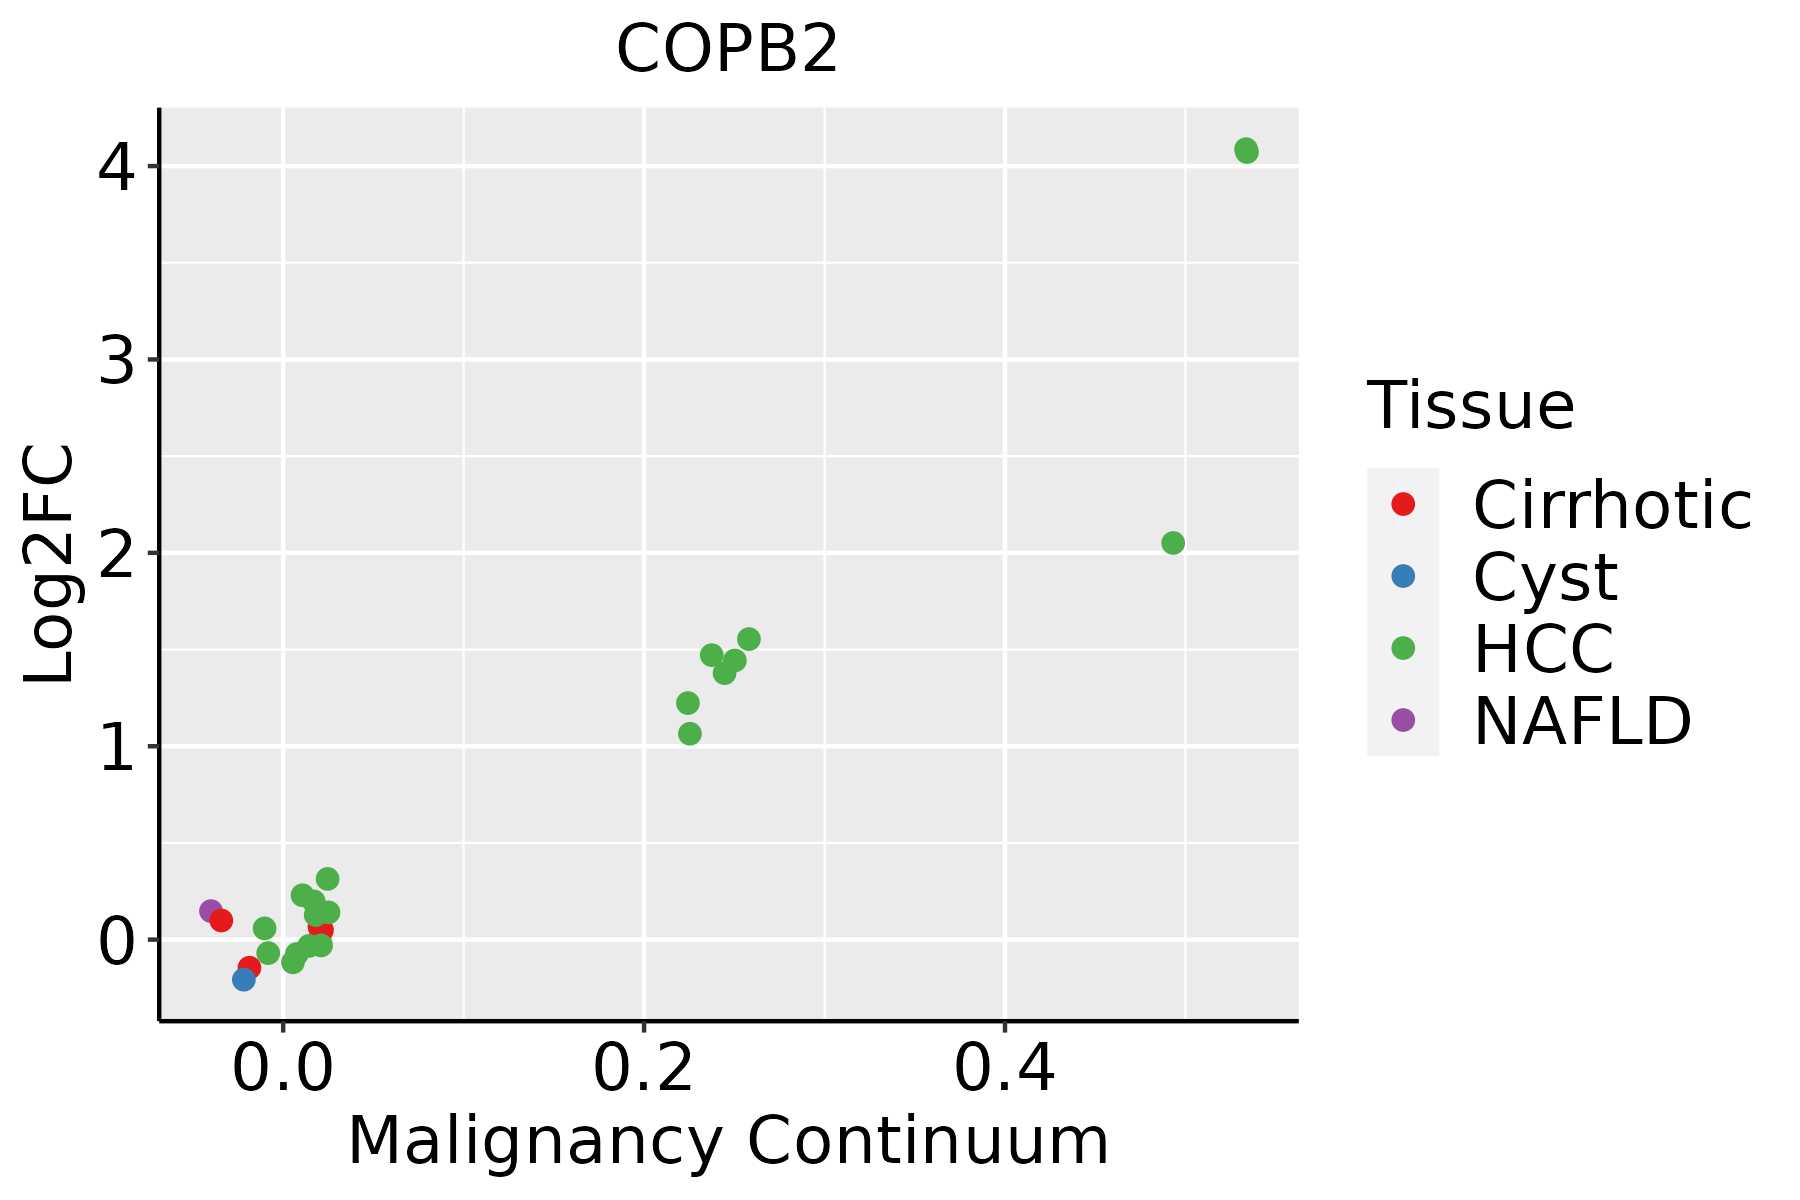
HCC: Hepatocellular carcinoma
NAFLD: Non-alcoholic fatty liver disease
Oral CavityThe image shows the transcriptomic changes along malignancy continuum.log2FC in expression of this searched gene in stem-like cells from each diseased tissue sample relative to stem-like cells in normal samples in each tissue plotted against the malignancy continuum. Samples are colored based on if they are from different disease stage.EOLP: Erosive Oral lichen planus
LP: leukoplakia
NEOLP: Non-erosive oral lichen planus
OSCC: Oral squamous cell carcinoma
ProstateThe image shows the transcriptomic changes along malignancy continuum.log2FC in expression of this searched gene in stem-like cells from each diseased tissue sample relative to stem-like cells in normal samples in each tissue plotted against the malignancy continuum. Samples are colored based on if they are from different disease stage.
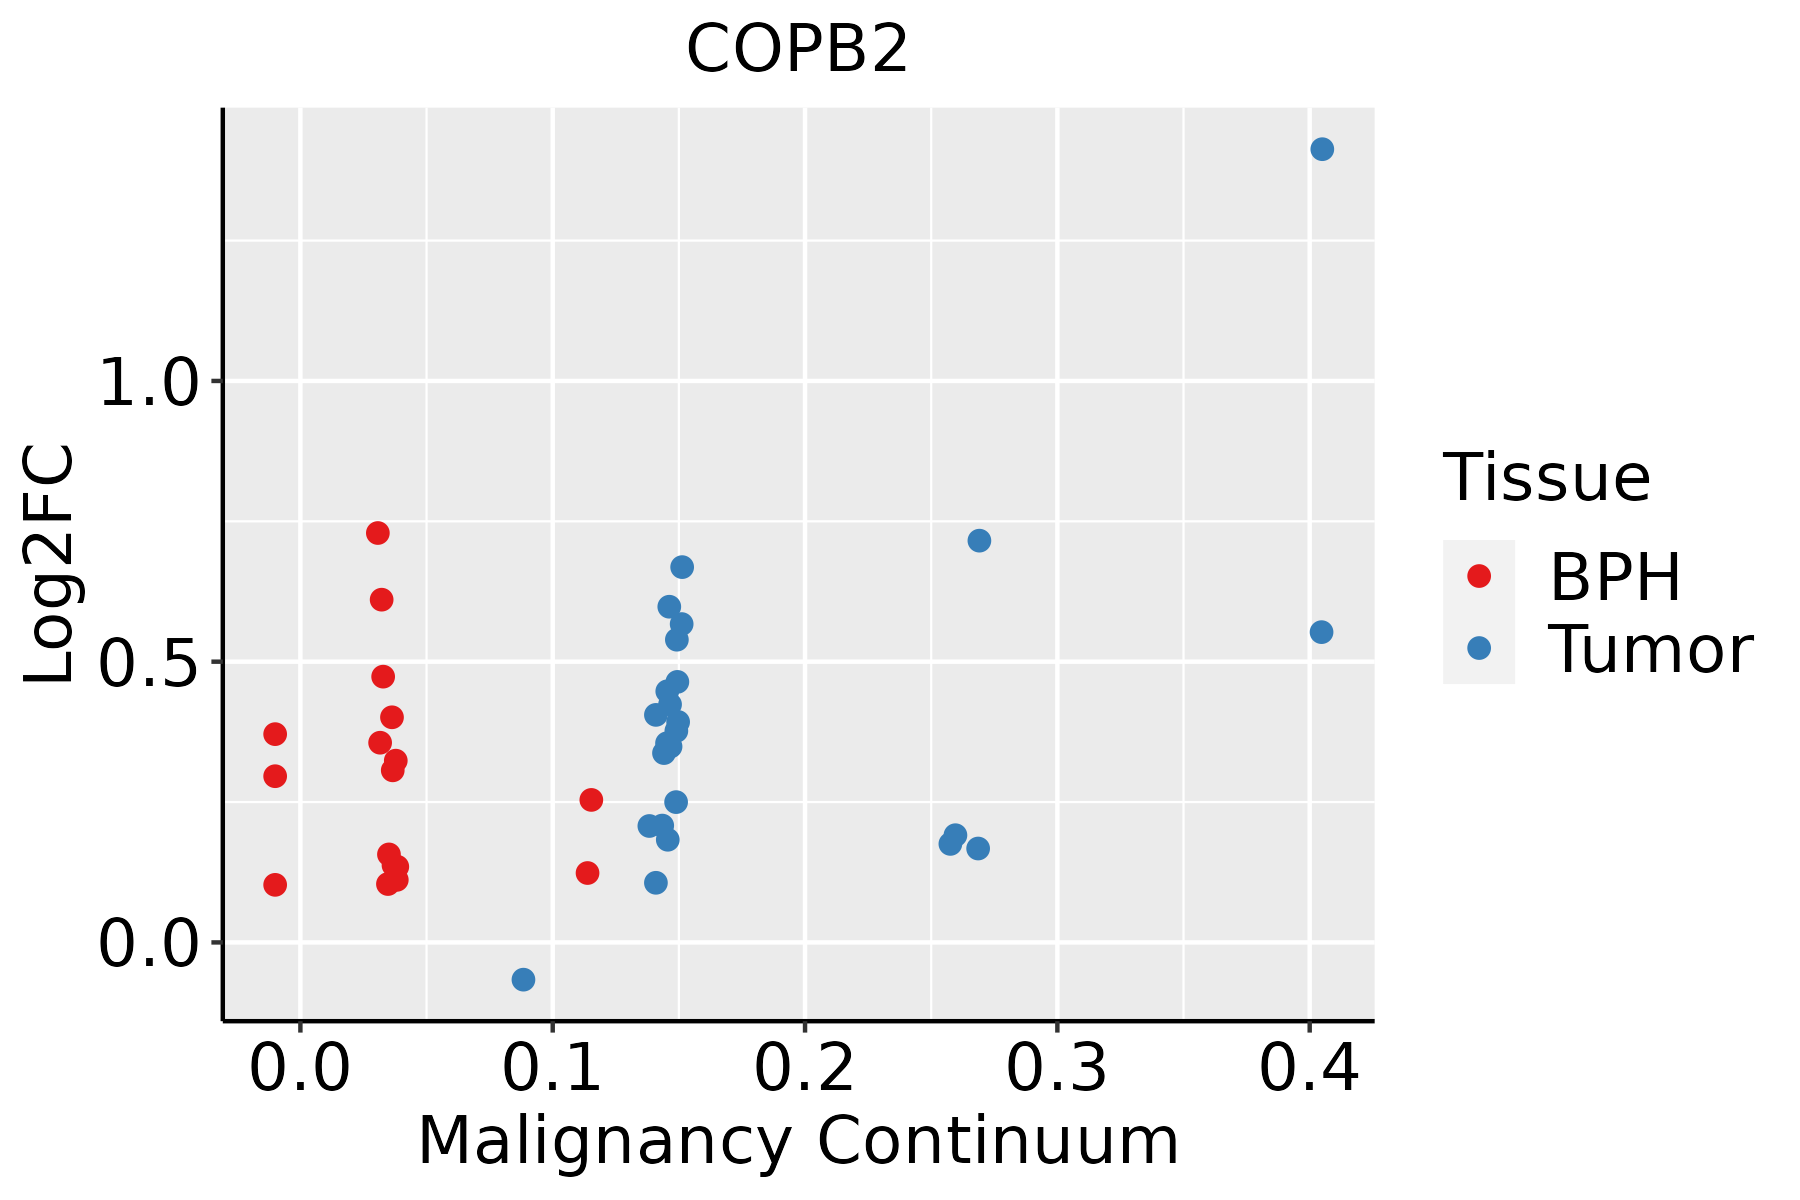
BPH: Benign Prostatic Hyperplasia
SkinThe image shows the transcriptomic changes along malignancy continuum.log2FC in expression of this searched gene in stem-like cells from each diseased tissue sample relative to stem-like cells in normal samples in each tissue plotted against the malignancy continuum. Samples are colored based on if they are from different disease stage.
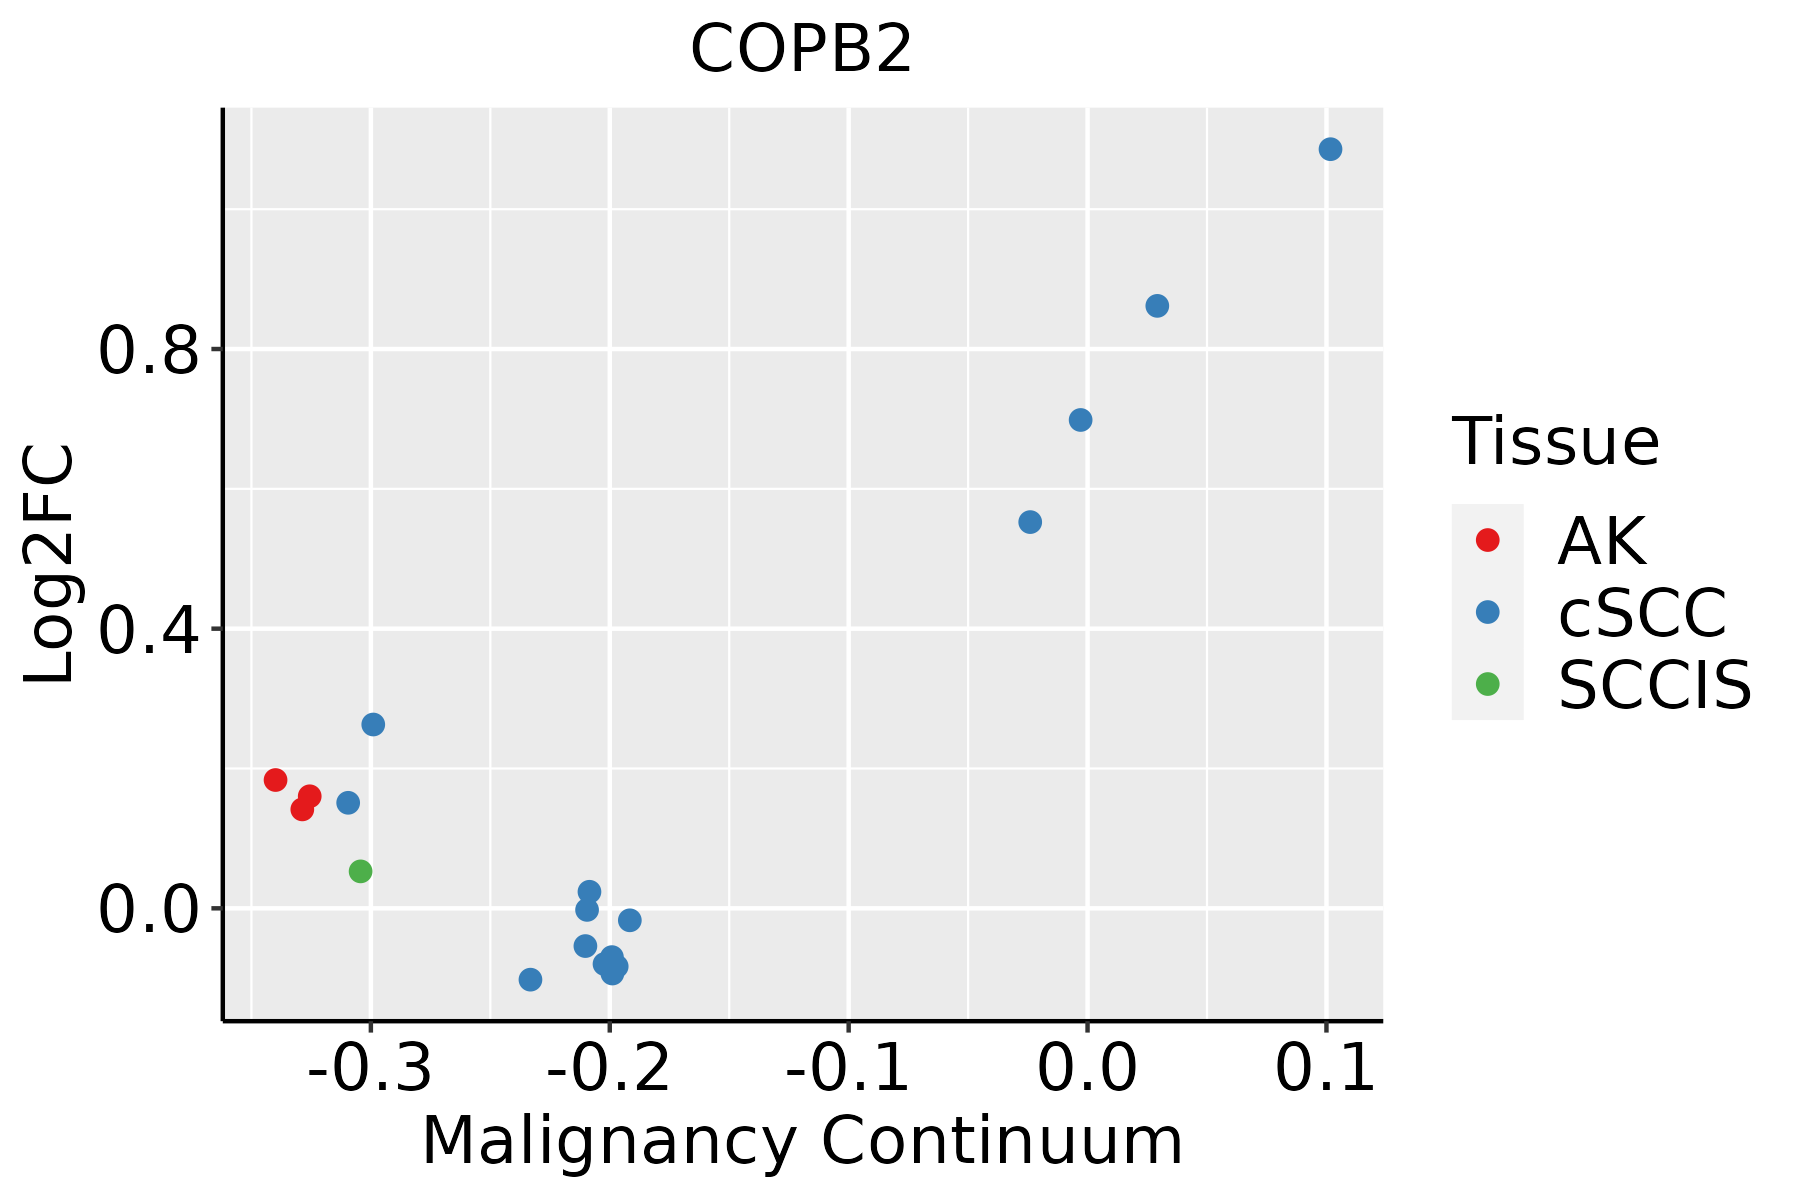
AK: Actinic keratosis
cSCC: Cutaneous squamous cell carcinoma
SCCIS:squamous cell carcinoma in situ
ThyroidThe image shows the transcriptomic changes along malignancy continuum.log2FC in expression of this searched gene in stem-like cells from each diseased tissue sample relative to stem-like cells in normal samples in each tissue plotted against the malignancy continuum. Samples are colored based on if they are from different disease stage.ATC: Anaplastic thyroid cancer
HT: Hashimoto's thyroiditis
PTC: Papillary thyroid cancer
∗log2FC in expression of this searched gene in stem-like cells from each diseased tissue sample relative to stem-like cells in normal samples in each tissue plotted against the malignancy continuum. Samples are colored based on if they are from different disease stage.

Top

Malignant transformation related pathway analysis

check buttonFind out the enriched GO biological processes and KEGG pathways involved in transition from healthy to precancer to cancer
check button Figure of enriched GO biological processes.
TissueDisease StageEnriched GO biological Processes
ColorectumADGO analysis - Figure of enriched GO biological processes: Top 15 enriched GO BP terms are showed in the bar plot of each disease state in each tissue. Each row represents a significant GO biological process which is colored according to the -log10(p.adjust).
ColorectumSERGO analysis - Figure of enriched GO biological processes: Top 15 enriched GO BP terms are showed in the bar plot of each disease state in each tissue. Each row represents a significant GO biological process which is colored according to the -log10(p.adjust).
ColorectumMSSGO analysis - Figure of enriched GO biological processes: Top 15 enriched GO BP terms are showed in the bar plot of each disease state in each tissue. Each row represents a significant GO biological process which is colored according to the -log10(p.adjust).
ColorectumMSI-HGO analysis - Figure of enriched GO biological processes: Top 15 enriched GO BP terms are showed in the bar plot of each disease state in each tissue. Each row represents a significant GO biological process which is colored according to the -log10(p.adjust).
ColorectumFAPGO analysis - Figure of enriched GO biological processes: Top 15 enriched GO BP terms are showed in the bar plot of each disease state in each tissue. Each row represents a significant GO biological process which is colored according to the -log10(p.adjust).
∗Top 15 enriched GO BP terms are showed in the bar plot of each disease state in each tissue. Each row represents a significant GO biological process which is colored according to the -log10(p.adjust).
Page: 1 2 3 4 5 6 7 8 9 

check button Enriched GO biological processes.
GO IDTissueDisease StageDescriptionGene RatioBg Ratiopvaluep.adjustCount
GO:00068914EsophagusESCCintra-Golgi vesicle-mediated transport26/855233/187231.06e-047.43e-0426
GO:19019987EsophagusESCCtoxin transport28/855240/187231.61e-037.50e-0328
GO:004819311LiverCirrhoticGolgi vesicle transport153/4634296/187231.02e-236.43e-21153
GO:000688811LiverCirrhoticendoplasmic reticulum to Golgi vesicle-mediated transport77/4634130/187235.78e-177.56e-1577
GO:00068905LiverCirrhoticretrograde vesicle-mediated transport, Golgi to endoplasmic reticulum29/463452/187231.69e-063.22e-0529
GO:004819321LiverHCCGolgi vesicle transport217/7958296/187232.58e-271.02e-24217
GO:000688821LiverHCCendoplasmic reticulum to Golgi vesicle-mediated transport100/7958130/187231.15e-158.67e-14100
GO:000689011LiverHCCretrograde vesicle-mediated transport, Golgi to endoplasmic reticulum36/795852/187238.79e-057.66e-0436
GO:0006891LiverHCCintra-Golgi vesicle-mediated transport22/795833/187234.38e-031.90e-0222
GO:004819315Oral cavityOSCCGolgi vesicle transport209/7305296/187231.39e-286.30e-26209
GO:00068888Oral cavityOSCCendoplasmic reticulum to Golgi vesicle-mediated transport97/7305130/187231.42e-161.15e-1497
GO:000689010Oral cavityOSCCretrograde vesicle-mediated transport, Golgi to endoplasmic reticulum40/730552/187232.86e-085.50e-0740
GO:00068913Oral cavityOSCCintra-Golgi vesicle-mediated transport23/730533/187233.47e-042.12e-0323
GO:19019986Oral cavityOSCCtoxin transport25/730540/187232.22e-031.00e-0225
GO:004819316Oral cavityLPGolgi vesicle transport141/4623296/187236.11e-181.06e-15141
GO:000688814Oral cavityLPendoplasmic reticulum to Golgi vesicle-mediated transport67/4623130/187233.74e-112.39e-0967
GO:000689015Oral cavityLPretrograde vesicle-mediated transport, Golgi to endoplasmic reticulum29/462352/187231.60e-063.79e-0529
GO:190199812Oral cavityLPtoxin transport19/462340/187231.44e-031.14e-0219
GO:000689111Oral cavityLPintra-Golgi vesicle-mediated transport16/462333/187232.59e-031.83e-0216
GO:004819322Oral cavityEOLPGolgi vesicle transport72/2218296/187231.43e-099.55e-0872
Page: 1 2 3 4 

check button Enriched KEGG pathways.
Pathway IDTissueDisease StageDescriptionGene RatioBg Ratiopvaluep.adjustqvalueCount
Page: 1 

Top

Cell-cell communication analysis

check buttonIdentification of potential cell-cell interactions between two cell types and their ligand-receptor pairs for different disease states
LigandReceptorLRpairPathwayTissueDisease Stage
Page: 1 

Top

Single-cell gene regulatory network inference analysis

check buttonFind out the significant the regulons (TFs) and the target genes of each regulon across cell types for different disease states
TFCell TypeTissueDisease StageTarget GeneRSSRegulon Activity
∗The dot plots of a searched regulon are shown for all cell subpopulations in each disease state of each tissue based on the regulon specific score inferred using pySCENIC and by calculating the average expression.
Page: 1 

Top

Somatic mutation of malignant transformation related genes

check buttonAnnotation of somatic variants for genes involved in malignant transformation
Hugo SymbolVariant ClassVariant ClassificationdbSNP RSHGVScHGVSpHGVSp ShortSWISSPROTBIOTYPESIFTPolyPhenTumor Sample BarcodeTissueHistologySexAgeStageTherapy TypesDrugsOutcome
COPB2SNVMissense_Mutationnovelc.1682T>Gp.Met561Argp.M561RP35606protein_codingdeleterious(0)possibly_damaging(0.61)TCGA-A7-A0CJ-01Breastbreast invasive carcinomaFemale<65I/IIChemotherapycytoxanSD
COPB2SNVMissense_Mutationnovelc.2240N>Tp.Arg747Ilep.R747IP35606protein_codingdeleterious(0.02)benign(0.062)TCGA-AN-A046-01Breastbreast invasive carcinomaFemale>=65I/IIUnknownUnknownSD
COPB2SNVMissense_Mutationnovelc.1894N>Ap.Gln632Lysp.Q632KP35606protein_codingtolerated(0.17)benign(0.01)TCGA-BH-A0AV-01Breastbreast invasive carcinomaFemale<65I/IIChemotherapytaxotereCR
COPB2SNVMissense_Mutationc.935G>Ap.Gly312Glup.G312EP35606protein_codingdeleterious(0)probably_damaging(0.95)TCGA-D8-A142-01Breastbreast invasive carcinomaFemale>=65I/IIChemotherapycyclophosphamidSD
COPB2SNVMissense_Mutationnovelc.547N>Ap.Gly183Argp.G183RP35606protein_codingdeleterious(0)probably_damaging(0.997)TCGA-LL-A8F5-01Breastbreast invasive carcinomaFemale<65I/IIChemotherapycyclophosphamideSD
COPB2insertionFrame_Shift_Insnovelc.1679_1680insTTCTCCTTTCTCAGTGCCCCCTTTAAATGTTGp.Met561SerfsTer15p.M561Sfs*15P35606protein_codingTCGA-A7-A0CJ-01Breastbreast invasive carcinomaFemale<65I/IIChemotherapycytoxanSD
COPB2deletionFrame_Shift_Delnovelc.2349delNp.Ala784GlnfsTer18p.A784Qfs*18P35606protein_codingTCGA-D8-A27V-01Breastbreast invasive carcinomaFemale<65I/IIHormone TherapytamoxiphenSD
COPB2insertionIn_Frame_Insrs766565677c.592_593insGGAp.Asp198delinsGlyAsnp.D198delinsGNP35606protein_codingTCGA-E9-A1NG-01Breastbreast invasive carcinomaFemale<65I/IIHormone TherapyletrozoleSD
COPB2SNVMissense_Mutationc.2582N>Tp.Thr861Ilep.T861IP35606protein_codingtolerated(0.29)benign(0.034)TCGA-HM-A4S6-01Cervixcervical & endocervical cancerFemale<65III/IVChemotherapycisplatinCR
COPB2SNVMissense_Mutationrs745412053c.902N>Ap.Arg301Glnp.R301QP35606protein_codingdeleterious(0.02)benign(0.241)TCGA-MA-AA42-01Cervixcervical & endocervical cancerFemale>=65I/IIUnknownUnknownSD
Page: 1 2 3 4 5 6 7 8 9 10 

Top

Related drugs of malignant transformation related genes

check buttonIdentification of chemicals and drugs interact with genes involved in malignant transfromation
(DGIdb 4.0)
Entrez IDSymbolCategoryInteraction TypesDrug Claim NameDrug NamePMIDs
Page: 1