
|
|||||
|
 | |
| |
| |
| |
| |
| |
|
Gene: COA5 |
Gene summary for COA5 |
| Gene information | Species | Human | Gene symbol | COA5 | Gene ID | 493753 |
| Gene name | cytochrome c oxidase assembly factor 5 | |
| Gene Alias | 6330578E17Rik | |
| Cytomap | 2q11.2 | |
| Gene Type | protein-coding | GO ID | GO:0006996 | UniProtAcc | Q86WW8 |
Top |
Malignant transformation analysis |
| Identification of the aberrant gene expression in precancerous and cancerous lesions by comparing the gene expression of stem-like cells in diseased tissues with normal stem cells |
| Entrez ID | Symbol | Replicates | Species | Organ | Tissue | Adj P-value | Log2FC | Malignancy |
| 493753 | COA5 | LZE2T | Human | Esophagus | ESCC | 4.24e-03 | 7.68e-01 | 0.082 |
| 493753 | COA5 | LZE4T | Human | Esophagus | ESCC | 4.17e-15 | 3.78e-01 | 0.0811 |
| 493753 | COA5 | LZE5T | Human | Esophagus | ESCC | 1.04e-05 | 3.78e-01 | 0.0514 |
| 493753 | COA5 | LZE7T | Human | Esophagus | ESCC | 3.63e-16 | 6.62e-01 | 0.0667 |
| 493753 | COA5 | LZE8T | Human | Esophagus | ESCC | 1.06e-04 | 2.79e-01 | 0.067 |
| 493753 | COA5 | LZE20T | Human | Esophagus | ESCC | 5.95e-11 | 3.58e-01 | 0.0662 |
| 493753 | COA5 | LZE22D1 | Human | Esophagus | HGIN | 4.12e-06 | 2.39e-01 | 0.0595 |
| 493753 | COA5 | LZE22T | Human | Esophagus | ESCC | 1.20e-03 | 5.43e-01 | 0.068 |
| 493753 | COA5 | LZE24T | Human | Esophagus | ESCC | 3.06e-20 | 6.87e-01 | 0.0596 |
| 493753 | COA5 | LZE21T | Human | Esophagus | ESCC | 1.15e-03 | 4.41e-01 | 0.0655 |
| 493753 | COA5 | LZE6T | Human | Esophagus | ESCC | 3.92e-09 | 4.91e-01 | 0.0845 |
| 493753 | COA5 | P1T-E | Human | Esophagus | ESCC | 5.08e-08 | 5.41e-01 | 0.0875 |
| 493753 | COA5 | P2T-E | Human | Esophagus | ESCC | 9.63e-32 | 5.03e-01 | 0.1177 |
| 493753 | COA5 | P4T-E | Human | Esophagus | ESCC | 4.47e-39 | 7.79e-01 | 0.1323 |
| 493753 | COA5 | P5T-E | Human | Esophagus | ESCC | 1.37e-24 | 4.00e-01 | 0.1327 |
| 493753 | COA5 | P8T-E | Human | Esophagus | ESCC | 1.29e-30 | 4.81e-01 | 0.0889 |
| 493753 | COA5 | P9T-E | Human | Esophagus | ESCC | 3.28e-19 | 5.00e-01 | 0.1131 |
| 493753 | COA5 | P10T-E | Human | Esophagus | ESCC | 2.23e-55 | 9.28e-01 | 0.116 |
| 493753 | COA5 | P11T-E | Human | Esophagus | ESCC | 1.51e-28 | 9.30e-01 | 0.1426 |
| 493753 | COA5 | P12T-E | Human | Esophagus | ESCC | 1.18e-45 | 8.59e-01 | 0.1122 |
| Page: 1 2 3 4 5 6 7 |
| Tissue | Expression Dynamics | Abbreviation |
| Esophagus | 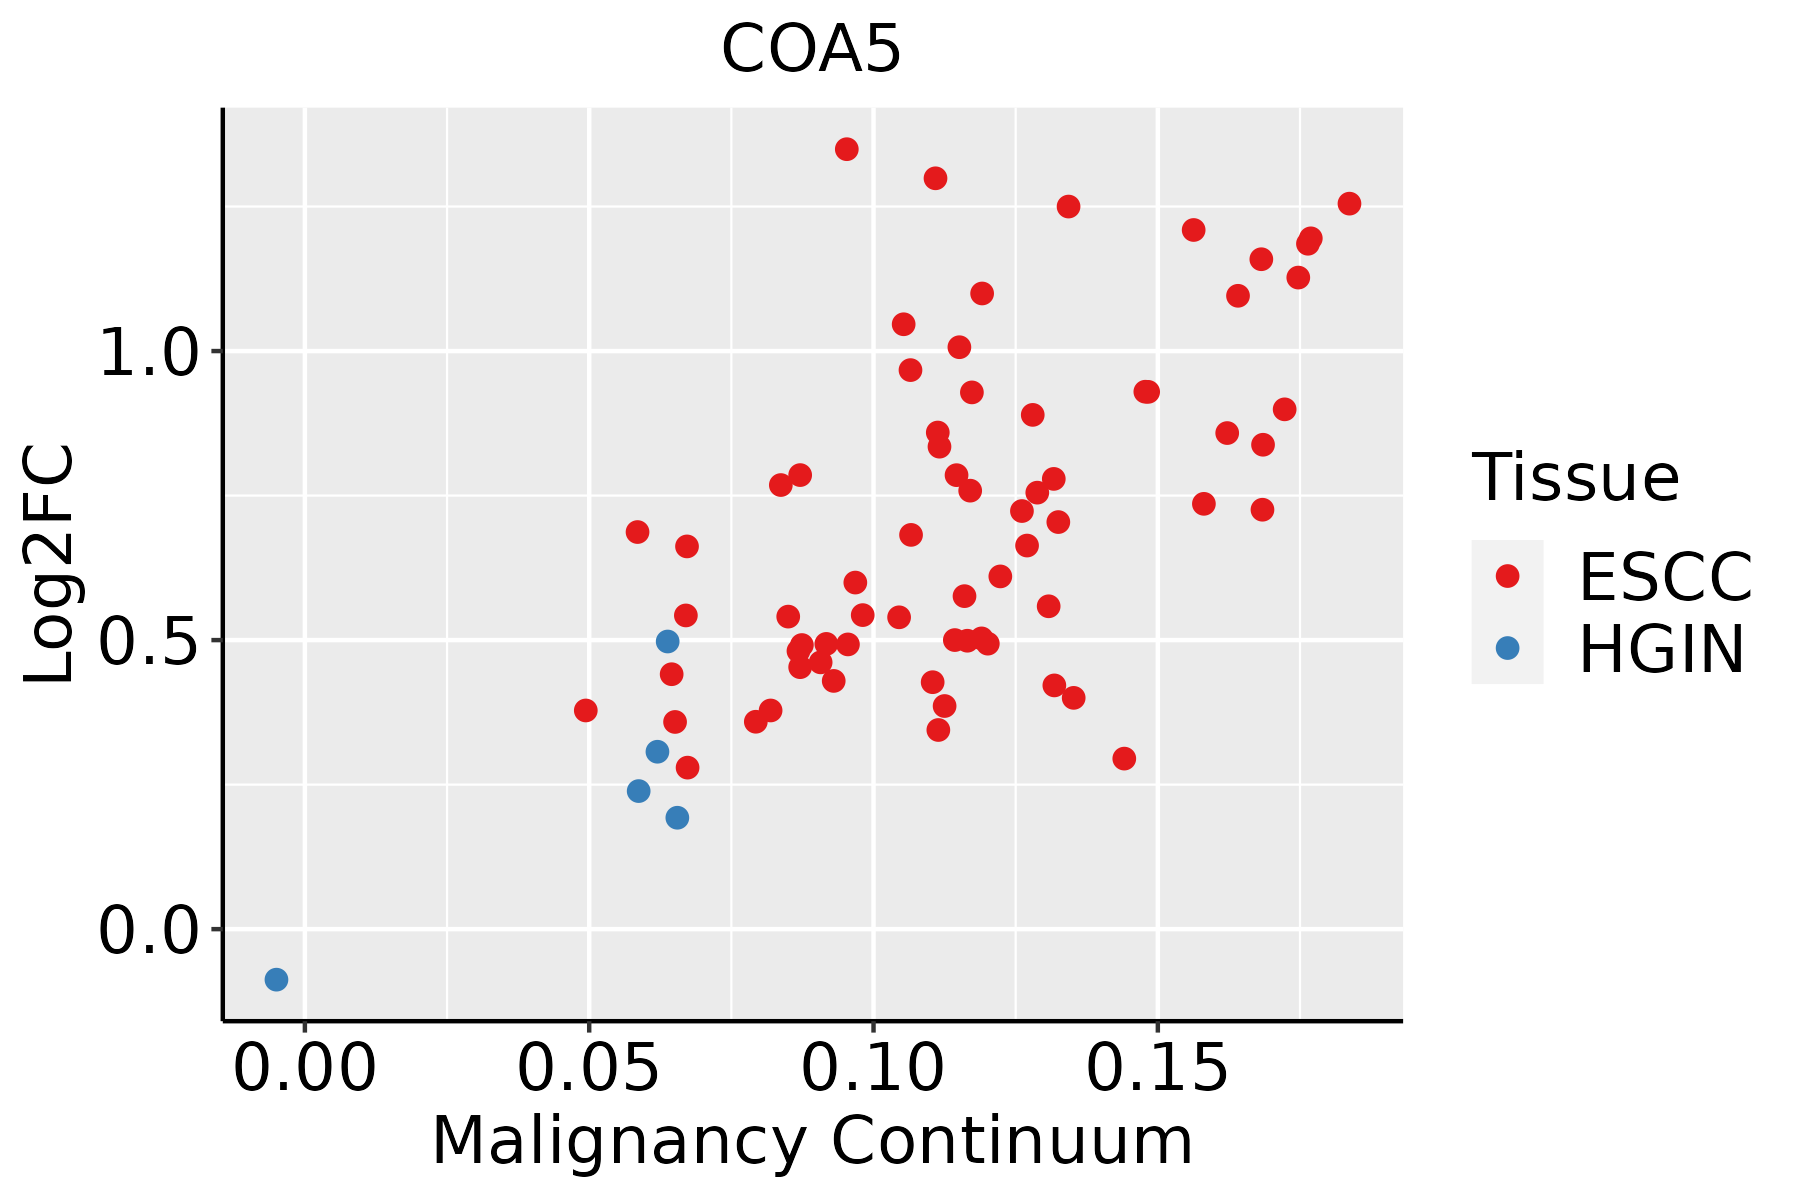 | ESCC: Esophageal squamous cell carcinoma |
| HGIN: High-grade intraepithelial neoplasias | ||
| LGIN: Low-grade intraepithelial neoplasias | ||
| Liver | 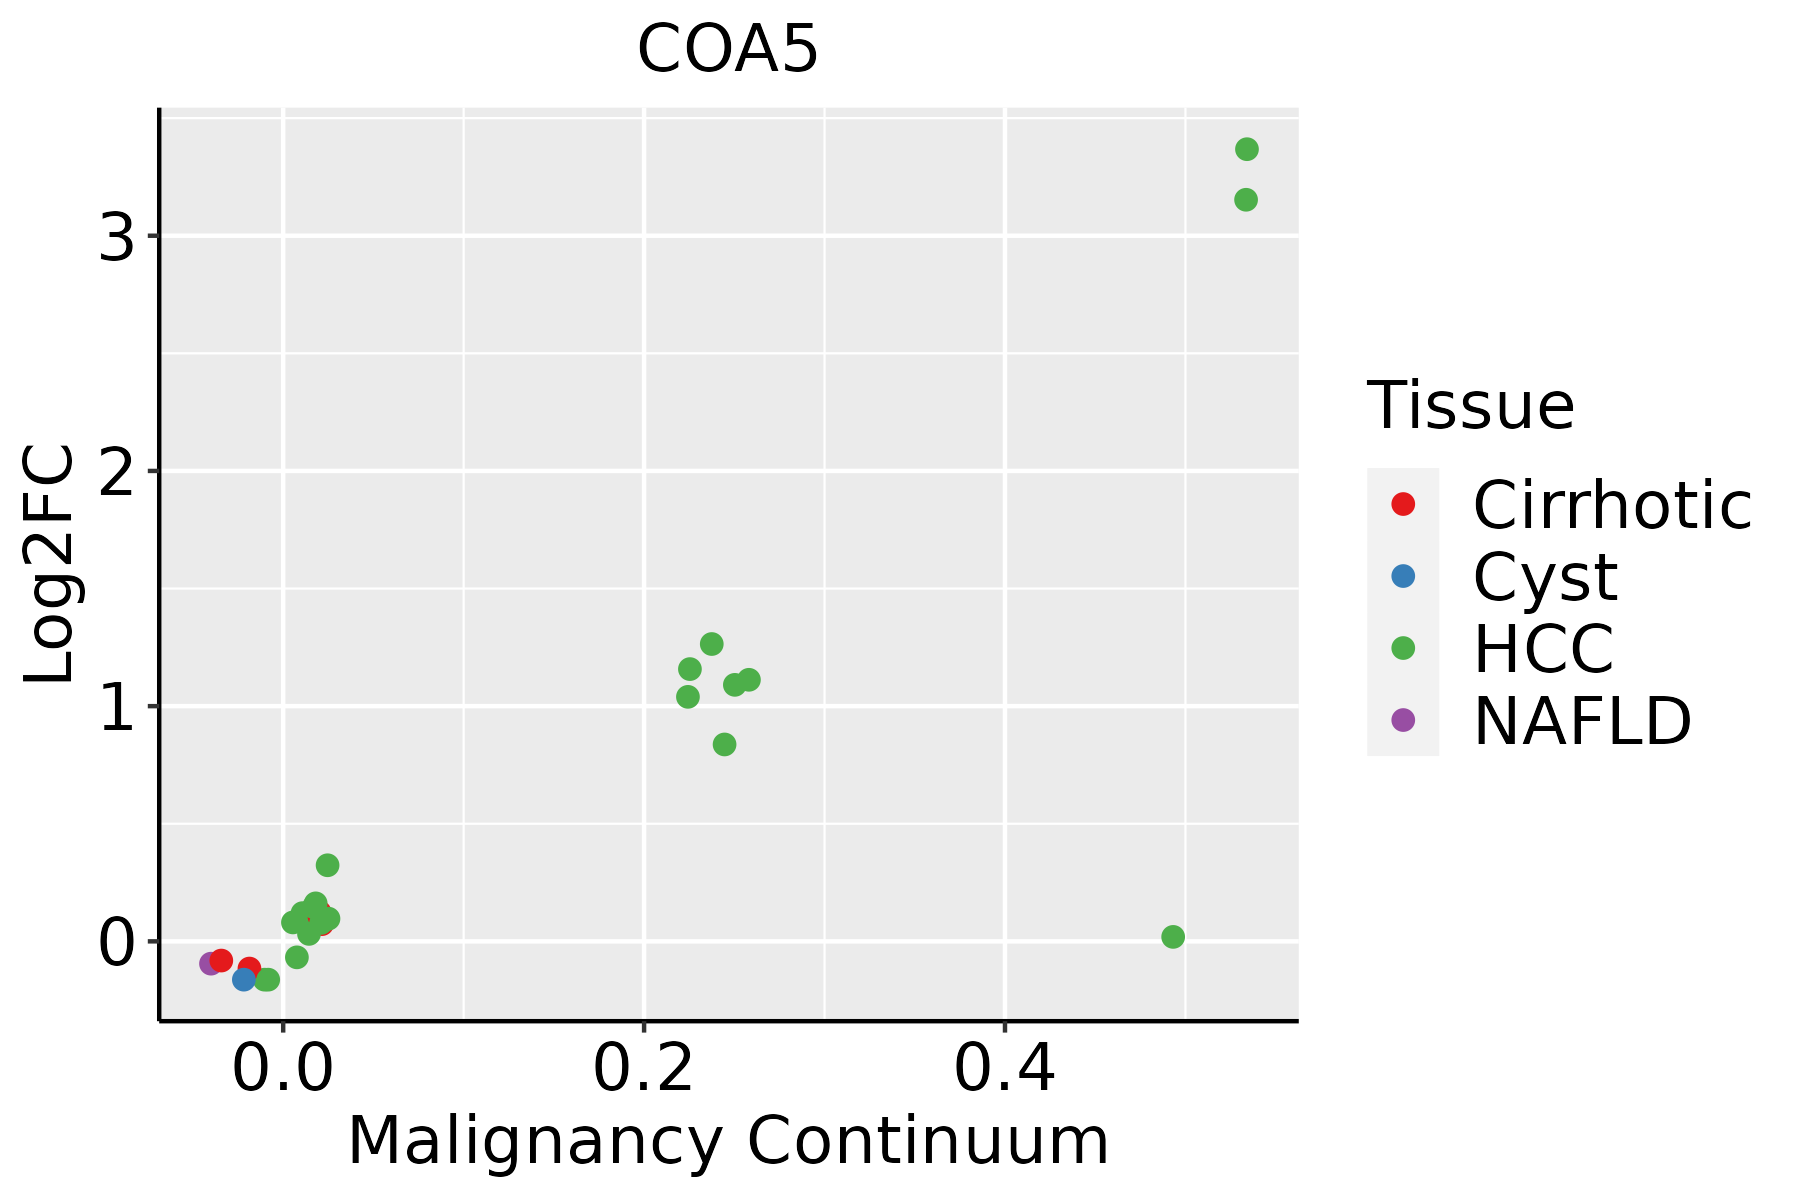 | HCC: Hepatocellular carcinoma |
| NAFLD: Non-alcoholic fatty liver disease | ||
| Oral Cavity | 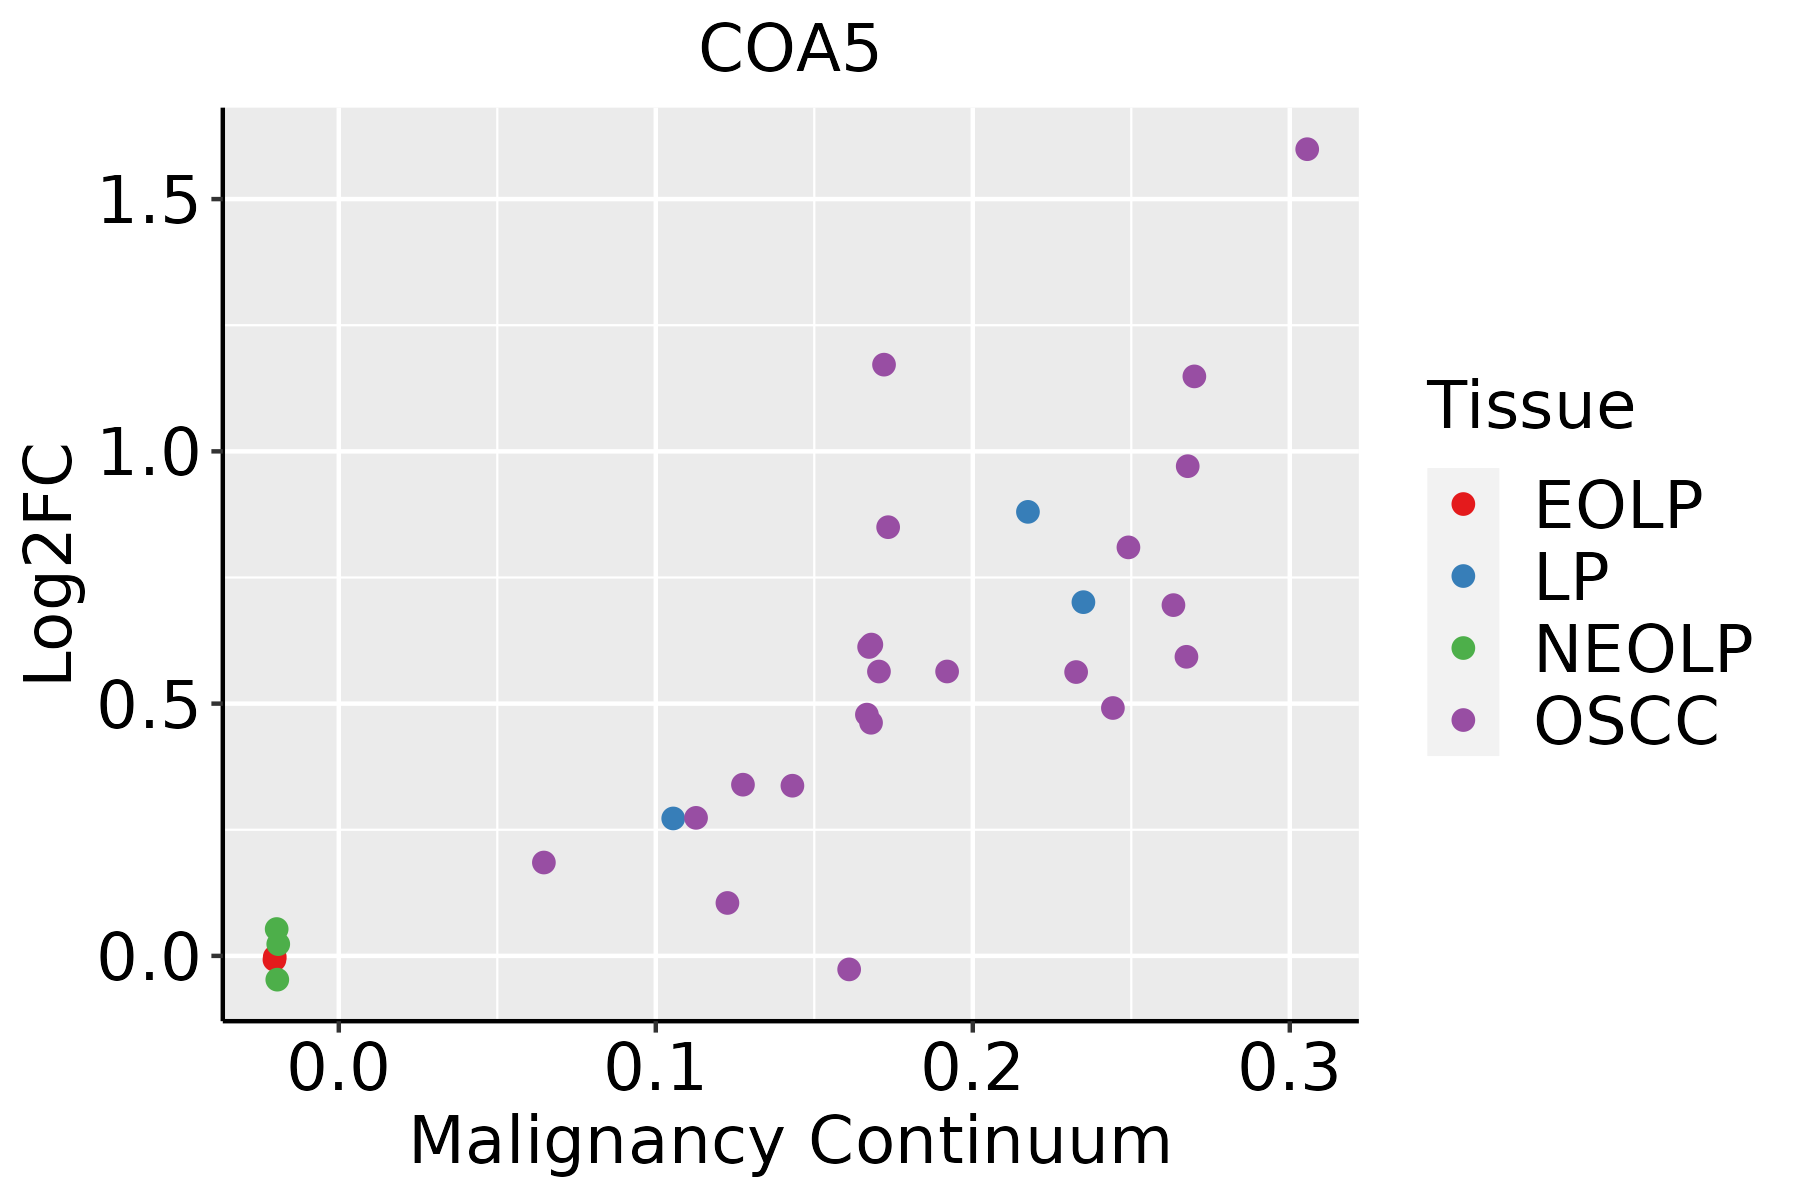 | EOLP: Erosive Oral lichen planus |
| LP: leukoplakia | ||
| NEOLP: Non-erosive oral lichen planus | ||
| OSCC: Oral squamous cell carcinoma | ||
| Skin | 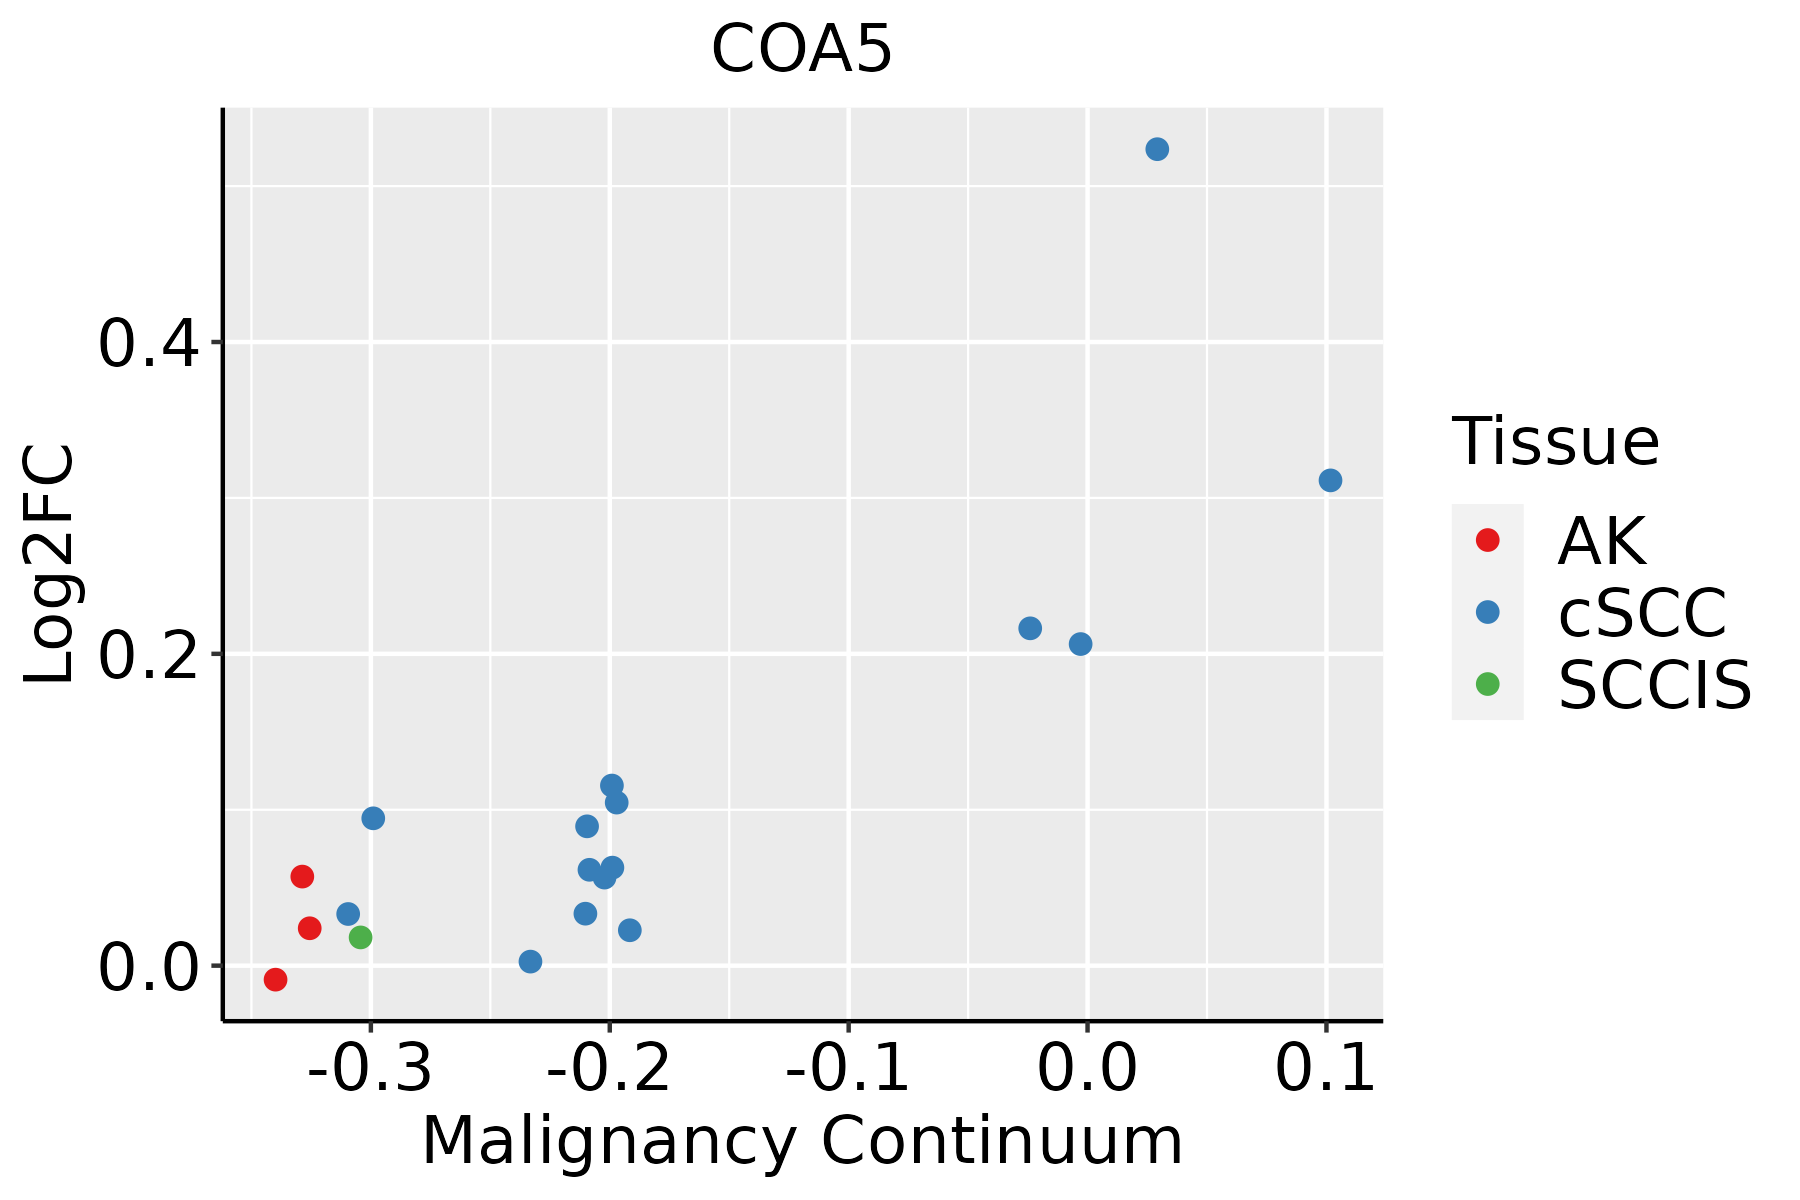 | AK: Actinic keratosis |
| cSCC: Cutaneous squamous cell carcinoma | ||
| SCCIS:squamous cell carcinoma in situ | ||
| Thyroid | 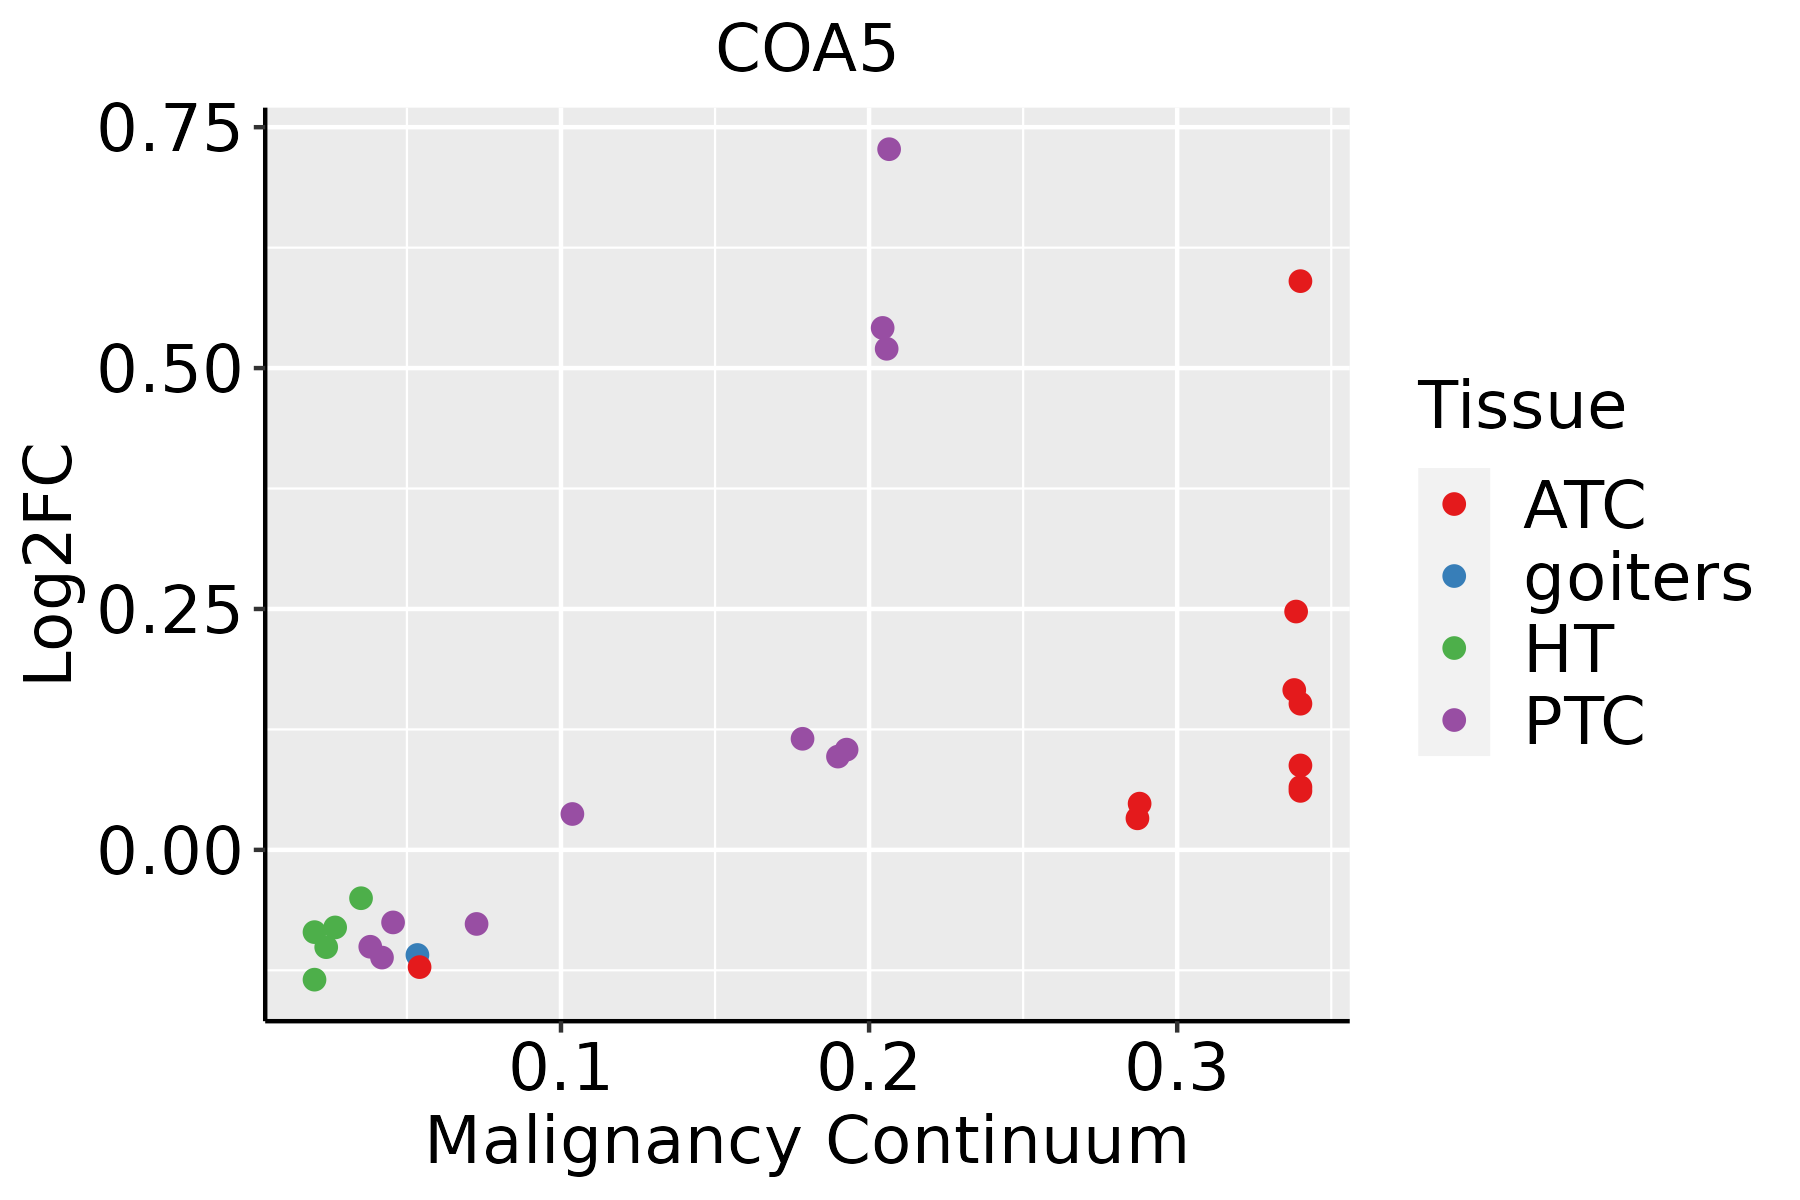 | ATC: Anaplastic thyroid cancer |
| HT: Hashimoto's thyroiditis | ||
| PTC: Papillary thyroid cancer |
| ∗log2FC in expression of this searched gene in stem-like cells from each diseased tissue sample relative to stem-like cells in normal samples in each tissue plotted against the malignancy continuum. Samples are colored based on if they are from different disease stage. |
Top |
Malignant transformation related pathway analysis |
| Find out the enriched GO biological processes and KEGG pathways involved in transition from healthy to precancer to cancer |
| Tissue | Disease Stage | Enriched GO biological Processes |
| Colorectum | AD |  |
| Colorectum | SER |  |
| Colorectum | MSS |  |
| Colorectum | MSI-H |  |
| Colorectum | FAP |  |
| ∗Top 15 enriched GO BP terms are showed in the bar plot of each disease state in each tissue. Each row represents a significant GO biological process which is colored according to the -log10(p.adjust). |
| Page: 1 2 3 4 5 6 7 8 9 |
| GO ID | Tissue | Disease Stage | Description | Gene Ratio | Bg Ratio | pvalue | p.adjust | Count |
| GO:00336171 | Liver | HCC | mitochondrial cytochrome c oxidase assembly | 20/7958 | 22/18723 | 3.00e-06 | 3.98e-05 | 20 |
| GO:00085351 | Liver | HCC | respiratory chain complex IV assembly | 22/7958 | 26/18723 | 1.23e-05 | 1.39e-04 | 22 |
| GO:003310818 | Oral cavity | OSCC | mitochondrial respiratory chain complex assembly | 75/7305 | 93/18723 | 2.17e-16 | 1.68e-14 | 75 |
| GO:00170043 | Oral cavity | OSCC | cytochrome complex assembly | 31/7305 | 36/18723 | 7.28e-09 | 1.53e-07 | 31 |
| GO:00336172 | Oral cavity | OSCC | mitochondrial cytochrome c oxidase assembly | 19/7305 | 22/18723 | 6.52e-06 | 7.21e-05 | 19 |
| GO:00085352 | Oral cavity | OSCC | respiratory chain complex IV assembly | 21/7305 | 26/18723 | 1.66e-05 | 1.64e-04 | 21 |
| GO:003310819 | Oral cavity | LP | mitochondrial respiratory chain complex assembly | 63/4623 | 93/18723 | 2.24e-18 | 4.13e-16 | 63 |
| GO:001700412 | Oral cavity | LP | cytochrome complex assembly | 25/4623 | 36/18723 | 1.93e-08 | 7.11e-07 | 25 |
| GO:003361711 | Oral cavity | LP | mitochondrial cytochrome c oxidase assembly | 17/4623 | 22/18723 | 3.24e-07 | 9.53e-06 | 17 |
| GO:000853511 | Oral cavity | LP | respiratory chain complex IV assembly | 18/4623 | 26/18723 | 2.13e-06 | 4.81e-05 | 18 |
| GO:003310824 | Skin | cSCC | mitochondrial respiratory chain complex assembly | 64/4864 | 93/18723 | 5.48e-18 | 6.58e-16 | 64 |
| GO:00170045 | Skin | cSCC | cytochrome complex assembly | 22/4864 | 36/18723 | 9.20e-06 | 1.21e-04 | 22 |
| GO:00336174 | Skin | cSCC | mitochondrial cytochrome c oxidase assembly | 15/4864 | 22/18723 | 4.00e-05 | 4.27e-04 | 15 |
| GO:00085354 | Skin | cSCC | respiratory chain complex IV assembly | 16/4864 | 26/18723 | 1.39e-04 | 1.26e-03 | 16 |
| GO:0033108111 | Thyroid | PTC | mitochondrial respiratory chain complex assembly | 65/5968 | 93/18723 | 5.60e-14 | 3.21e-12 | 65 |
| GO:00170046 | Thyroid | PTC | cytochrome complex assembly | 19/5968 | 36/18723 | 7.38e-03 | 3.16e-02 | 19 |
| GO:00336175 | Thyroid | PTC | mitochondrial cytochrome c oxidase assembly | 13/5968 | 22/18723 | 7.65e-03 | 3.25e-02 | 13 |
| GO:003310832 | Thyroid | ATC | mitochondrial respiratory chain complex assembly | 65/6293 | 93/18723 | 8.86e-13 | 3.81e-11 | 65 |
| GO:003361713 | Thyroid | ATC | mitochondrial cytochrome c oxidase assembly | 13/6293 | 22/18723 | 1.25e-02 | 4.38e-02 | 13 |
| GO:001700414 | Thyroid | ATC | cytochrome complex assembly | 19/6293 | 36/18723 | 1.37e-02 | 4.77e-02 | 19 |
| Page: 1 2 |
| Pathway ID | Tissue | Disease Stage | Description | Gene Ratio | Bg Ratio | pvalue | p.adjust | qvalue | Count |
| hsa0471439 | Esophagus | HGIN | Thermogenesis | 91/1383 | 232/8465 | 1.97e-17 | 5.36e-16 | 4.25e-16 | 91 |
| hsa04714114 | Esophagus | HGIN | Thermogenesis | 91/1383 | 232/8465 | 1.97e-17 | 5.36e-16 | 4.25e-16 | 91 |
| hsa04714211 | Esophagus | ESCC | Thermogenesis | 163/4205 | 232/8465 | 9.22e-11 | 1.14e-09 | 5.86e-10 | 163 |
| hsa04714310 | Esophagus | ESCC | Thermogenesis | 163/4205 | 232/8465 | 9.22e-11 | 1.14e-09 | 5.86e-10 | 163 |
| hsa0471414 | Liver | Cirrhotic | Thermogenesis | 121/2530 | 232/8465 | 5.70e-13 | 1.36e-11 | 8.36e-12 | 121 |
| hsa0471415 | Liver | Cirrhotic | Thermogenesis | 121/2530 | 232/8465 | 5.70e-13 | 1.36e-11 | 8.36e-12 | 121 |
| hsa0471422 | Liver | HCC | Thermogenesis | 170/4020 | 232/8465 | 5.36e-16 | 2.25e-14 | 1.25e-14 | 170 |
| hsa0471432 | Liver | HCC | Thermogenesis | 170/4020 | 232/8465 | 5.36e-16 | 2.25e-14 | 1.25e-14 | 170 |
| hsa0471430 | Oral cavity | OSCC | Thermogenesis | 138/3704 | 232/8465 | 7.67e-07 | 4.35e-06 | 2.22e-06 | 138 |
| hsa04714113 | Oral cavity | OSCC | Thermogenesis | 138/3704 | 232/8465 | 7.67e-07 | 4.35e-06 | 2.22e-06 | 138 |
| hsa04714210 | Oral cavity | LP | Thermogenesis | 105/2418 | 232/8465 | 3.14e-08 | 4.98e-07 | 3.21e-07 | 105 |
| hsa0471438 | Oral cavity | LP | Thermogenesis | 105/2418 | 232/8465 | 3.14e-08 | 4.98e-07 | 3.21e-07 | 105 |
| Page: 1 |
Top |
Cell-cell communication analysis |
| Identification of potential cell-cell interactions between two cell types and their ligand-receptor pairs for different disease states |
| Ligand | Receptor | LRpair | Pathway | Tissue | Disease Stage |
| Page: 1 |
Top |
Single-cell gene regulatory network inference analysis |
| Find out the significant the regulons (TFs) and the target genes of each regulon across cell types for different disease states |
| TF | Cell Type | Tissue | Disease Stage | Target Gene | RSS | Regulon Activity |
| ∗The dot plots of a searched regulon are shown for all cell subpopulations in each disease state of each tissue based on the regulon specific score inferred using pySCENIC and by calculating the average expression. |
| Page: 1 |
Top |
Somatic mutation of malignant transformation related genes |
| Annotation of somatic variants for genes involved in malignant transformation |
| Hugo Symbol | Variant Class | Variant Classification | dbSNP RS | HGVSc | HGVSp | HGVSp Short | SWISSPROT | BIOTYPE | SIFT | PolyPhen | Tumor Sample Barcode | Tissue | Histology | Sex | Age | Stage | Therapy Types | Drugs | Outcome |
| COA5 | SNV | Missense_Mutation | c.134N>A | p.Gly45Glu | p.G45E | Q86WW8 | protein_coding | tolerated(0.24) | possibly_damaging(0.471) | TCGA-IR-A3LK-01 | Cervix | cervical & endocervical cancer | Female | >=65 | I/II | Chemotherapy | cisplatin | PD | |
| COA5 | SNV | Missense_Mutation | c.115N>T | p.Arg39Trp | p.R39W | Q86WW8 | protein_coding | deleterious(0) | possibly_damaging(0.877) | TCGA-CM-4743-01 | Colorectum | colon adenocarcinoma | Male | >=65 | I/II | Chemotherapy | capecitabine | SD | |
| COA5 | SNV | Missense_Mutation | c.157G>A | p.Ala53Thr | p.A53T | Q86WW8 | protein_coding | tolerated(0.86) | benign(0.017) | TCGA-EI-6917-01 | Colorectum | rectum adenocarcinoma | Male | <65 | III/IV | Chemotherapy | 5fluorouracil+oxaciplatina+l-folinian | SD | |
| COA5 | SNV | Missense_Mutation | c.218N>T | p.Gly73Val | p.G73V | Q86WW8 | protein_coding | deleterious(0) | probably_damaging(0.999) | TCGA-B5-A0JY-01 | Endometrium | uterine corpus endometrioid carcinoma | Female | <65 | III/IV | Chemotherapy | doxorubicin | SD | |
| COA5 | SNV | Missense_Mutation | c.106N>C | p.Lys36Gln | p.K36Q | Q86WW8 | protein_coding | deleterious(0.05) | probably_damaging(0.954) | TCGA-B5-A11E-01 | Endometrium | uterine corpus endometrioid carcinoma | Female | <65 | I/II | Unknown | Unknown | SD | |
| COA5 | SNV | Missense_Mutation | c.115N>T | p.Arg39Trp | p.R39W | Q86WW8 | protein_coding | deleterious(0) | possibly_damaging(0.877) | TCGA-85-6798-01 | Lung | lung squamous cell carcinoma | Male | <65 | III/IV | Chemotherapy | etoposide | PD |
| Page: 1 |
Top |
Related drugs of malignant transformation related genes |
| Identification of chemicals and drugs interact with genes involved in malignant transfromation |
| (DGIdb 4.0) |
| Entrez ID | Symbol | Category | Interaction Types | Drug Claim Name | Drug Name | PMIDs |
| Page: 1 |

Copyright 2023-Present -The University of Texas Health Science Center at Houston |