
|
|||||
|
 | |
| |
| |
| |
| |
| |
|
Gene: CIDEB |
Gene summary for CIDEB |
| Gene information | Species | Human | Gene symbol | CIDEB | Gene ID | 27141 |
| Gene name | cell death inducing DFFA like effector b | |
| Gene Alias | CIDEB | |
| Cytomap | 14q12 | |
| Gene Type | protein-coding | GO ID | GO:0001836 | UniProtAcc | Q9UHD4 |
Top |
Malignant transformation analysis |
| Identification of the aberrant gene expression in precancerous and cancerous lesions by comparing the gene expression of stem-like cells in diseased tissues with normal stem cells |
| Entrez ID | Symbol | Replicates | Species | Organ | Tissue | Adj P-value | Log2FC | Malignancy |
| 27141 | CIDEB | LZE22T | Human | Esophagus | ESCC | 2.10e-03 | 2.10e-01 | 0.068 |
| 27141 | CIDEB | P2T-E | Human | Esophagus | ESCC | 2.76e-08 | 1.99e-01 | 0.1177 |
| 27141 | CIDEB | P4T-E | Human | Esophagus | ESCC | 1.78e-09 | 2.62e-01 | 0.1323 |
| 27141 | CIDEB | P5T-E | Human | Esophagus | ESCC | 1.29e-04 | 7.85e-02 | 0.1327 |
| 27141 | CIDEB | P8T-E | Human | Esophagus | ESCC | 1.26e-09 | 6.67e-02 | 0.0889 |
| 27141 | CIDEB | P9T-E | Human | Esophagus | ESCC | 2.55e-08 | 1.99e-01 | 0.1131 |
| 27141 | CIDEB | P10T-E | Human | Esophagus | ESCC | 5.11e-23 | 5.00e-01 | 0.116 |
| 27141 | CIDEB | P11T-E | Human | Esophagus | ESCC | 1.80e-07 | 3.34e-01 | 0.1426 |
| 27141 | CIDEB | P15T-E | Human | Esophagus | ESCC | 1.23e-14 | 3.64e-01 | 0.1149 |
| 27141 | CIDEB | P16T-E | Human | Esophagus | ESCC | 6.79e-06 | 1.72e-01 | 0.1153 |
| 27141 | CIDEB | P20T-E | Human | Esophagus | ESCC | 1.99e-04 | 1.79e-01 | 0.1124 |
| 27141 | CIDEB | P21T-E | Human | Esophagus | ESCC | 1.53e-17 | 2.08e-01 | 0.1617 |
| 27141 | CIDEB | P22T-E | Human | Esophagus | ESCC | 4.31e-04 | 1.71e-02 | 0.1236 |
| 27141 | CIDEB | P23T-E | Human | Esophagus | ESCC | 1.27e-12 | 3.34e-01 | 0.108 |
| 27141 | CIDEB | P26T-E | Human | Esophagus | ESCC | 2.38e-08 | 1.63e-01 | 0.1276 |
| 27141 | CIDEB | P27T-E | Human | Esophagus | ESCC | 1.91e-21 | 3.95e-01 | 0.1055 |
| 27141 | CIDEB | P28T-E | Human | Esophagus | ESCC | 2.00e-19 | 4.14e-01 | 0.1149 |
| 27141 | CIDEB | P30T-E | Human | Esophagus | ESCC | 2.98e-20 | 6.29e-01 | 0.137 |
| 27141 | CIDEB | P31T-E | Human | Esophagus | ESCC | 4.93e-14 | 2.85e-01 | 0.1251 |
| 27141 | CIDEB | P32T-E | Human | Esophagus | ESCC | 5.94e-05 | 8.53e-02 | 0.1666 |
| Page: 1 2 3 4 |
| Tissue | Expression Dynamics | Abbreviation |
| Esophagus | 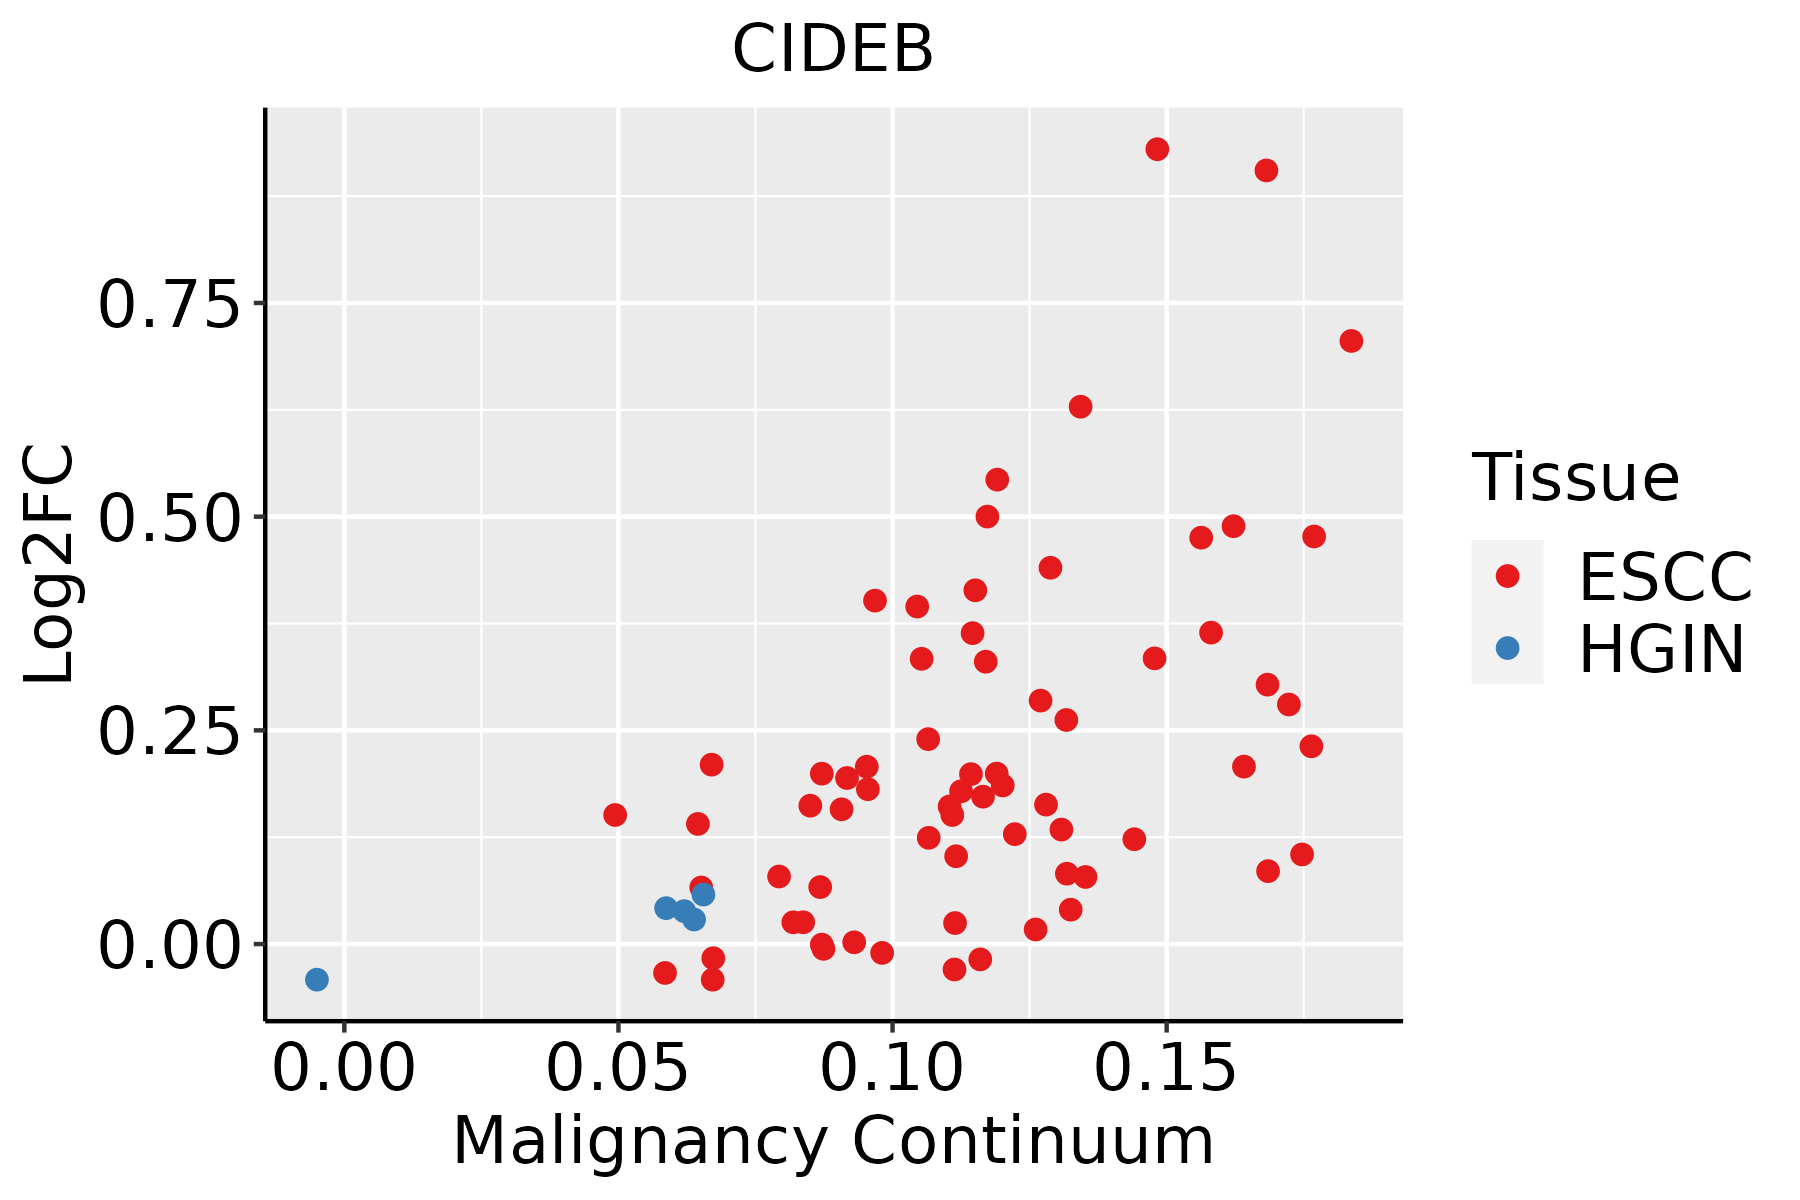 | ESCC: Esophageal squamous cell carcinoma |
| HGIN: High-grade intraepithelial neoplasias | ||
| LGIN: Low-grade intraepithelial neoplasias | ||
| GC | 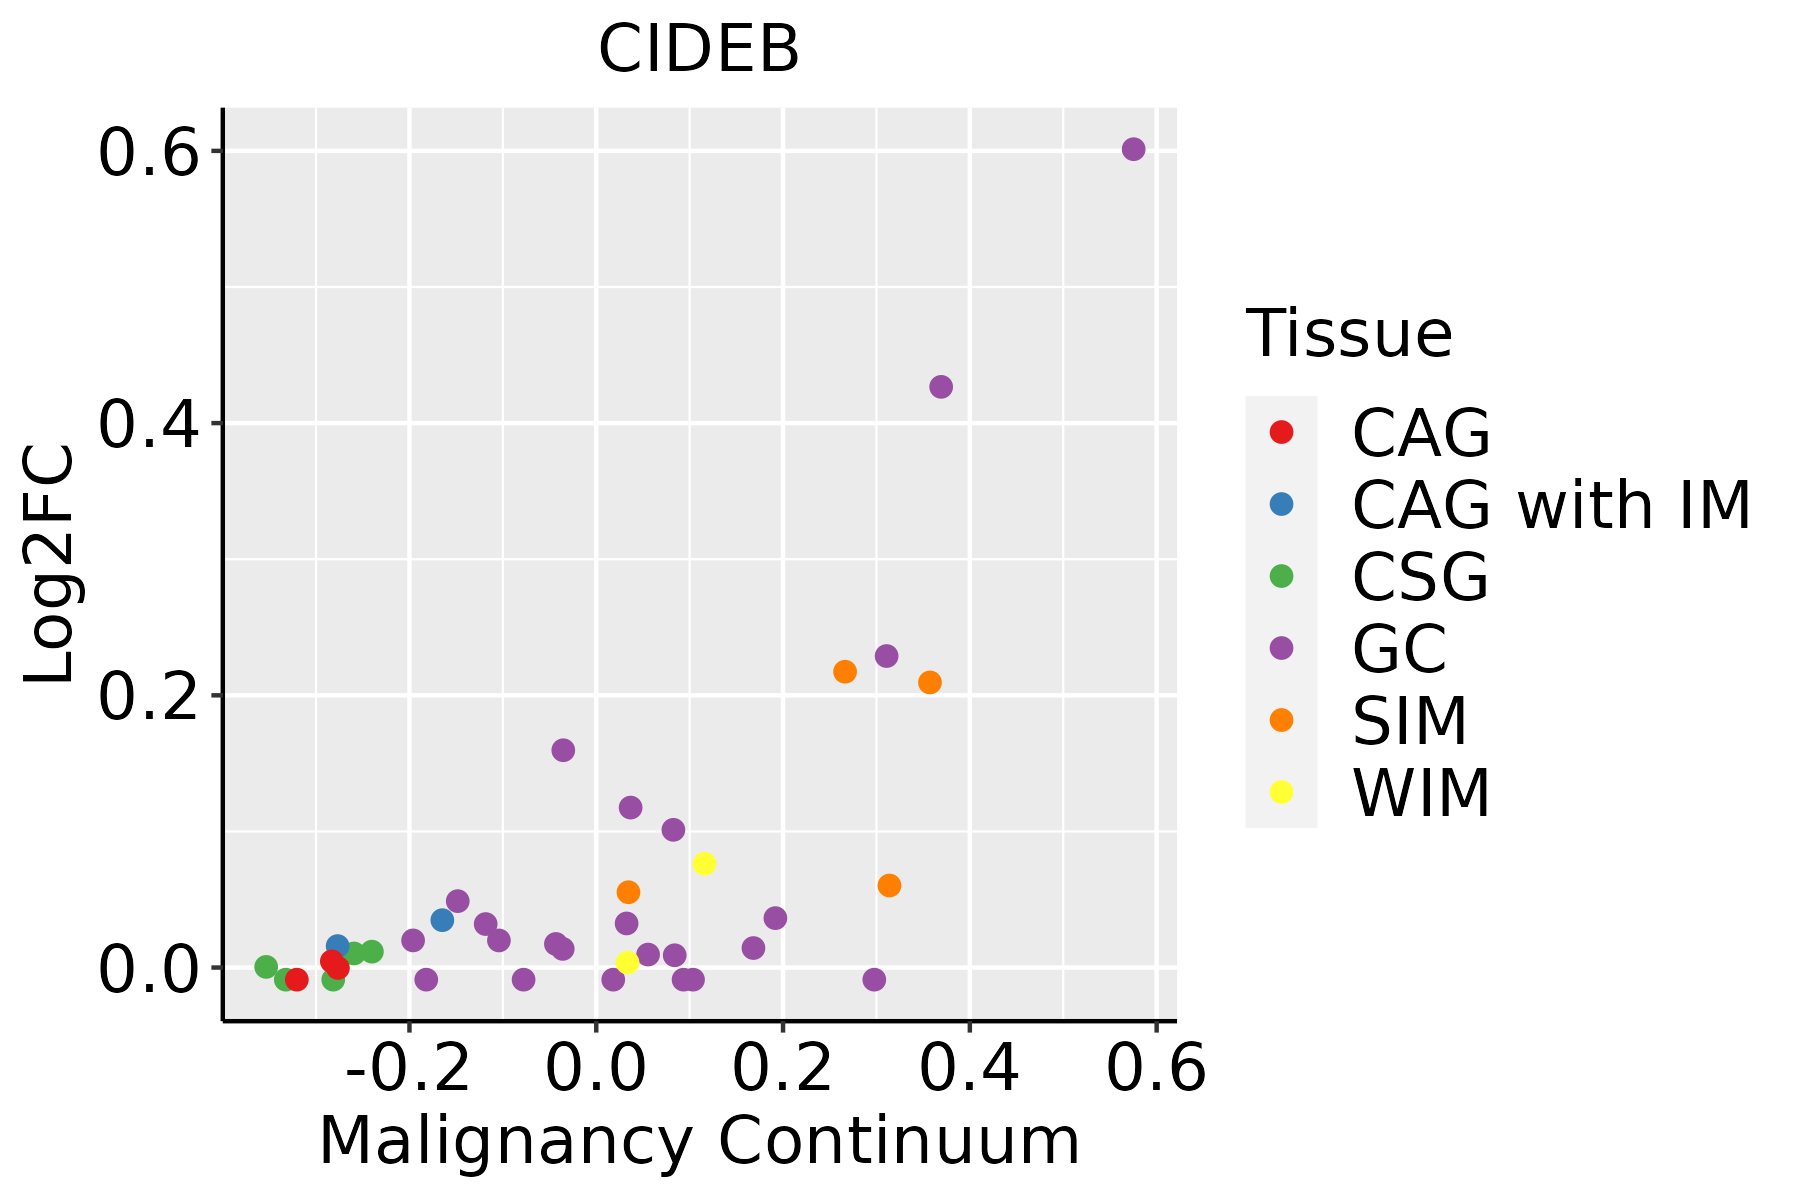 | CAG: Chronic atrophic gastritis |
| CAG with IM: Chronic atrophic gastritis with intestinal metaplasia | ||
| CSG: Chronic superficial gastritis | ||
| GC: Gastric cancer | ||
| SIM: Severe intestinal metaplasia | ||
| WIM: Wild intestinal metaplasia | ||
| Liver | 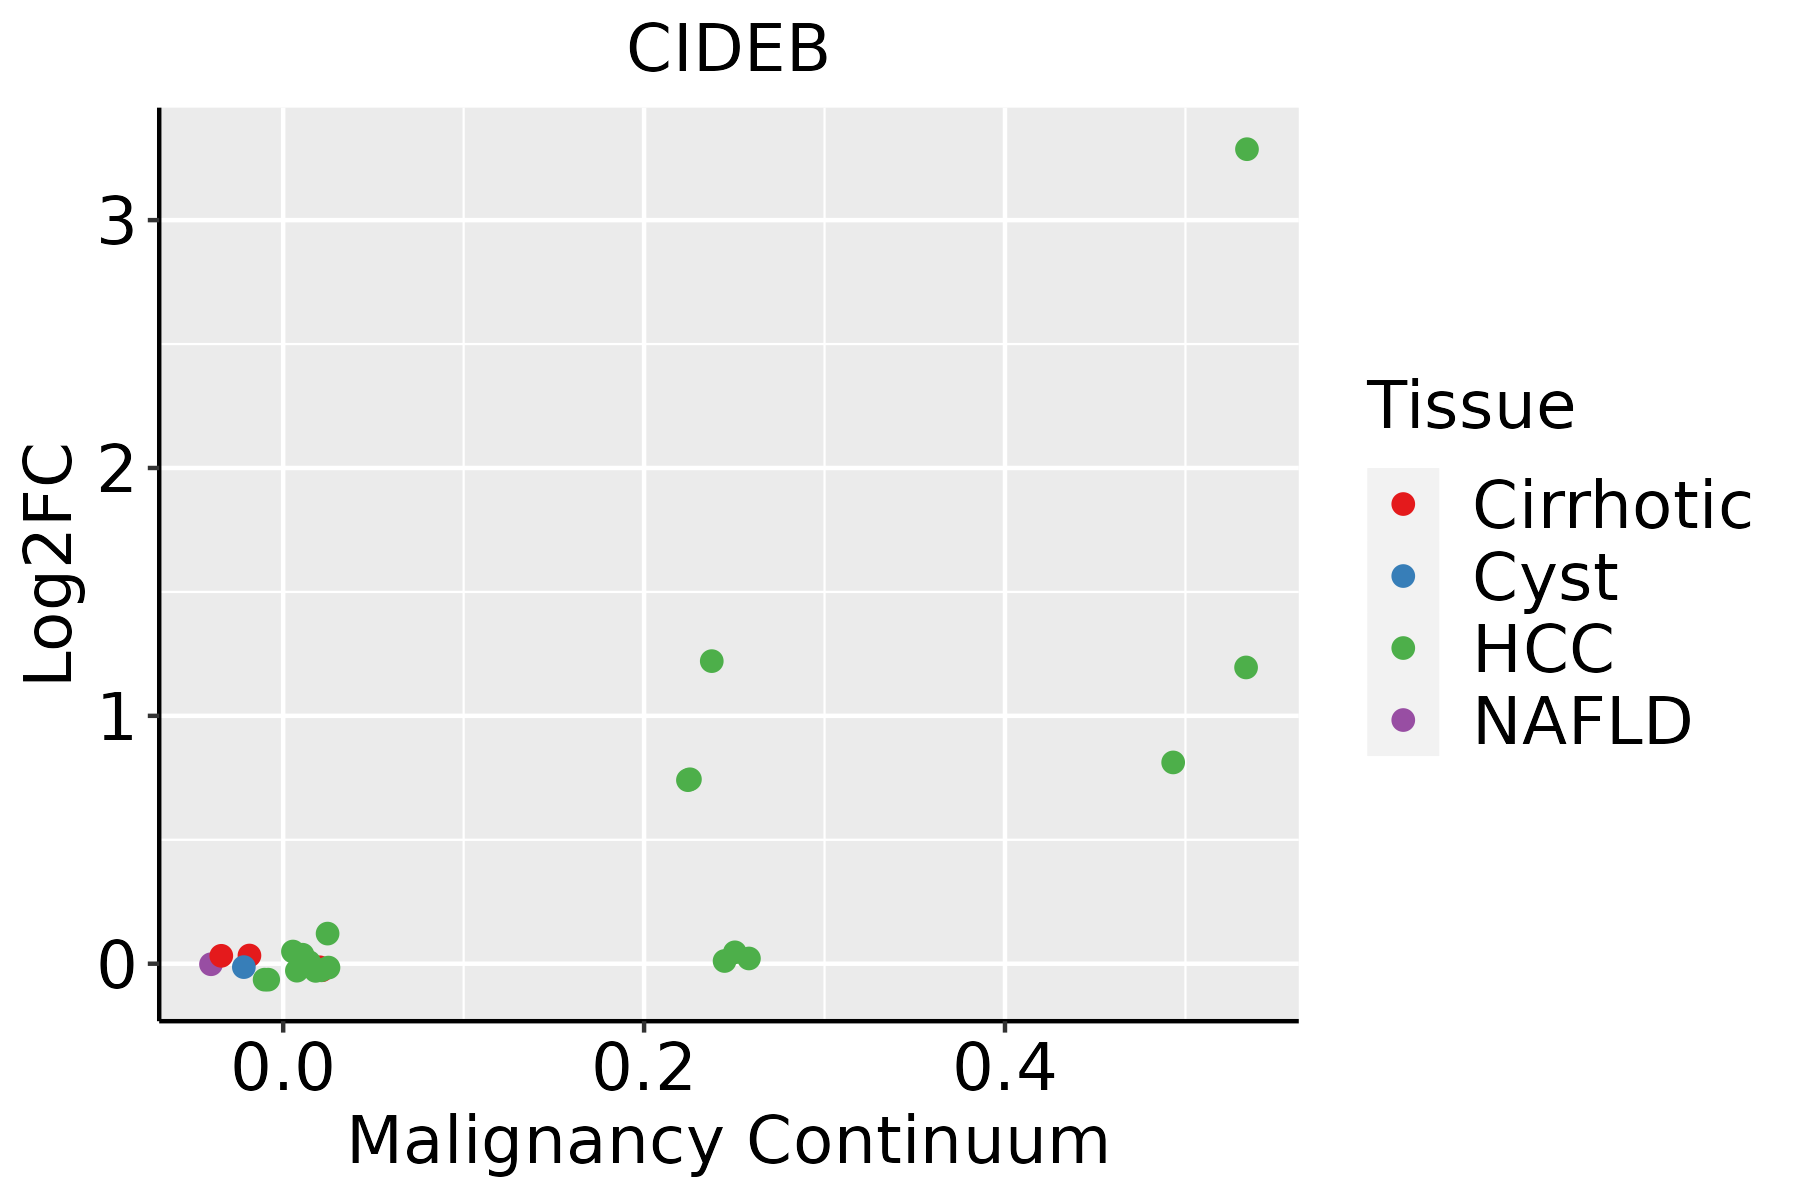 | HCC: Hepatocellular carcinoma |
| NAFLD: Non-alcoholic fatty liver disease | ||
| Oral Cavity | 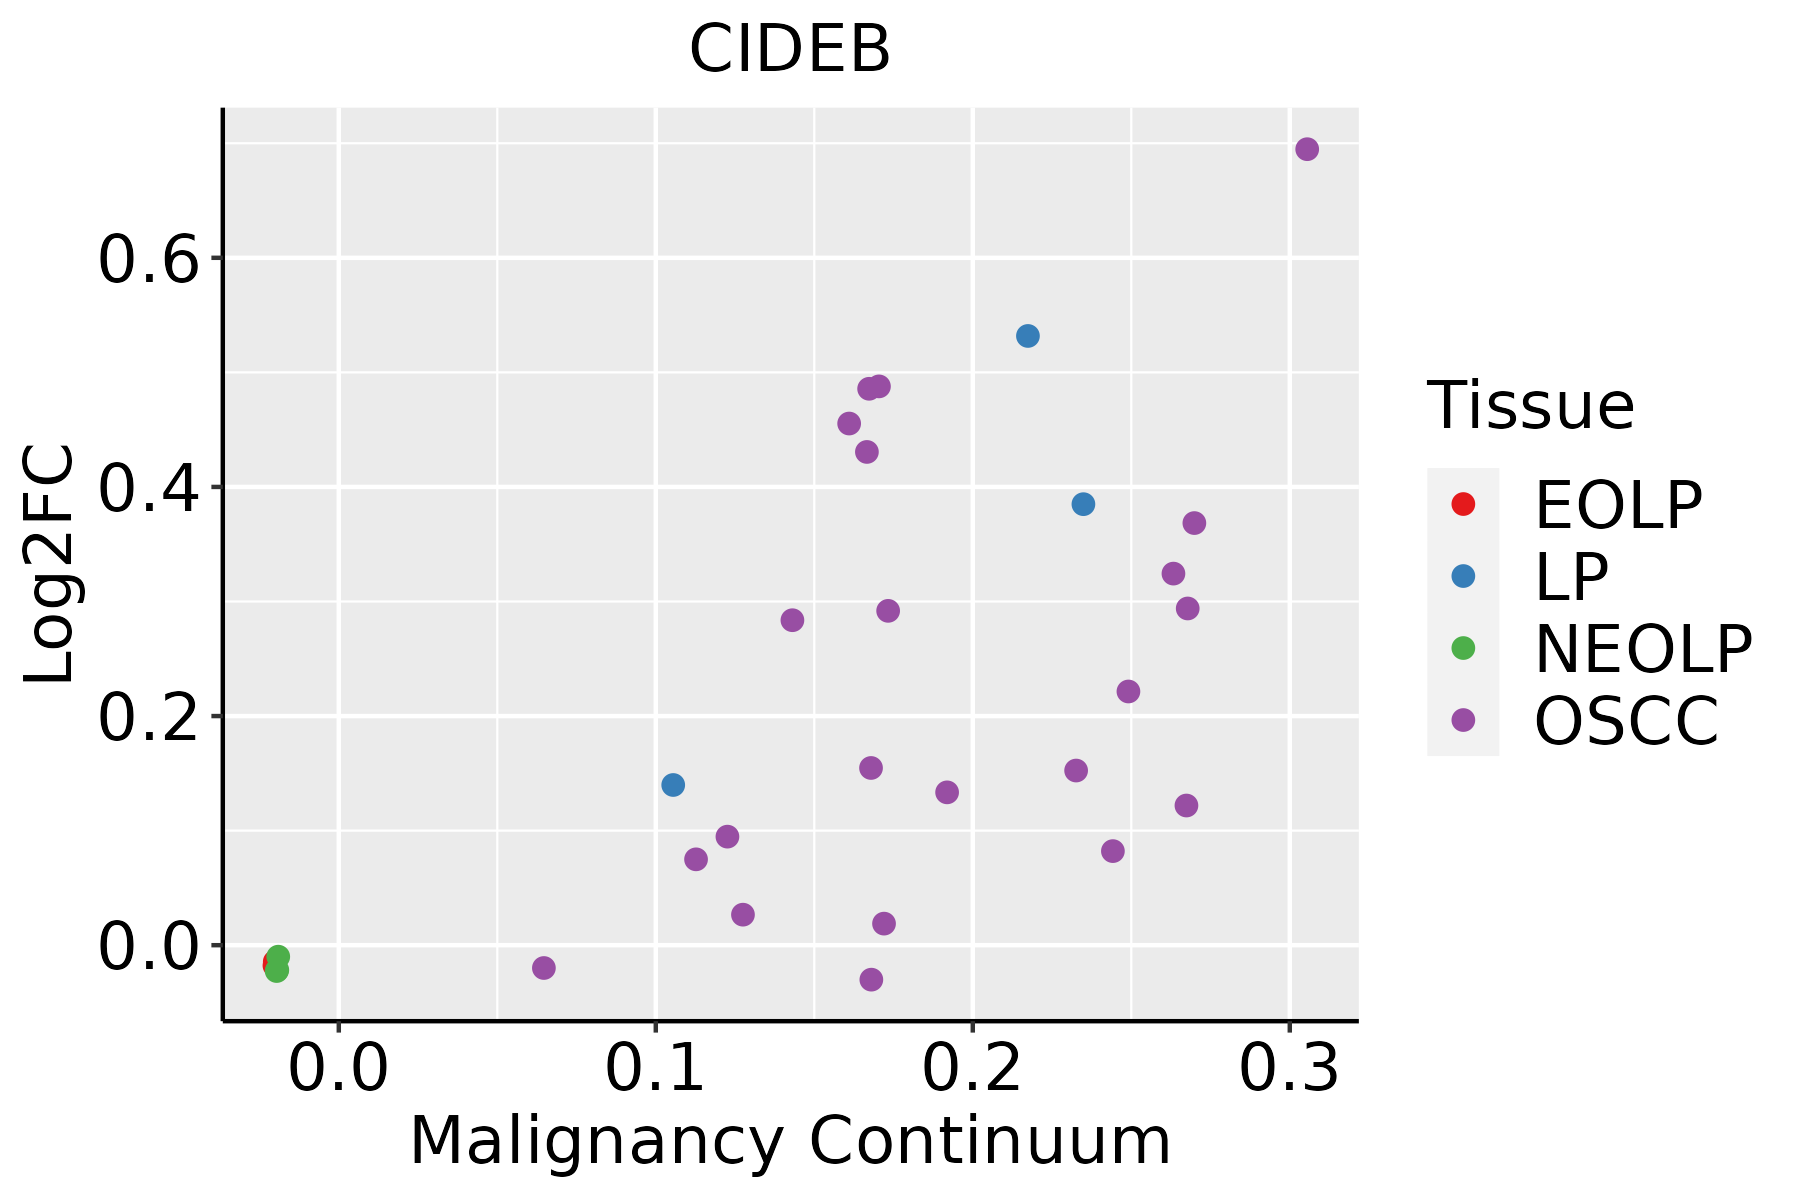 | EOLP: Erosive Oral lichen planus |
| LP: leukoplakia | ||
| NEOLP: Non-erosive oral lichen planus | ||
| OSCC: Oral squamous cell carcinoma |
| ∗log2FC in expression of this searched gene in stem-like cells from each diseased tissue sample relative to stem-like cells in normal samples in each tissue plotted against the malignancy continuum. Samples are colored based on if they are from different disease stage. |
Top |
Malignant transformation related pathway analysis |
| Find out the enriched GO biological processes and KEGG pathways involved in transition from healthy to precancer to cancer |
| Tissue | Disease Stage | Enriched GO biological Processes |
| Colorectum | AD |  |
| Colorectum | SER |  |
| Colorectum | MSS |  |
| Colorectum | MSI-H |  |
| Colorectum | FAP |  |
| ∗Top 15 enriched GO BP terms are showed in the bar plot of each disease state in each tissue. Each row represents a significant GO biological process which is colored according to the -log10(p.adjust). |
| Page: 1 2 3 4 5 6 7 8 9 |
| GO ID | Tissue | Disease Stage | Description | Gene Ratio | Bg Ratio | pvalue | p.adjust | Count |
| GO:003166722 | Liver | HCC | response to nutrient levels | 276/7958 | 474/18723 | 2.30e-12 | 1.08e-10 | 276 |
| GO:001082112 | Liver | HCC | regulation of mitochondrion organization | 96/7958 | 144/18723 | 3.82e-09 | 1.02e-07 | 96 |
| GO:005160412 | Liver | HCC | protein maturation | 171/7958 | 294/18723 | 3.80e-08 | 8.30e-07 | 171 |
| GO:200011612 | Liver | HCC | regulation of cysteine-type endopeptidase activity | 137/7958 | 235/18723 | 6.91e-07 | 1.08e-05 | 137 |
| GO:005254722 | Liver | HCC | regulation of peptidase activity | 247/7958 | 461/18723 | 8.28e-07 | 1.27e-05 | 247 |
| GO:000863712 | Liver | HCC | apoptotic mitochondrial changes | 70/7958 | 107/18723 | 1.39e-06 | 2.01e-05 | 70 |
| GO:005254822 | Liver | HCC | regulation of endopeptidase activity | 230/7958 | 432/18723 | 3.58e-06 | 4.68e-05 | 230 |
| GO:001082211 | Liver | HCC | positive regulation of mitochondrion organization | 48/7958 | 74/18723 | 8.50e-05 | 7.46e-04 | 48 |
| GO:001095212 | Liver | HCC | positive regulation of peptidase activity | 110/7958 | 197/18723 | 1.04e-04 | 8.98e-04 | 110 |
| GO:000183612 | Liver | HCC | release of cytochrome c from mitochondria | 39/7958 | 59/18723 | 2.14e-04 | 1.63e-03 | 39 |
| GO:001648511 | Liver | HCC | protein processing | 121/7958 | 225/18723 | 4.01e-04 | 2.71e-03 | 121 |
| GO:000863011 | Liver | HCC | intrinsic apoptotic signaling pathway in response to DNA damage | 58/7958 | 99/18723 | 8.97e-04 | 5.29e-03 | 58 |
| GO:00316382 | Liver | HCC | zymogen activation | 38/7958 | 60/18723 | 9.06e-04 | 5.33e-03 | 38 |
| GO:0038183 | Liver | HCC | bile acid signaling pathway | 12/7958 | 14/18723 | 1.17e-03 | 6.54e-03 | 12 |
| GO:00901995 | Liver | HCC | regulation of release of cytochrome c from mitochondria | 31/7958 | 48/18723 | 1.66e-03 | 8.71e-03 | 31 |
| GO:001095012 | Liver | HCC | positive regulation of endopeptidase activity | 96/7958 | 179/18723 | 1.68e-03 | 8.79e-03 | 96 |
| GO:200105612 | Liver | HCC | positive regulation of cysteine-type endopeptidase activity | 79/7958 | 148/18723 | 4.82e-03 | 2.03e-02 | 79 |
| GO:0097194 | Liver | HCC | execution phase of apoptosis | 48/7958 | 85/18723 | 6.47e-03 | 2.63e-02 | 48 |
| GO:009719320 | Oral cavity | OSCC | intrinsic apoptotic signaling pathway | 202/7305 | 288/18723 | 4.64e-27 | 1.73e-24 | 202 |
| GO:004586220 | Oral cavity | OSCC | positive regulation of proteolysis | 236/7305 | 372/18723 | 6.53e-22 | 1.38e-19 | 236 |
| Page: 1 2 3 4 5 6 |
| Pathway ID | Tissue | Disease Stage | Description | Gene Ratio | Bg Ratio | pvalue | p.adjust | qvalue | Count |
| hsa049794 | Liver | HCC | Cholesterol metabolism | 41/4020 | 51/8465 | 1.33e-06 | 1.35e-05 | 7.49e-06 | 41 |
| hsa049795 | Liver | HCC | Cholesterol metabolism | 41/4020 | 51/8465 | 1.33e-06 | 1.35e-05 | 7.49e-06 | 41 |
| hsa04979 | Stomach | SIM | Cholesterol metabolism | 8/465 | 51/8465 | 6.17e-03 | 3.83e-02 | 3.08e-02 | 8 |
| hsa049791 | Stomach | SIM | Cholesterol metabolism | 8/465 | 51/8465 | 6.17e-03 | 3.83e-02 | 3.08e-02 | 8 |
| Page: 1 |
Top |
Cell-cell communication analysis |
| Identification of potential cell-cell interactions between two cell types and their ligand-receptor pairs for different disease states |
| Ligand | Receptor | LRpair | Pathway | Tissue | Disease Stage |
| Page: 1 |
Top |
Single-cell gene regulatory network inference analysis |
| Find out the significant the regulons (TFs) and the target genes of each regulon across cell types for different disease states |
| TF | Cell Type | Tissue | Disease Stage | Target Gene | RSS | Regulon Activity |
| ∗The dot plots of a searched regulon are shown for all cell subpopulations in each disease state of each tissue based on the regulon specific score inferred using pySCENIC and by calculating the average expression. |
| Page: 1 |
Top |
Somatic mutation of malignant transformation related genes |
| Annotation of somatic variants for genes involved in malignant transformation |
| Hugo Symbol | Variant Class | Variant Classification | dbSNP RS | HGVSc | HGVSp | HGVSp Short | SWISSPROT | BIOTYPE | SIFT | PolyPhen | Tumor Sample Barcode | Tissue | Histology | Sex | Age | Stage | Therapy Types | Drugs | Outcome |
| CIDEB | insertion | Frame_Shift_Ins | novel | c.233_234insATGGAGTGCTAACCCTGGTGCTAGA | p.Glu79TrpfsTer17 | p.E79Wfs*17 | Q9UHD4 | protein_coding | TCGA-A2-A1G4-01 | Breast | breast invasive carcinoma | Female | >=65 | III/IV | Chemotherapy | adriamycin | SD | ||
| CIDEB | SNV | Missense_Mutation | novel | c.369N>C | p.Glu123Asp | p.E123D | Q9UHD4 | protein_coding | tolerated(0.34) | benign(0.005) | TCGA-EK-A3GK-01 | Cervix | cervical & endocervical cancer | Female | <65 | I/II | Unknown | Unknown | SD |
| CIDEB | SNV | Missense_Mutation | c.482N>G | p.Ser161Cys | p.S161C | Q9UHD4 | protein_coding | deleterious(0) | possibly_damaging(0.75) | TCGA-IR-A3LA-01 | Cervix | cervical & endocervical cancer | Female | <65 | I/II | Chemotherapy | cisplatin | CR | |
| CIDEB | SNV | Missense_Mutation | c.208N>T | p.Asn70Tyr | p.N70Y | Q9UHD4 | protein_coding | deleterious(0.03) | benign(0) | TCGA-AY-6197-01 | Colorectum | colon adenocarcinoma | Male | <65 | I/II | Unknown | Unknown | SD | |
| CIDEB | SNV | Missense_Mutation | novel | c.639N>T | p.Lys213Asn | p.K213N | Q9UHD4 | protein_coding | tolerated(0.13) | benign(0.001) | TCGA-A5-A2K7-01 | Endometrium | uterine corpus endometrioid carcinoma | Female | <65 | I/II | Chemotherapy | taxol | SD |
| CIDEB | SNV | Missense_Mutation | c.66N>C | p.Glu22Asp | p.E22D | Q9UHD4 | protein_coding | tolerated(0.44) | benign(0) | TCGA-AP-A059-01 | Endometrium | uterine corpus endometrioid carcinoma | Female | >=65 | I/II | Unknown | Unknown | SD | |
| CIDEB | SNV | Missense_Mutation | rs146066890 | c.644N>A | p.Arg215His | p.R215H | Q9UHD4 | protein_coding | tolerated(0.07) | benign(0.001) | TCGA-AX-A06F-01 | Endometrium | uterine corpus endometrioid carcinoma | Female | <65 | III/IV | Chemotherapy | carboplatin | SD |
| CIDEB | SNV | Missense_Mutation | rs368449983 | c.539G>A | p.Arg180His | p.R180H | Q9UHD4 | protein_coding | deleterious(0.01) | benign(0.007) | TCGA-B5-A11U-01 | Endometrium | uterine corpus endometrioid carcinoma | Female | >=65 | III/IV | Unknown | Unknown | SD |
| CIDEB | SNV | Missense_Mutation | novel | c.436N>T | p.Leu146Phe | p.L146F | Q9UHD4 | protein_coding | tolerated(0.89) | possibly_damaging(0.548) | TCGA-EO-A22U-01 | Endometrium | uterine corpus endometrioid carcinoma | Female | >=65 | I/II | Unknown | Unknown | SD |
| CIDEB | SNV | Missense_Mutation | novel | c.400N>C | p.Phe134Leu | p.F134L | Q9UHD4 | protein_coding | tolerated(0.17) | benign(0) | TCGA-FV-A3R3-01 | Liver | liver hepatocellular carcinoma | Female | <65 | I/II | Unknown | Unknown | SD |
| Page: 1 2 |
Top |
Related drugs of malignant transformation related genes |
| Identification of chemicals and drugs interact with genes involved in malignant transfromation |
| (DGIdb 4.0) |
| Entrez ID | Symbol | Category | Interaction Types | Drug Claim Name | Drug Name | PMIDs |
| Page: 1 |

Copyright 2023-Present -The University of Texas Health Science Center at Houston |