
|
|||||
|
 | |
| |
| |
| |
| |
| |
|
Gene: CENPA |
Gene summary for CENPA |
| Gene information | Species | Human | Gene symbol | CENPA | Gene ID | 1058 |
| Gene name | centromere protein A | |
| Gene Alias | CENP-A | |
| Cytomap | 2p23.3 | |
| Gene Type | protein-coding | GO ID | GO:0000132 | UniProtAcc | P49450 |
Top |
Malignant transformation analysis |
| Identification of the aberrant gene expression in precancerous and cancerous lesions by comparing the gene expression of stem-like cells in diseased tissues with normal stem cells |
| Entrez ID | Symbol | Replicates | Species | Organ | Tissue | Adj P-value | Log2FC | Malignancy |
| 1058 | CENPA | P2T-E | Human | Esophagus | ESCC | 4.30e-10 | 7.63e-01 | 0.1177 |
| 1058 | CENPA | P4T-E | Human | Esophagus | ESCC | 2.11e-11 | 6.63e-01 | 0.1323 |
| 1058 | CENPA | P5T-E | Human | Esophagus | ESCC | 9.67e-18 | 4.51e-01 | 0.1327 |
| 1058 | CENPA | P9T-E | Human | Esophagus | ESCC | 2.41e-06 | 2.59e-01 | 0.1131 |
| 1058 | CENPA | P10T-E | Human | Esophagus | ESCC | 9.53e-09 | 5.27e-01 | 0.116 |
| 1058 | CENPA | P15T-E | Human | Esophagus | ESCC | 1.35e-04 | 2.68e-01 | 0.1149 |
| 1058 | CENPA | P16T-E | Human | Esophagus | ESCC | 1.66e-02 | 1.38e-01 | 0.1153 |
| 1058 | CENPA | P17T-E | Human | Esophagus | ESCC | 4.79e-04 | 3.00e-01 | 0.1278 |
| 1058 | CENPA | P20T-E | Human | Esophagus | ESCC | 5.73e-03 | 2.74e-01 | 0.1124 |
| 1058 | CENPA | P21T-E | Human | Esophagus | ESCC | 9.02e-11 | 5.05e-01 | 0.1617 |
| 1058 | CENPA | P22T-E | Human | Esophagus | ESCC | 4.31e-06 | 3.72e-01 | 0.1236 |
| 1058 | CENPA | P24T-E | Human | Esophagus | ESCC | 4.16e-22 | 7.20e-01 | 0.1287 |
| 1058 | CENPA | P26T-E | Human | Esophagus | ESCC | 4.31e-06 | 3.07e-01 | 0.1276 |
| 1058 | CENPA | P28T-E | Human | Esophagus | ESCC | 4.40e-09 | 2.96e-01 | 0.1149 |
| 1058 | CENPA | P30T-E | Human | Esophagus | ESCC | 1.02e-02 | 2.55e-01 | 0.137 |
| 1058 | CENPA | P31T-E | Human | Esophagus | ESCC | 9.56e-08 | 3.83e-01 | 0.1251 |
| 1058 | CENPA | P32T-E | Human | Esophagus | ESCC | 4.12e-11 | 3.88e-01 | 0.1666 |
| 1058 | CENPA | P36T-E | Human | Esophagus | ESCC | 2.11e-03 | 3.11e-01 | 0.1187 |
| 1058 | CENPA | P37T-E | Human | Esophagus | ESCC | 1.22e-13 | 4.94e-01 | 0.1371 |
| 1058 | CENPA | P38T-E | Human | Esophagus | ESCC | 2.58e-10 | 6.89e-01 | 0.127 |
| Page: 1 2 3 |
| Tissue | Expression Dynamics | Abbreviation |
| Esophagus |  | ESCC: Esophageal squamous cell carcinoma |
| HGIN: High-grade intraepithelial neoplasias | ||
| LGIN: Low-grade intraepithelial neoplasias | ||
| Oral Cavity | 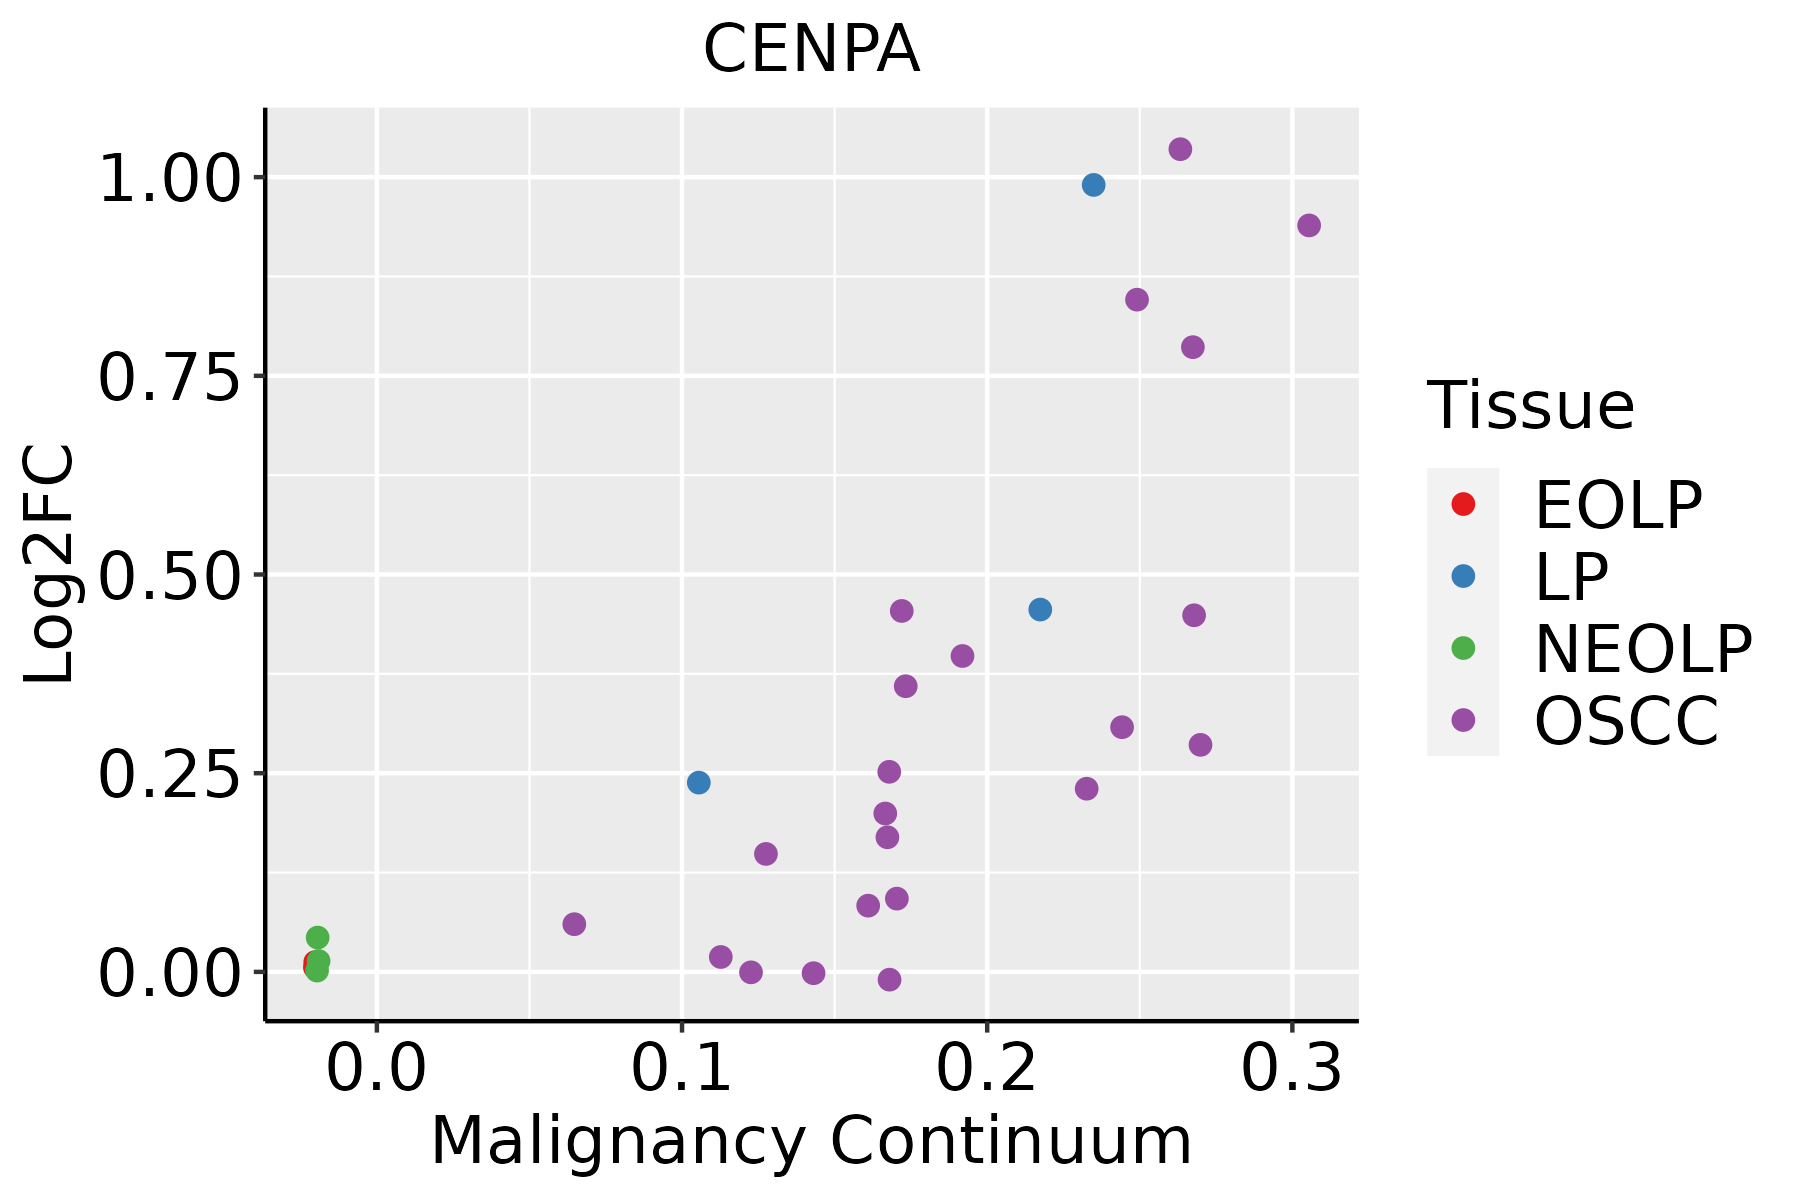 | EOLP: Erosive Oral lichen planus |
| LP: leukoplakia | ||
| NEOLP: Non-erosive oral lichen planus | ||
| OSCC: Oral squamous cell carcinoma | ||
| Skin | 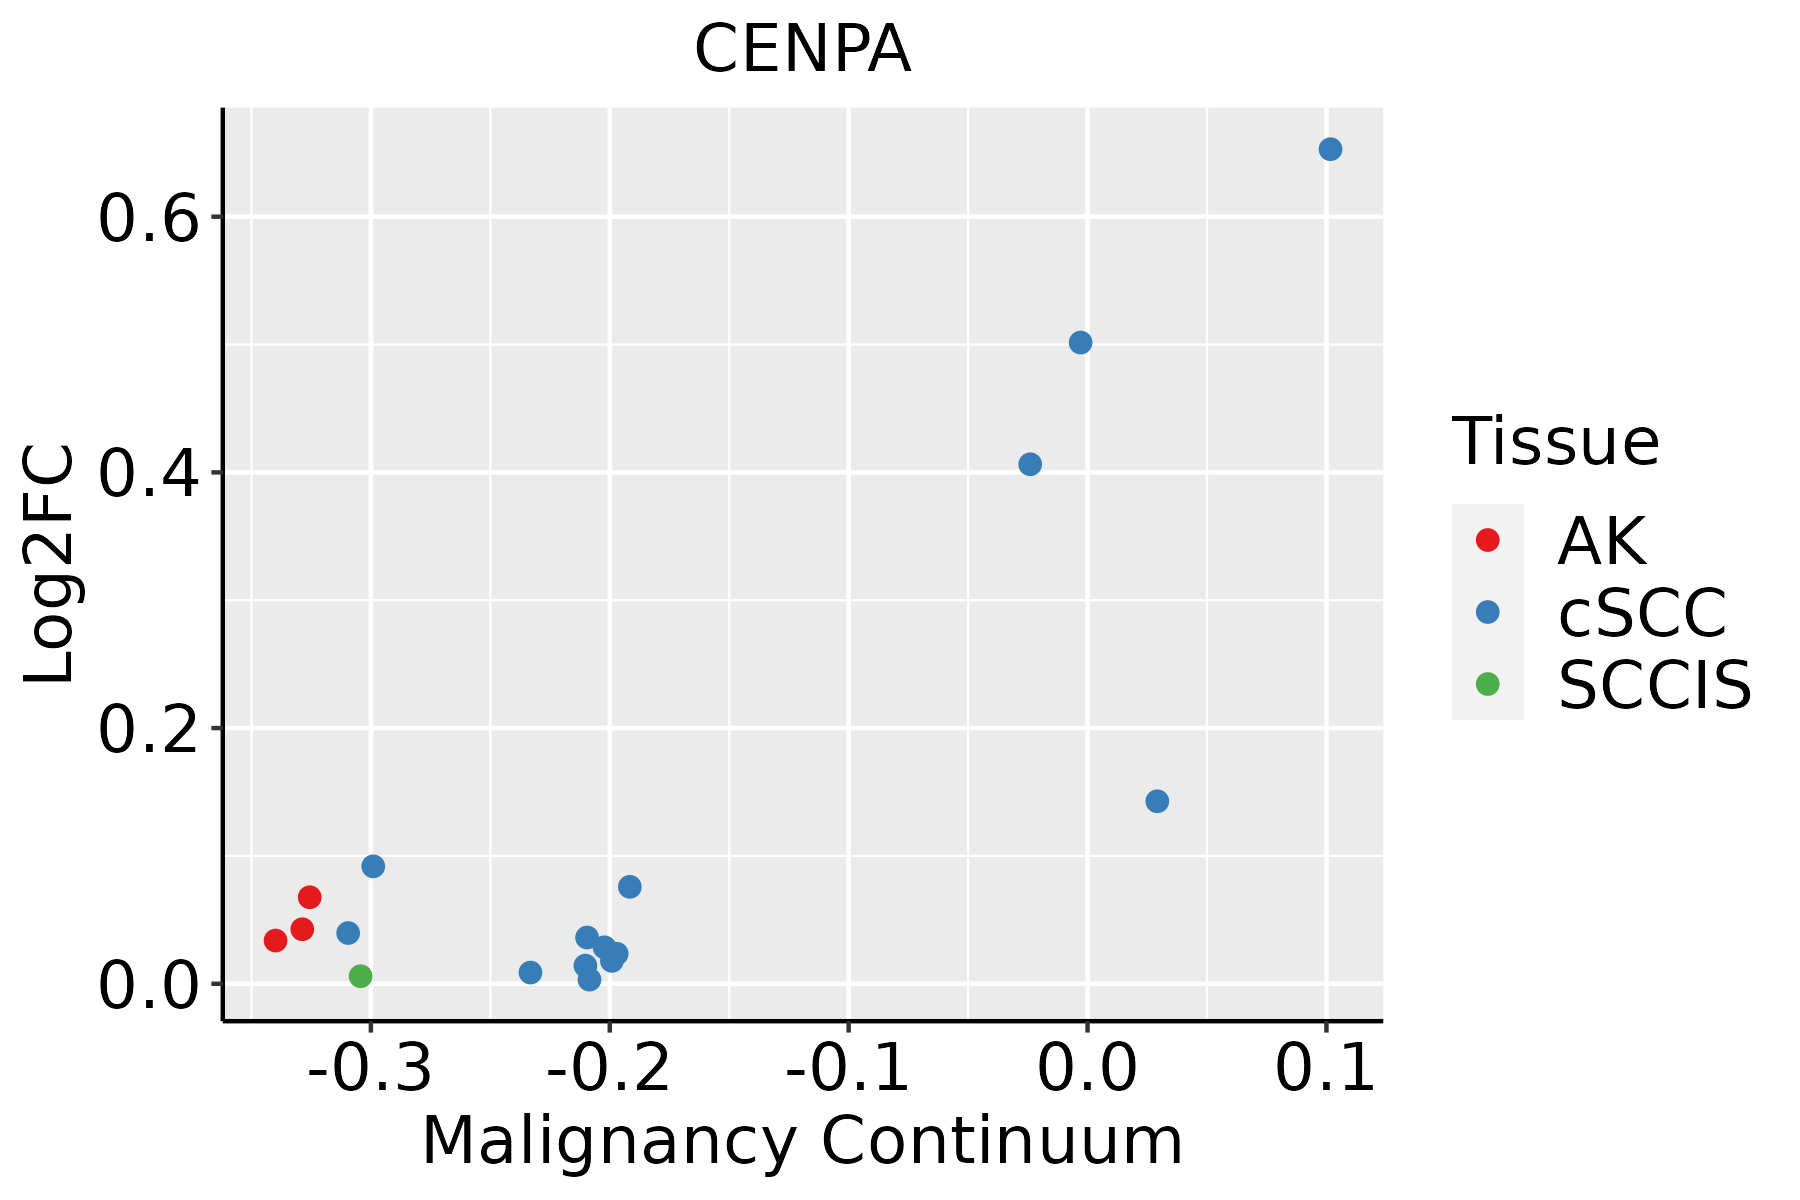 | AK: Actinic keratosis |
| cSCC: Cutaneous squamous cell carcinoma | ||
| SCCIS:squamous cell carcinoma in situ | ||
| Thyroid | 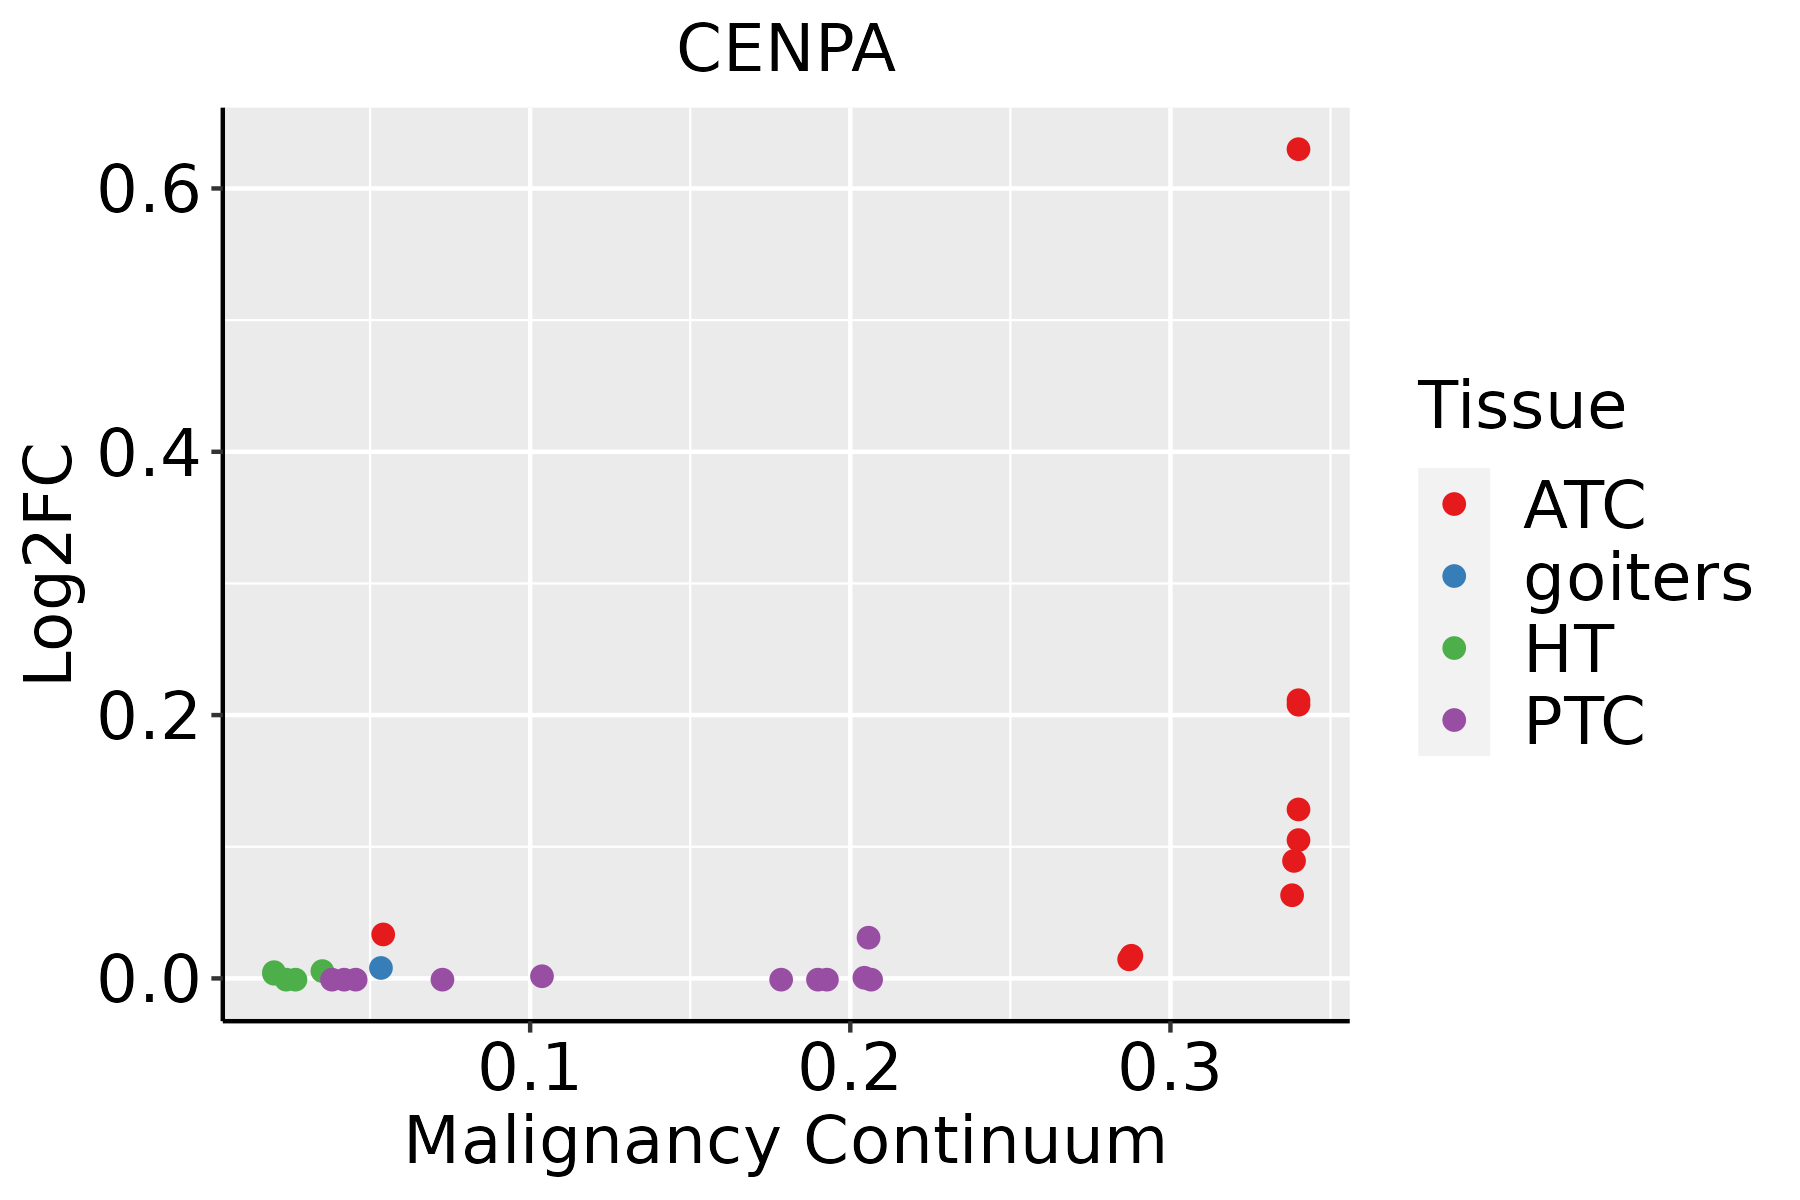 | ATC: Anaplastic thyroid cancer |
| HT: Hashimoto's thyroiditis | ||
| PTC: Papillary thyroid cancer |
| ∗log2FC in expression of this searched gene in stem-like cells from each diseased tissue sample relative to stem-like cells in normal samples in each tissue plotted against the malignancy continuum. Samples are colored based on if they are from different disease stage. |
Top |
Malignant transformation related pathway analysis |
| Find out the enriched GO biological processes and KEGG pathways involved in transition from healthy to precancer to cancer |
| Tissue | Disease Stage | Enriched GO biological Processes |
| Colorectum | AD |  |
| Colorectum | SER |  |
| Colorectum | MSS |  |
| Colorectum | MSI-H |  |
| Colorectum | FAP |  |
| ∗Top 15 enriched GO BP terms are showed in the bar plot of each disease state in each tissue. Each row represents a significant GO biological process which is colored according to the -log10(p.adjust). |
| Page: 1 2 3 4 5 6 7 8 9 |
| GO ID | Tissue | Disease Stage | Description | Gene Ratio | Bg Ratio | pvalue | p.adjust | Count |
| GO:00002815 | Oral cavity | OSCC | mitotic cytokinesis | 51/7305 | 71/18723 | 2.01e-08 | 3.95e-07 | 51 |
| GO:00345023 | Oral cavity | OSCC | protein localization to chromosome | 60/7305 | 92/18723 | 3.17e-07 | 4.79e-06 | 60 |
| GO:000091010 | Oral cavity | OSCC | cytokinesis | 97/7305 | 173/18723 | 3.82e-06 | 4.51e-05 | 97 |
| GO:003001016 | Oral cavity | OSCC | establishment of cell polarity | 82/7305 | 143/18723 | 6.56e-06 | 7.24e-05 | 82 |
| GO:00616405 | Oral cavity | OSCC | cytoskeleton-dependent cytokinesis | 60/7305 | 100/18723 | 1.69e-05 | 1.67e-04 | 60 |
| GO:0051383 | Oral cavity | OSCC | kinetochore organization | 18/7305 | 23/18723 | 1.47e-04 | 1.04e-03 | 18 |
| GO:0034508 | Oral cavity | OSCC | centromere complex assembly | 21/7305 | 30/18723 | 5.75e-04 | 3.30e-03 | 21 |
| GO:0051382 | Oral cavity | OSCC | kinetochore assembly | 14/7305 | 18/18723 | 9.51e-04 | 4.96e-03 | 14 |
| GO:0071459 | Oral cavity | OSCC | protein localization to chromosome, centromeric region | 17/7305 | 25/18723 | 3.16e-03 | 1.36e-02 | 17 |
| GO:0051294 | Oral cavity | OSCC | establishment of spindle orientation | 22/7305 | 37/18723 | 9.34e-03 | 3.34e-02 | 22 |
| GO:00516532 | Oral cavity | OSCC | spindle localization | 31/7305 | 56/18723 | 9.53e-03 | 3.39e-02 | 31 |
| GO:0040001 | Oral cavity | OSCC | establishment of mitotic spindle localization | 21/7305 | 35/18723 | 9.58e-03 | 3.40e-02 | 21 |
| GO:005165624 | Skin | cSCC | establishment of organelle localization | 178/4864 | 390/18723 | 2.18e-17 | 2.32e-15 | 178 |
| GO:190285016 | Skin | cSCC | microtubule cytoskeleton organization involved in mitosis | 85/4864 | 147/18723 | 2.66e-16 | 2.39e-14 | 85 |
| GO:000028116 | Skin | cSCC | mitotic cytokinesis | 47/4864 | 71/18723 | 1.29e-12 | 7.21e-11 | 47 |
| GO:000716327 | Skin | cSCC | establishment or maintenance of cell polarity | 103/4864 | 218/18723 | 9.44e-12 | 4.85e-10 | 103 |
| GO:006164016 | Skin | cSCC | cytoskeleton-dependent cytokinesis | 57/4864 | 100/18723 | 4.65e-11 | 2.21e-09 | 57 |
| GO:000091021 | Skin | cSCC | cytokinesis | 84/4864 | 173/18723 | 1.36e-10 | 6.04e-09 | 84 |
| GO:003001025 | Skin | cSCC | establishment of cell polarity | 65/4864 | 143/18723 | 3.60e-07 | 7.18e-06 | 65 |
| GO:00345025 | Skin | cSCC | protein localization to chromosome | 44/4864 | 92/18723 | 5.27e-06 | 7.64e-05 | 44 |
| Page: 1 2 3 4 |
| Pathway ID | Tissue | Disease Stage | Description | Gene Ratio | Bg Ratio | pvalue | p.adjust | qvalue | Count |
| Page: 1 |
Top |
Cell-cell communication analysis |
| Identification of potential cell-cell interactions between two cell types and their ligand-receptor pairs for different disease states |
| Ligand | Receptor | LRpair | Pathway | Tissue | Disease Stage |
| Page: 1 |
Top |
Single-cell gene regulatory network inference analysis |
| Find out the significant the regulons (TFs) and the target genes of each regulon across cell types for different disease states |
| TF | Cell Type | Tissue | Disease Stage | Target Gene | RSS | Regulon Activity |
| ∗The dot plots of a searched regulon are shown for all cell subpopulations in each disease state of each tissue based on the regulon specific score inferred using pySCENIC and by calculating the average expression. |
| Page: 1 |
Top |
Somatic mutation of malignant transformation related genes |
| Annotation of somatic variants for genes involved in malignant transformation |
| Hugo Symbol | Variant Class | Variant Classification | dbSNP RS | HGVSc | HGVSp | HGVSp Short | SWISSPROT | BIOTYPE | SIFT | PolyPhen | Tumor Sample Barcode | Tissue | Histology | Sex | Age | Stage | Therapy Types | Drugs | Outcome |
| CENPA | SNV | Missense_Mutation | c.238C>T | p.Arg80Cys | p.R80C | P49450 | protein_coding | tolerated(0.05) | benign(0.054) | TCGA-2W-A8YY-01 | Cervix | cervical & endocervical cancer | Female | <65 | I/II | Chemotherapy | cisplatin | CR | |
| CENPA | SNV | Missense_Mutation | novel | c.203N>A | p.Ser68Asn | p.S68N | P49450 | protein_coding | deleterious(0.01) | possibly_damaging(0.787) | TCGA-A6-3809-01 | Colorectum | colon adenocarcinoma | Female | >=65 | I/II | Unknown | Unknown | SD |
| CENPA | SNV | Missense_Mutation | novel | c.107N>T | p.Ser36Phe | p.S36F | P49450 | protein_coding | tolerated(0.14) | benign(0.28) | TCGA-A5-A0G2-01 | Endometrium | uterine corpus endometrioid carcinoma | Female | <65 | III/IV | Unknown | Unknown | SD |
| CENPA | SNV | Missense_Mutation | novel | c.205C>T | p.Arg69Cys | p.R69C | P49450 | protein_coding | deleterious(0.02) | probably_damaging(0.99) | TCGA-DF-A2KU-01 | Endometrium | uterine corpus endometrioid carcinoma | Female | Unknown | I/II | Unknown | Unknown | SD |
| CENPA | SNV | Missense_Mutation | novel | c.184A>G | p.Ile62Val | p.I62V | P49450 | protein_coding | deleterious(0.04) | benign(0.238) | TCGA-DD-AACH-01 | Liver | liver hepatocellular carcinoma | Male | >=65 | I/II | Unknown | Unknown | PD |
| CENPA | SNV | Missense_Mutation | novel | c.205N>T | p.Arg69Cys | p.R69C | P49450 | protein_coding | deleterious(0.02) | probably_damaging(0.99) | TCGA-78-8640-01 | Lung | lung adenocarcinoma | Male | <65 | I/II | Unknown | Unknown | SD |
| CENPA | SNV | Missense_Mutation | novel | c.206N>T | p.Arg69Leu | p.R69L | P49450 | protein_coding | tolerated(0.06) | benign(0.231) | TCGA-78-8640-01 | Lung | lung adenocarcinoma | Male | <65 | I/II | Unknown | Unknown | SD |
| Page: 1 |
Top |
Related drugs of malignant transformation related genes |
| Identification of chemicals and drugs interact with genes involved in malignant transfromation |
| (DGIdb 4.0) |
| Entrez ID | Symbol | Category | Interaction Types | Drug Claim Name | Drug Name | PMIDs |
| Page: 1 |

Copyright 2023-Present -The University of Texas Health Science Center at Houston |