
|
|||||
|
 | |
| |
| |
| |
| |
| |
|
Gene: CDKN1C |
Gene summary for CDKN1C |
| Gene information | Species | Human | Gene symbol | CDKN1C | Gene ID | 1028 |
| Gene name | cyclin dependent kinase inhibitor 1C | |
| Gene Alias | BWCR | |
| Cytomap | 11p15.4 | |
| Gene Type | protein-coding | GO ID | GO:0000079 | UniProtAcc | P49918 |
Top |
Malignant transformation analysis |
| Identification of the aberrant gene expression in precancerous and cancerous lesions by comparing the gene expression of stem-like cells in diseased tissues with normal stem cells |
| Entrez ID | Symbol | Replicates | Species | Organ | Tissue | Adj P-value | Log2FC | Malignancy |
| 1028 | CDKN1C | LZE7T | Human | Esophagus | ESCC | 6.96e-03 | 1.50e-01 | 0.0667 |
| 1028 | CDKN1C | LZE8T | Human | Esophagus | ESCC | 5.05e-04 | -3.95e-01 | 0.067 |
| 1028 | CDKN1C | LZE22T | Human | Esophagus | ESCC | 3.16e-03 | -1.61e-01 | 0.068 |
| 1028 | CDKN1C | LZE24T | Human | Esophagus | ESCC | 4.06e-05 | -1.02e-01 | 0.0596 |
| 1028 | CDKN1C | P2T-E | Human | Esophagus | ESCC | 4.62e-05 | 2.44e-02 | 0.1177 |
| 1028 | CDKN1C | P4T-E | Human | Esophagus | ESCC | 1.36e-05 | 2.79e-02 | 0.1323 |
| 1028 | CDKN1C | P5T-E | Human | Esophagus | ESCC | 9.39e-05 | -2.26e-01 | 0.1327 |
| 1028 | CDKN1C | P8T-E | Human | Esophagus | ESCC | 1.27e-12 | -6.84e-02 | 0.0889 |
| 1028 | CDKN1C | P9T-E | Human | Esophagus | ESCC | 3.70e-06 | -1.49e-01 | 0.1131 |
| 1028 | CDKN1C | P11T-E | Human | Esophagus | ESCC | 5.94e-05 | 1.21e+00 | 0.1426 |
| 1028 | CDKN1C | P12T-E | Human | Esophagus | ESCC | 2.46e-06 | 1.35e-01 | 0.1122 |
| 1028 | CDKN1C | P15T-E | Human | Esophagus | ESCC | 3.58e-08 | -2.17e-01 | 0.1149 |
| 1028 | CDKN1C | P16T-E | Human | Esophagus | ESCC | 1.78e-13 | -1.74e-01 | 0.1153 |
| 1028 | CDKN1C | P19T-E | Human | Esophagus | ESCC | 1.50e-02 | -2.19e-01 | 0.1662 |
| 1028 | CDKN1C | P20T-E | Human | Esophagus | ESCC | 1.12e-07 | -3.23e-01 | 0.1124 |
| 1028 | CDKN1C | P21T-E | Human | Esophagus | ESCC | 3.74e-07 | -5.61e-03 | 0.1617 |
| 1028 | CDKN1C | P22T-E | Human | Esophagus | ESCC | 6.94e-04 | 1.55e-02 | 0.1236 |
| 1028 | CDKN1C | P26T-E | Human | Esophagus | ESCC | 1.80e-09 | -3.10e-01 | 0.1276 |
| 1028 | CDKN1C | P30T-E | Human | Esophagus | ESCC | 2.01e-05 | -3.79e-01 | 0.137 |
| 1028 | CDKN1C | P31T-E | Human | Esophagus | ESCC | 9.73e-05 | -2.08e-01 | 0.1251 |
| Page: 1 2 3 4 |
| Tissue | Expression Dynamics | Abbreviation |
| Esophagus | 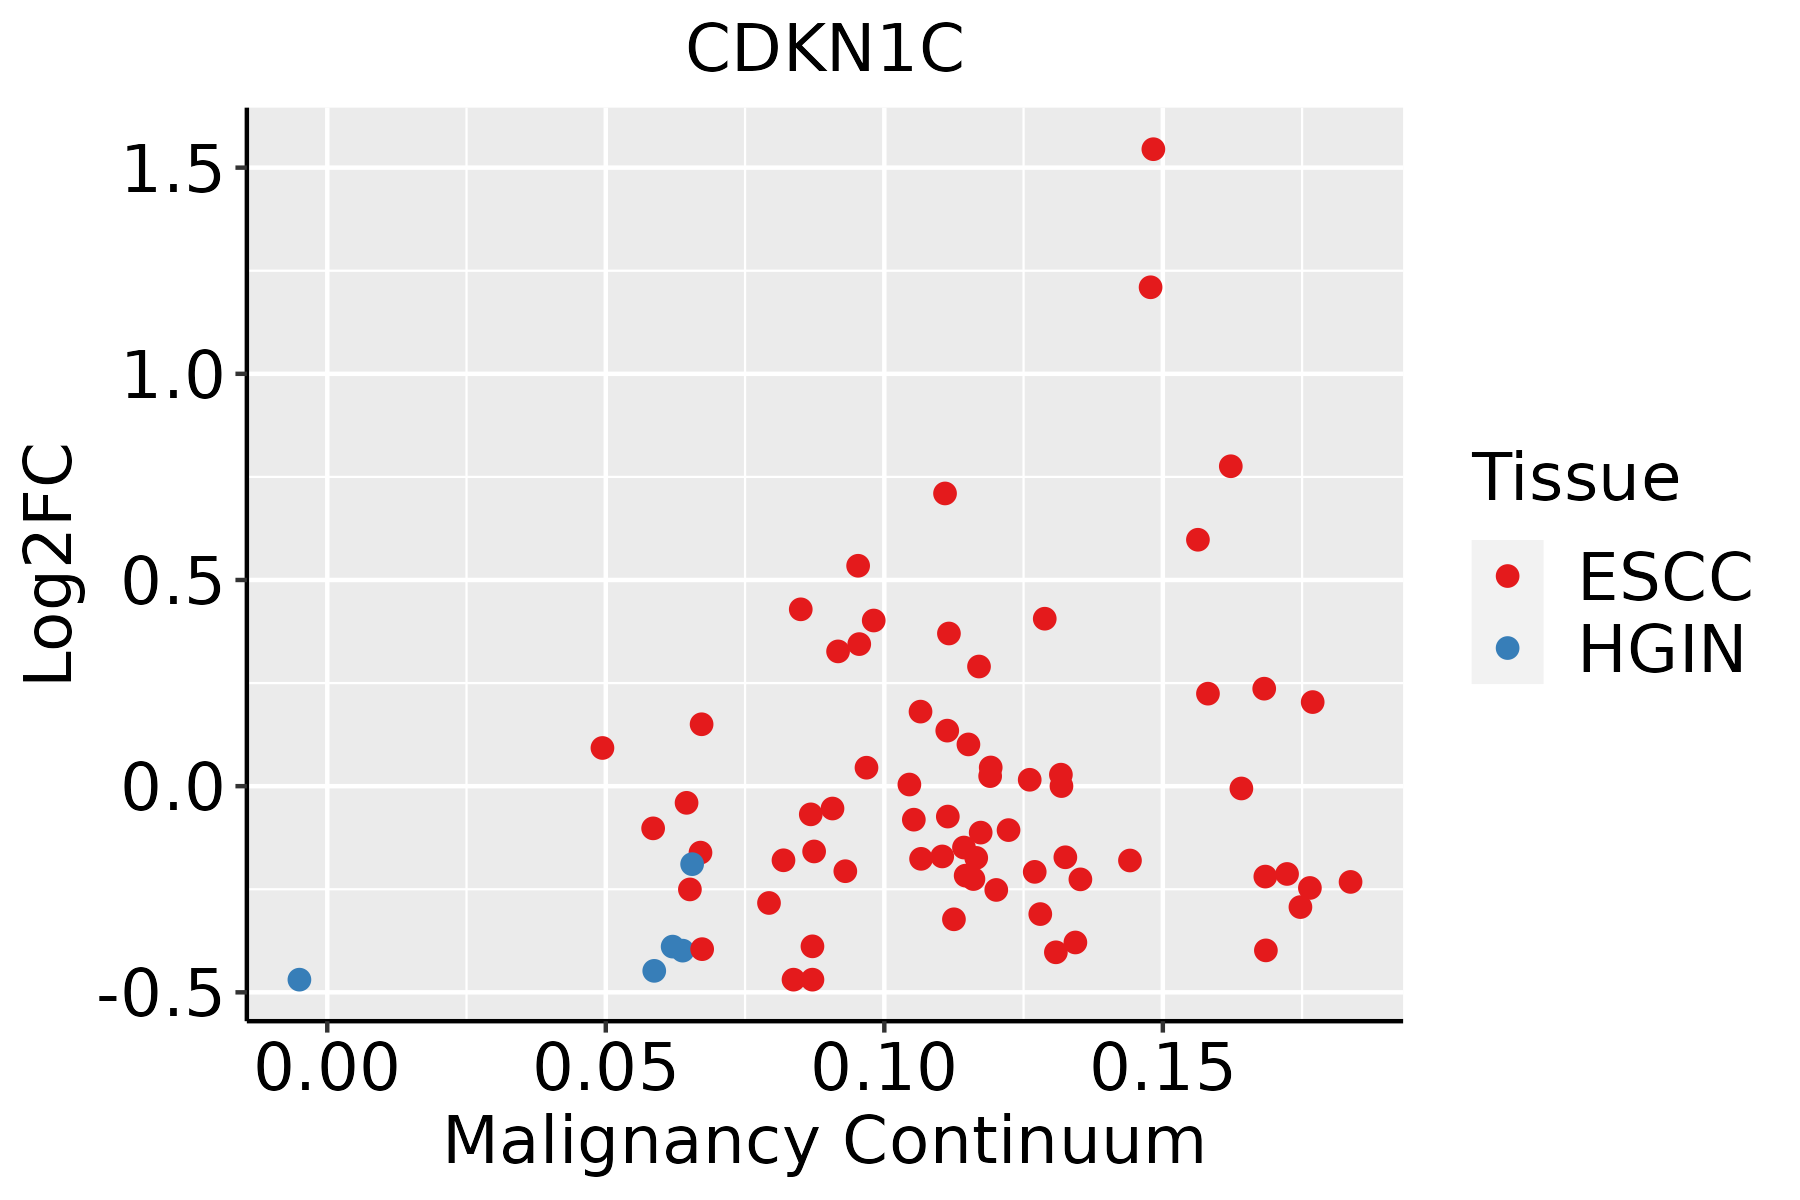 | ESCC: Esophageal squamous cell carcinoma |
| HGIN: High-grade intraepithelial neoplasias | ||
| LGIN: Low-grade intraepithelial neoplasias | ||
| Liver | 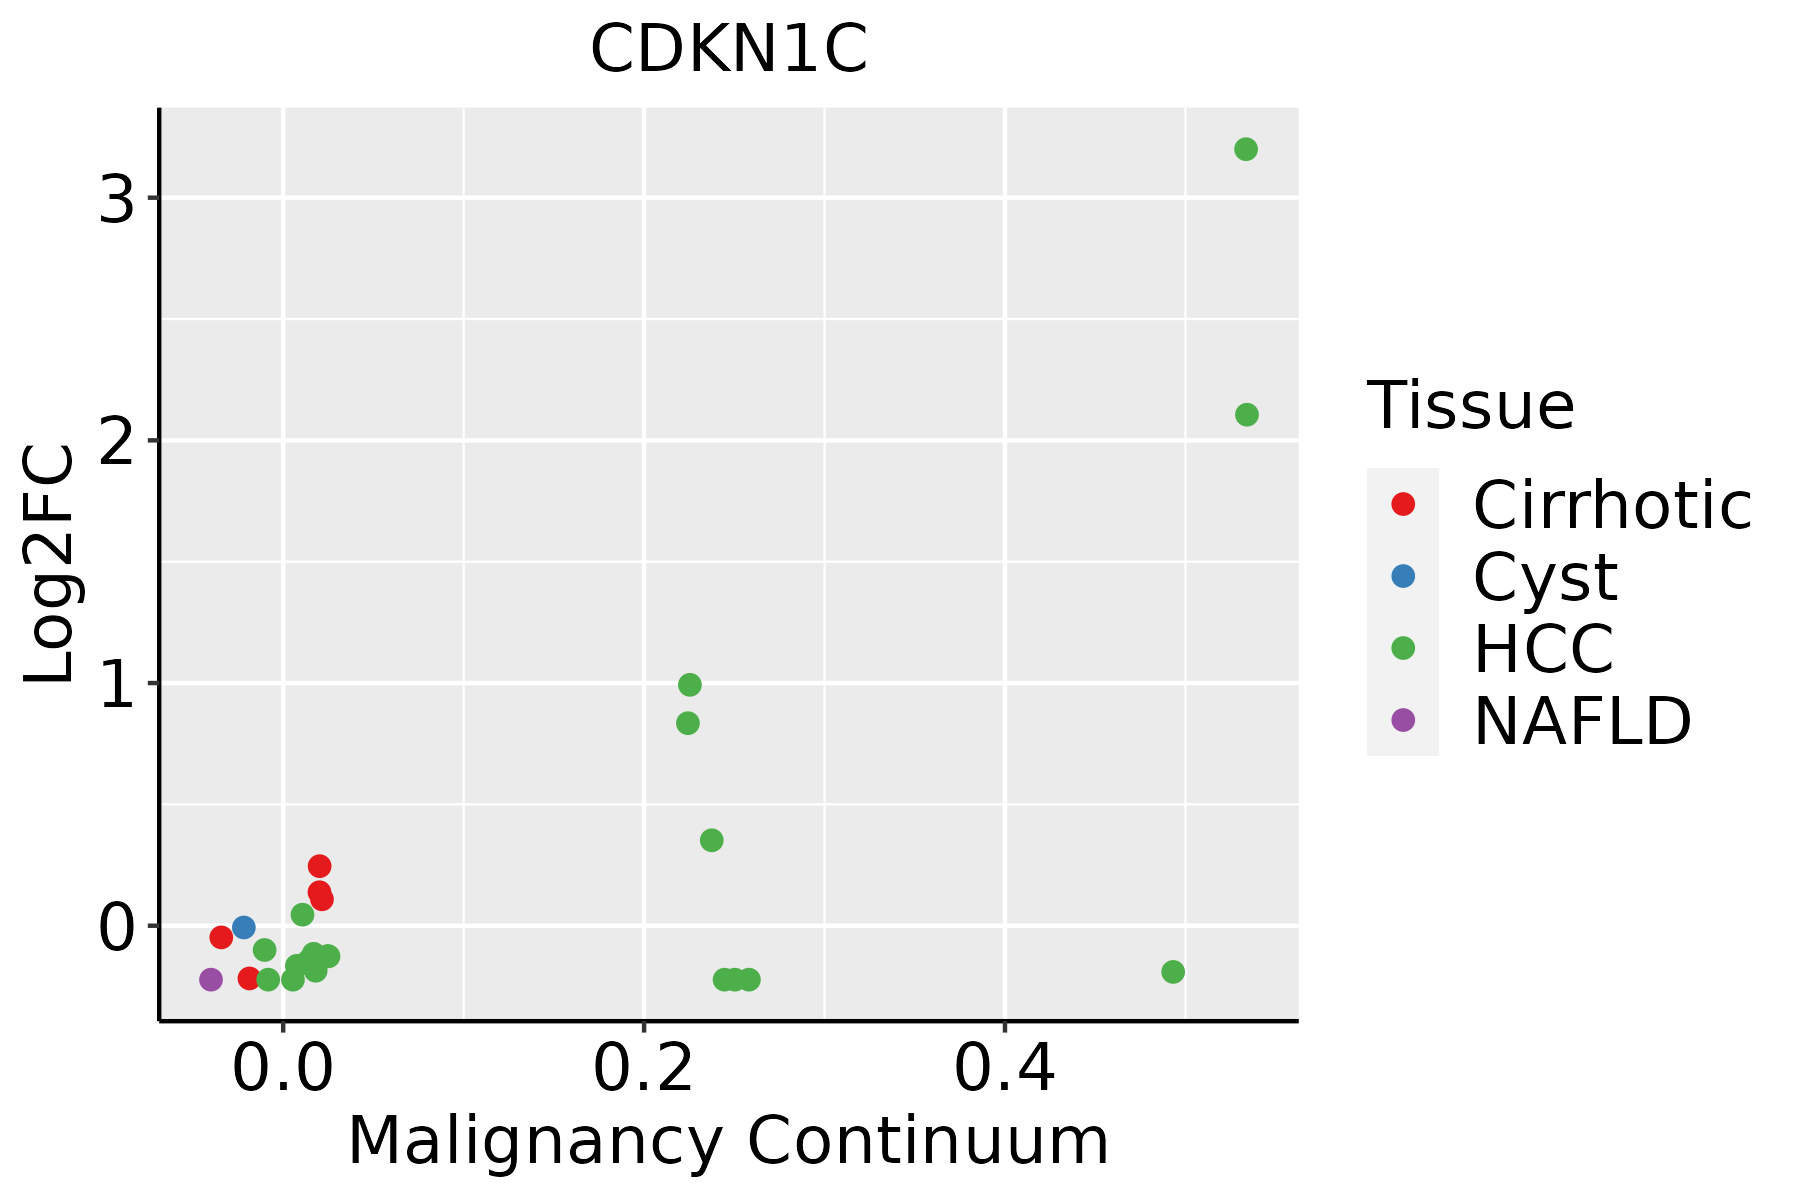 | HCC: Hepatocellular carcinoma |
| NAFLD: Non-alcoholic fatty liver disease | ||
| Oral Cavity | 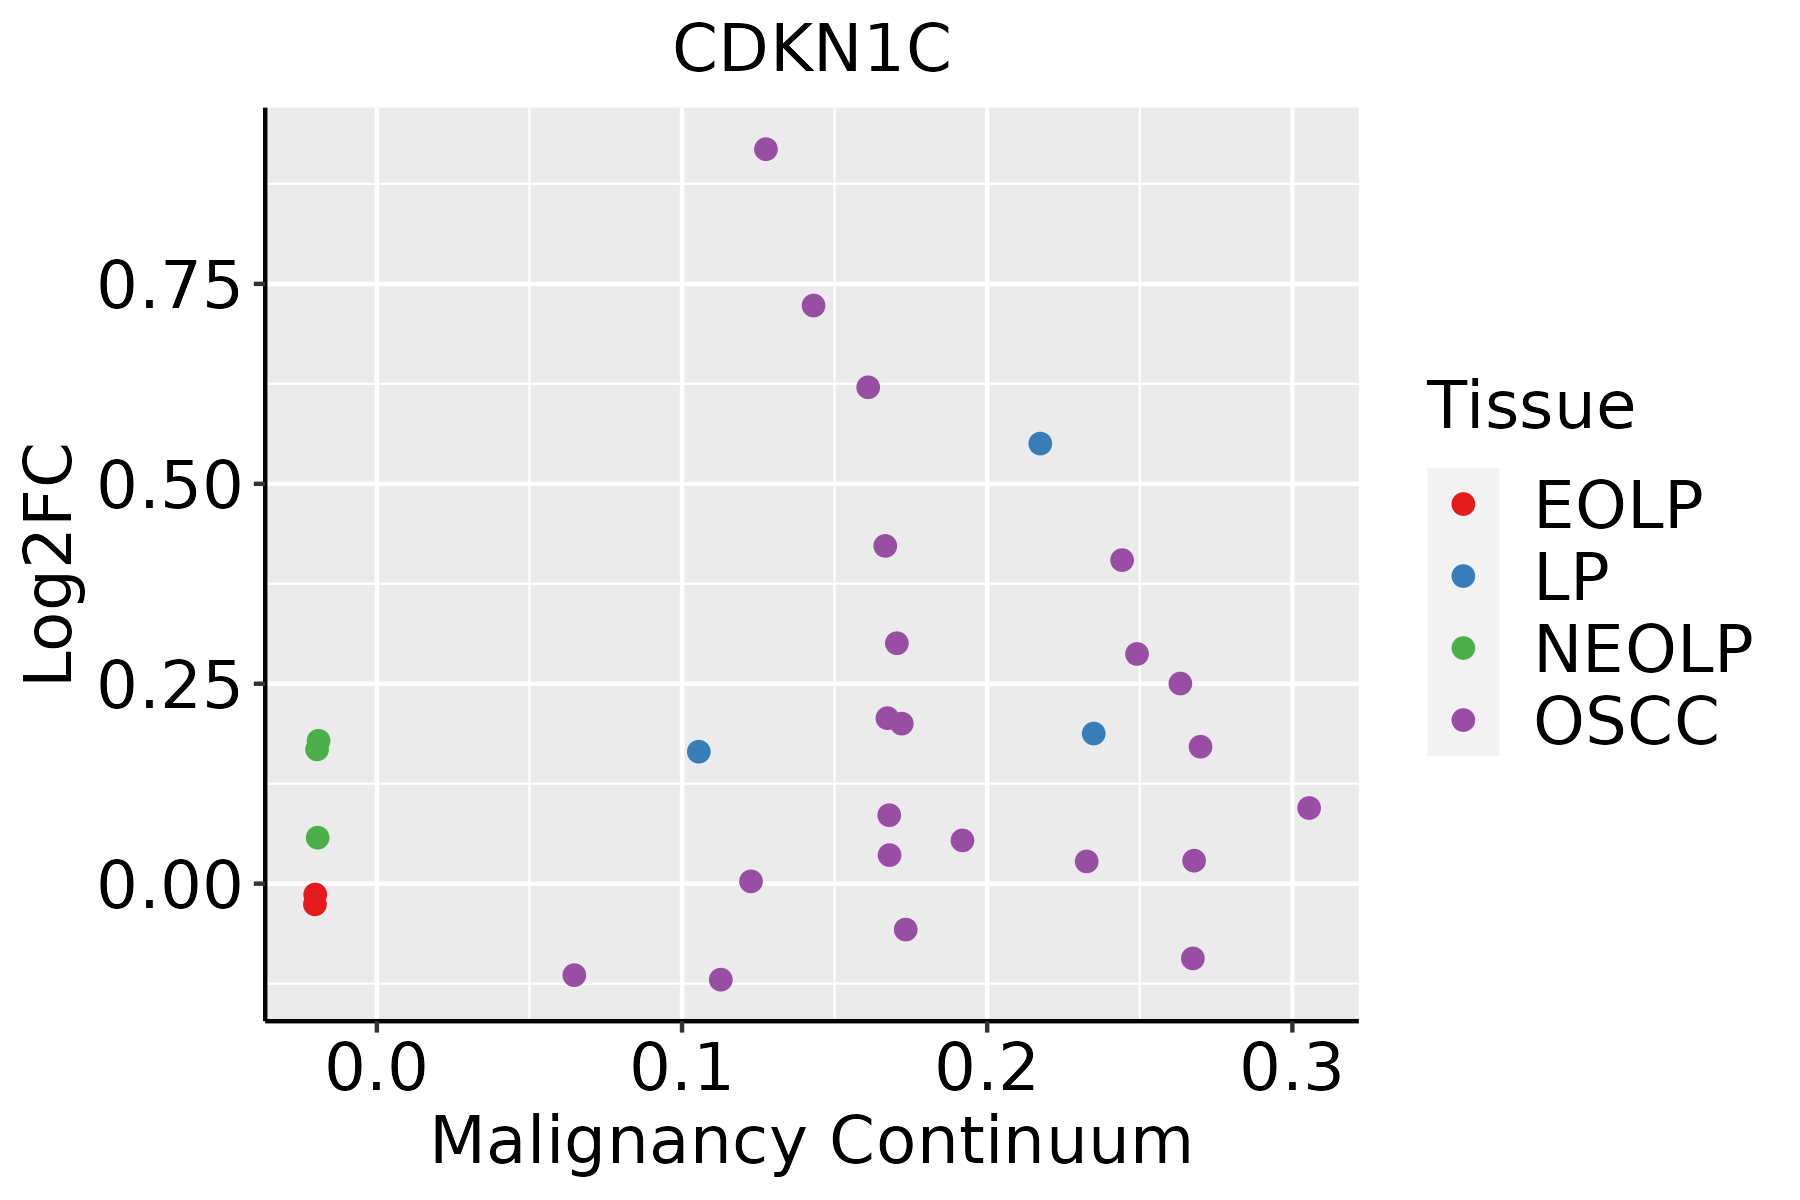 | EOLP: Erosive Oral lichen planus |
| LP: leukoplakia | ||
| NEOLP: Non-erosive oral lichen planus | ||
| OSCC: Oral squamous cell carcinoma | ||
| Prostate | 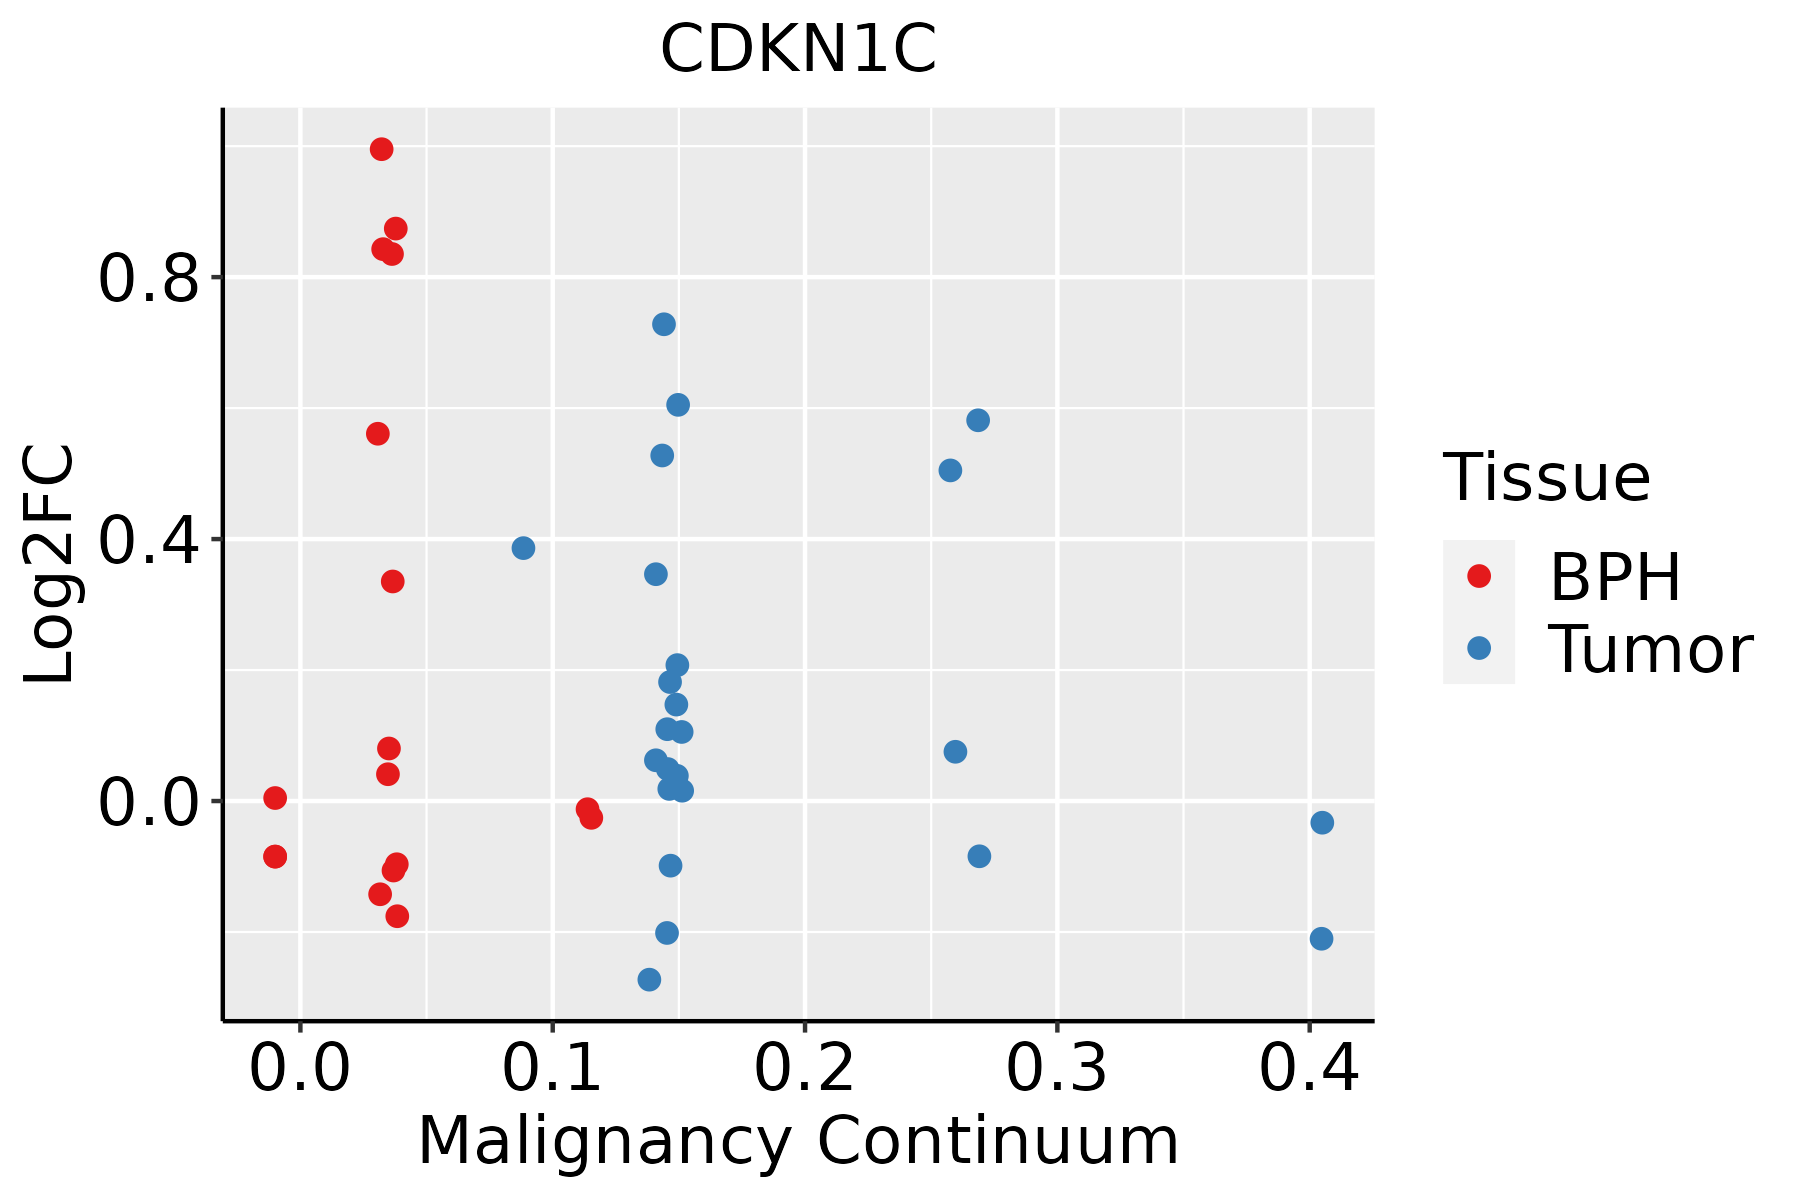 | BPH: Benign Prostatic Hyperplasia |
| ∗log2FC in expression of this searched gene in stem-like cells from each diseased tissue sample relative to stem-like cells in normal samples in each tissue plotted against the malignancy continuum. Samples are colored based on if they are from different disease stage. |
Top |
Malignant transformation related pathway analysis |
| Find out the enriched GO biological processes and KEGG pathways involved in transition from healthy to precancer to cancer |
| Tissue | Disease Stage | Enriched GO biological Processes |
| Colorectum | AD |  |
| Colorectum | SER |  |
| Colorectum | MSS |  |
| Colorectum | MSI-H |  |
| Colorectum | FAP |  |
| ∗Top 15 enriched GO BP terms are showed in the bar plot of each disease state in each tissue. Each row represents a significant GO biological process which is colored according to the -log10(p.adjust). |
| Page: 1 2 3 4 5 6 7 8 9 |
| GO ID | Tissue | Disease Stage | Description | Gene Ratio | Bg Ratio | pvalue | p.adjust | Count |
| GO:00305115 | Esophagus | ESCC | positive regulation of transforming growth factor beta receptor signaling pathway | 24/8552 | 32/18723 | 7.22e-04 | 3.77e-03 | 24 |
| GO:19038465 | Esophagus | ESCC | positive regulation of cellular response to transforming growth factor beta stimulus | 24/8552 | 32/18723 | 7.22e-04 | 3.77e-03 | 24 |
| GO:00170156 | Esophagus | ESCC | regulation of transforming growth factor beta receptor signaling pathway | 75/8552 | 128/18723 | 2.19e-03 | 9.71e-03 | 75 |
| GO:19038447 | Esophagus | ESCC | regulation of cellular response to transforming growth factor beta stimulus | 76/8552 | 131/18723 | 2.96e-03 | 1.24e-02 | 76 |
| GO:19040303 | Esophagus | ESCC | negative regulation of cyclin-dependent protein kinase activity | 23/8552 | 33/18723 | 4.57e-03 | 1.78e-02 | 23 |
| GO:00457363 | Esophagus | ESCC | negative regulation of cyclin-dependent protein serine/threonine kinase activity | 22/8552 | 32/18723 | 7.12e-03 | 2.58e-02 | 22 |
| GO:004593612 | Liver | Cirrhotic | negative regulation of phosphate metabolic process | 154/4634 | 441/18723 | 8.78e-07 | 1.83e-05 | 154 |
| GO:001056312 | Liver | Cirrhotic | negative regulation of phosphorus metabolic process | 154/4634 | 442/18723 | 1.02e-06 | 2.11e-05 | 154 |
| GO:004232612 | Liver | Cirrhotic | negative regulation of phosphorylation | 135/4634 | 385/18723 | 3.17e-06 | 5.58e-05 | 135 |
| GO:007155911 | Liver | Cirrhotic | response to transforming growth factor beta | 96/4634 | 256/18723 | 3.55e-06 | 6.09e-05 | 96 |
| GO:007156011 | Liver | Cirrhotic | cellular response to transforming growth factor beta stimulus | 93/4634 | 250/18723 | 7.34e-06 | 1.13e-04 | 93 |
| GO:00073463 | Liver | Cirrhotic | regulation of mitotic cell cycle | 154/4634 | 457/18723 | 8.73e-06 | 1.29e-04 | 154 |
| GO:000193312 | Liver | Cirrhotic | negative regulation of protein phosphorylation | 117/4634 | 342/18723 | 4.84e-05 | 5.59e-04 | 117 |
| GO:005134812 | Liver | Cirrhotic | negative regulation of transferase activity | 93/4634 | 268/18723 | 1.55e-04 | 1.47e-03 | 93 |
| GO:000717911 | Liver | Cirrhotic | transforming growth factor beta receptor signaling pathway | 71/4634 | 198/18723 | 3.02e-04 | 2.65e-03 | 71 |
| GO:003367312 | Liver | Cirrhotic | negative regulation of kinase activity | 78/4634 | 237/18723 | 2.73e-03 | 1.59e-02 | 78 |
| GO:190384411 | Liver | Cirrhotic | regulation of cellular response to transforming growth factor beta stimulus | 47/4634 | 131/18723 | 2.87e-03 | 1.65e-02 | 47 |
| GO:000717811 | Liver | Cirrhotic | transmembrane receptor protein serine/threonine kinase signaling pathway | 111/4634 | 355/18723 | 2.98e-03 | 1.70e-02 | 111 |
| GO:00170152 | Liver | Cirrhotic | regulation of transforming growth factor beta receptor signaling pathway | 46/4634 | 128/18723 | 3.04e-03 | 1.72e-02 | 46 |
| GO:00305112 | Liver | Cirrhotic | positive regulation of transforming growth factor beta receptor signaling pathway | 15/4634 | 32/18723 | 5.36e-03 | 2.73e-02 | 15 |
| Page: 1 2 3 4 5 6 7 8 |
| Pathway ID | Tissue | Disease Stage | Description | Gene Ratio | Bg Ratio | pvalue | p.adjust | qvalue | Count |
| hsa0411023 | Esophagus | ESCC | Cell cycle | 126/4205 | 157/8465 | 1.34e-15 | 5.60e-14 | 2.87e-14 | 126 |
| hsa0411033 | Esophagus | ESCC | Cell cycle | 126/4205 | 157/8465 | 1.34e-15 | 5.60e-14 | 2.87e-14 | 126 |
| hsa041104 | Liver | Cirrhotic | Cell cycle | 61/2530 | 157/8465 | 9.53e-03 | 3.21e-02 | 1.98e-02 | 61 |
| hsa0411011 | Liver | Cirrhotic | Cell cycle | 61/2530 | 157/8465 | 9.53e-03 | 3.21e-02 | 1.98e-02 | 61 |
| hsa041102 | Liver | HCC | Cell cycle | 106/4020 | 157/8465 | 2.54e-07 | 3.04e-06 | 1.69e-06 | 106 |
| hsa041103 | Liver | HCC | Cell cycle | 106/4020 | 157/8465 | 2.54e-07 | 3.04e-06 | 1.69e-06 | 106 |
| hsa041108 | Oral cavity | OSCC | Cell cycle | 118/3704 | 157/8465 | 7.15e-16 | 2.66e-14 | 1.35e-14 | 118 |
| hsa0411015 | Oral cavity | OSCC | Cell cycle | 118/3704 | 157/8465 | 7.15e-16 | 2.66e-14 | 1.35e-14 | 118 |
| hsa041107 | Prostate | BPH | Cell cycle | 49/1718 | 157/8465 | 7.39e-04 | 3.59e-03 | 2.22e-03 | 49 |
| hsa0411014 | Prostate | BPH | Cell cycle | 49/1718 | 157/8465 | 7.39e-04 | 3.59e-03 | 2.22e-03 | 49 |
| hsa0411021 | Prostate | Tumor | Cell cycle | 51/1791 | 157/8465 | 5.67e-04 | 2.89e-03 | 1.79e-03 | 51 |
| hsa0411031 | Prostate | Tumor | Cell cycle | 51/1791 | 157/8465 | 5.67e-04 | 2.89e-03 | 1.79e-03 | 51 |
| Page: 1 |
Top |
Cell-cell communication analysis |
| Identification of potential cell-cell interactions between two cell types and their ligand-receptor pairs for different disease states |
| Ligand | Receptor | LRpair | Pathway | Tissue | Disease Stage |
| Page: 1 |
Top |
Single-cell gene regulatory network inference analysis |
| Find out the significant the regulons (TFs) and the target genes of each regulon across cell types for different disease states |
| TF | Cell Type | Tissue | Disease Stage | Target Gene | RSS | Regulon Activity |
| ∗The dot plots of a searched regulon are shown for all cell subpopulations in each disease state of each tissue based on the regulon specific score inferred using pySCENIC and by calculating the average expression. |
| Page: 1 |
Top |
Somatic mutation of malignant transformation related genes |
| Annotation of somatic variants for genes involved in malignant transformation |
| Hugo Symbol | Variant Class | Variant Classification | dbSNP RS | HGVSc | HGVSp | HGVSp Short | SWISSPROT | BIOTYPE | SIFT | PolyPhen | Tumor Sample Barcode | Tissue | Histology | Sex | Age | Stage | Therapy Types | Drugs | Outcome |
| CDKN1C | SNV | Missense_Mutation | novel | c.377T>C | p.Leu126Pro | p.L126P | P49918 | protein_coding | tolerated_low_confidence(0.14) | benign(0) | TCGA-VS-A94Z-01 | Cervix | cervical & endocervical cancer | Female | <65 | I/II | Chemotherapy | cisplatin | CR |
| CDKN1C | SNV | Missense_Mutation | c.946N>T | p.Arg316Trp | p.R316W | P49918 | protein_coding | deleterious_low_confidence(0) | probably_damaging(0.996) | TCGA-EO-A22R-01 | Endometrium | uterine corpus endometrioid carcinoma | Female | <65 | I/II | Unknown | Unknown | SD | |
| CDKN1C | SNV | Missense_Mutation | rs762106424 | c.283N>A | p.Val95Met | p.V95M | P49918 | protein_coding | deleterious(0) | probably_damaging(0.965) | TCGA-LG-A6GG-01 | Liver | liver hepatocellular carcinoma | Female | >=65 | I/II | Unknown | Unknown | SD |
| CDKN1C | deletion | Frame_Shift_Del | novel | c.21_37delCAGCACATCCACGATGG | p.Ser8AlafsTer111 | p.S8Afs*111 | P49918 | protein_coding | TCGA-CD-8526-01 | Stomach | stomach adenocarcinoma | Female | >=65 | III/IV | Chemotherapy | epirubicin | CR |
| Page: 1 |
Top |
Related drugs of malignant transformation related genes |
| Identification of chemicals and drugs interact with genes involved in malignant transfromation |
| (DGIdb 4.0) |
| Entrez ID | Symbol | Category | Interaction Types | Drug Claim Name | Drug Name | PMIDs |
| 1028 | CDKN1C | CLINICALLY ACTIONABLE, KINASE | HISTONE DEACETYLASE INHIBITOR | 10667572 |
| Page: 1 |

Copyright 2023-Present -The University of Texas Health Science Center at Houston |