
|
|||||
|
 | |
| |
| |
| |
| |
| |
|
Gene: CDC20 |
Gene summary for CDC20 |
| Gene information | Species | Human | Gene symbol | CDC20 | Gene ID | 991 |
| Gene name | cell division cycle 20 | |
| Gene Alias | CDC20A | |
| Cytomap | 1p34.2 | |
| Gene Type | protein-coding | GO ID | GO:0000003 | UniProtAcc | Q12834 |
Top |
Malignant transformation analysis |
| Identification of the aberrant gene expression in precancerous and cancerous lesions by comparing the gene expression of stem-like cells in diseased tissues with normal stem cells |
| Entrez ID | Symbol | Replicates | Species | Organ | Tissue | Adj P-value | Log2FC | Malignancy |
| 991 | CDC20 | LZE2T | Human | Esophagus | ESCC | 6.57e-06 | 1.54e+00 | 0.082 |
| 991 | CDC20 | LZE7T | Human | Esophagus | ESCC | 1.26e-02 | 3.13e-01 | 0.0667 |
| 991 | CDC20 | LZE22T | Human | Esophagus | ESCC | 7.84e-03 | 9.44e-01 | 0.068 |
| 991 | CDC20 | LZE6T | Human | Esophagus | ESCC | 5.83e-09 | 7.41e-01 | 0.0845 |
| 991 | CDC20 | P2T-E | Human | Esophagus | ESCC | 6.19e-12 | 8.47e-01 | 0.1177 |
| 991 | CDC20 | P4T-E | Human | Esophagus | ESCC | 1.32e-14 | 1.14e+00 | 0.1323 |
| 991 | CDC20 | P5T-E | Human | Esophagus | ESCC | 3.48e-25 | 1.31e+00 | 0.1327 |
| 991 | CDC20 | P9T-E | Human | Esophagus | ESCC | 1.13e-11 | 7.04e-01 | 0.1131 |
| 991 | CDC20 | P10T-E | Human | Esophagus | ESCC | 6.95e-10 | 8.74e-01 | 0.116 |
| 991 | CDC20 | P15T-E | Human | Esophagus | ESCC | 4.66e-11 | 8.41e-01 | 0.1149 |
| 991 | CDC20 | P17T-E | Human | Esophagus | ESCC | 1.92e-15 | 1.74e+00 | 0.1278 |
| 991 | CDC20 | P19T-E | Human | Esophagus | ESCC | 1.31e-05 | 2.14e+00 | 0.1662 |
| 991 | CDC20 | P20T-E | Human | Esophagus | ESCC | 3.57e-07 | 9.22e-01 | 0.1124 |
| 991 | CDC20 | P21T-E | Human | Esophagus | ESCC | 1.08e-19 | 1.98e+00 | 0.1617 |
| 991 | CDC20 | P23T-E | Human | Esophagus | ESCC | 1.77e-06 | 1.09e+00 | 0.108 |
| 991 | CDC20 | P24T-E | Human | Esophagus | ESCC | 1.62e-32 | 1.78e+00 | 0.1287 |
| 991 | CDC20 | P26T-E | Human | Esophagus | ESCC | 6.93e-06 | 7.24e-01 | 0.1276 |
| 991 | CDC20 | P27T-E | Human | Esophagus | ESCC | 4.10e-02 | 6.72e-01 | 0.1055 |
| 991 | CDC20 | P28T-E | Human | Esophagus | ESCC | 8.95e-31 | 1.07e+00 | 0.1149 |
| 991 | CDC20 | P30T-E | Human | Esophagus | ESCC | 9.16e-04 | 5.89e-01 | 0.137 |
| Page: 1 2 3 4 |
| Tissue | Expression Dynamics | Abbreviation |
| Esophagus |  | ESCC: Esophageal squamous cell carcinoma |
| HGIN: High-grade intraepithelial neoplasias | ||
| LGIN: Low-grade intraepithelial neoplasias | ||
| Liver | 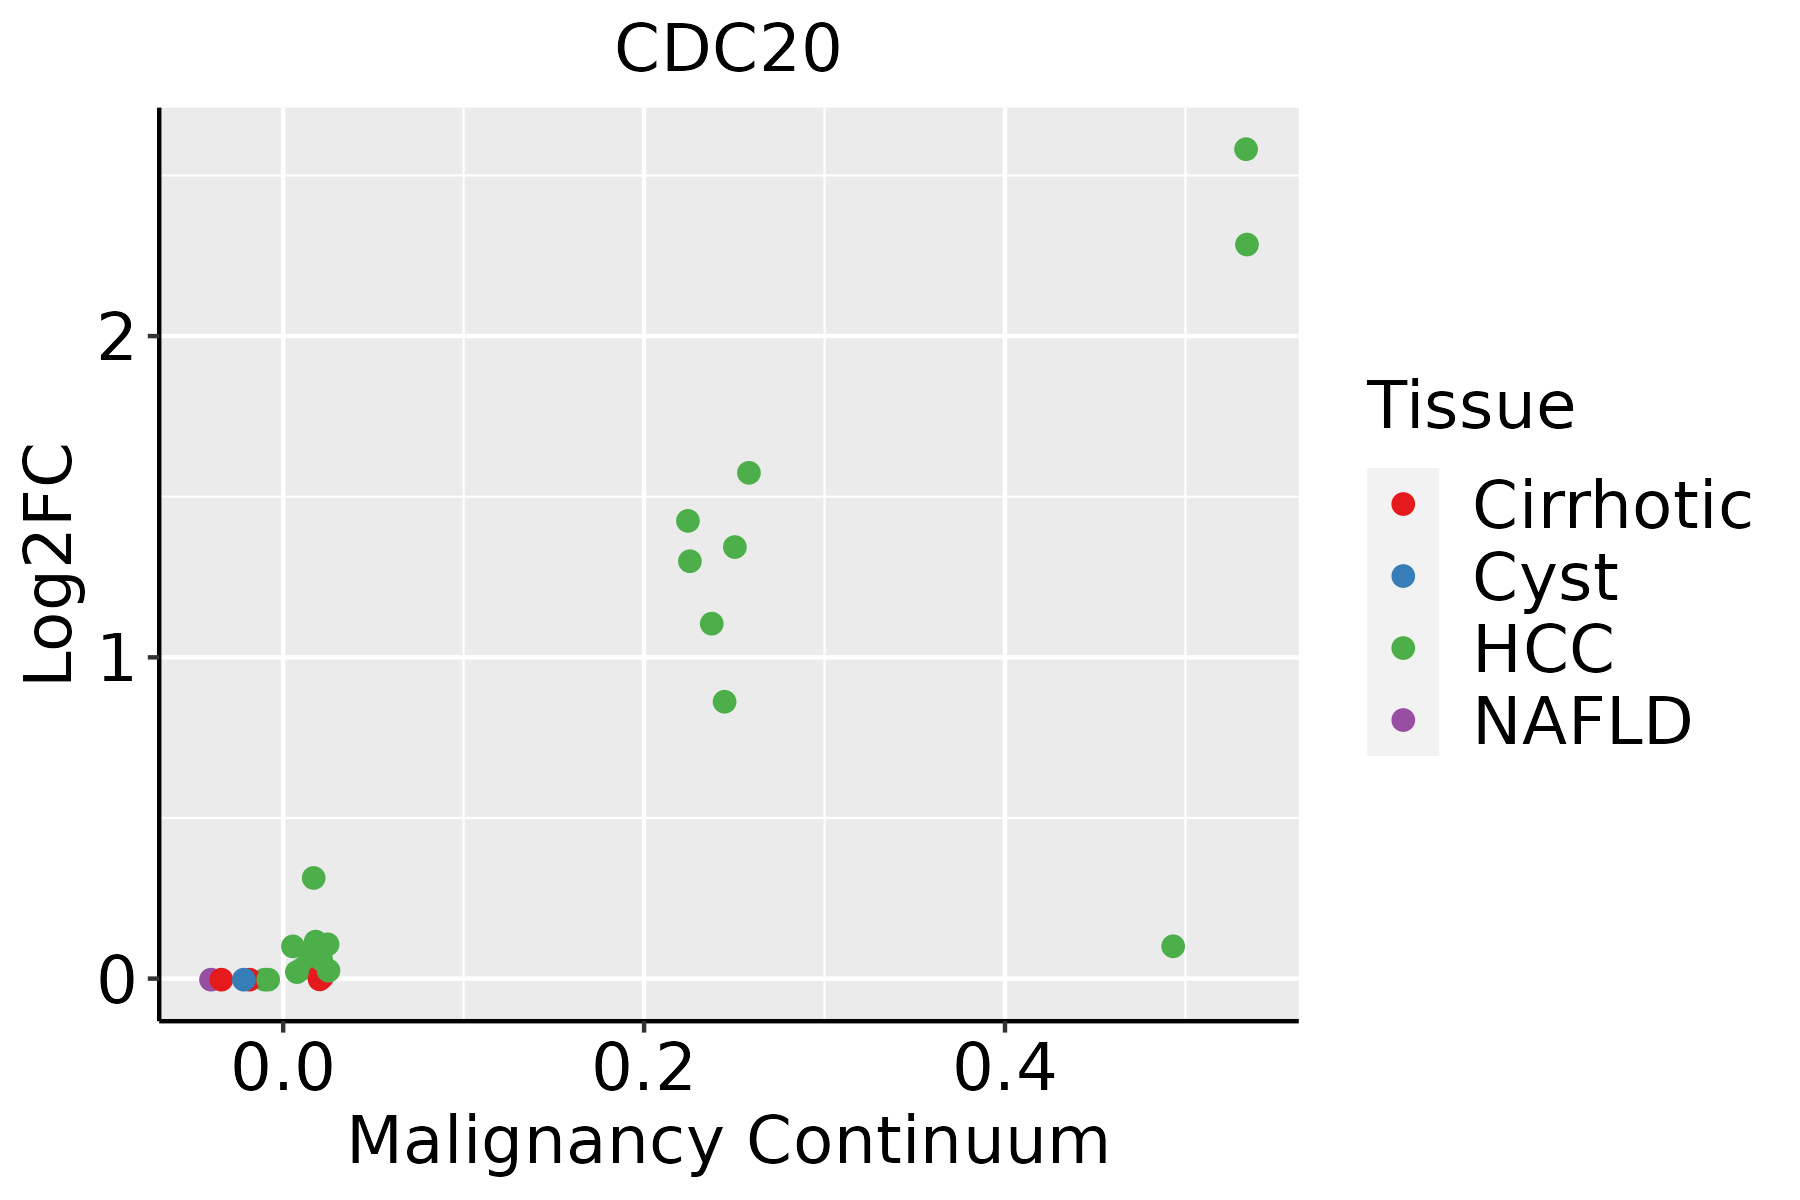 | HCC: Hepatocellular carcinoma |
| NAFLD: Non-alcoholic fatty liver disease | ||
| Oral Cavity |  | EOLP: Erosive Oral lichen planus |
| LP: leukoplakia | ||
| NEOLP: Non-erosive oral lichen planus | ||
| OSCC: Oral squamous cell carcinoma | ||
| Skin |  | AK: Actinic keratosis |
| cSCC: Cutaneous squamous cell carcinoma | ||
| SCCIS:squamous cell carcinoma in situ | ||
| Thyroid | 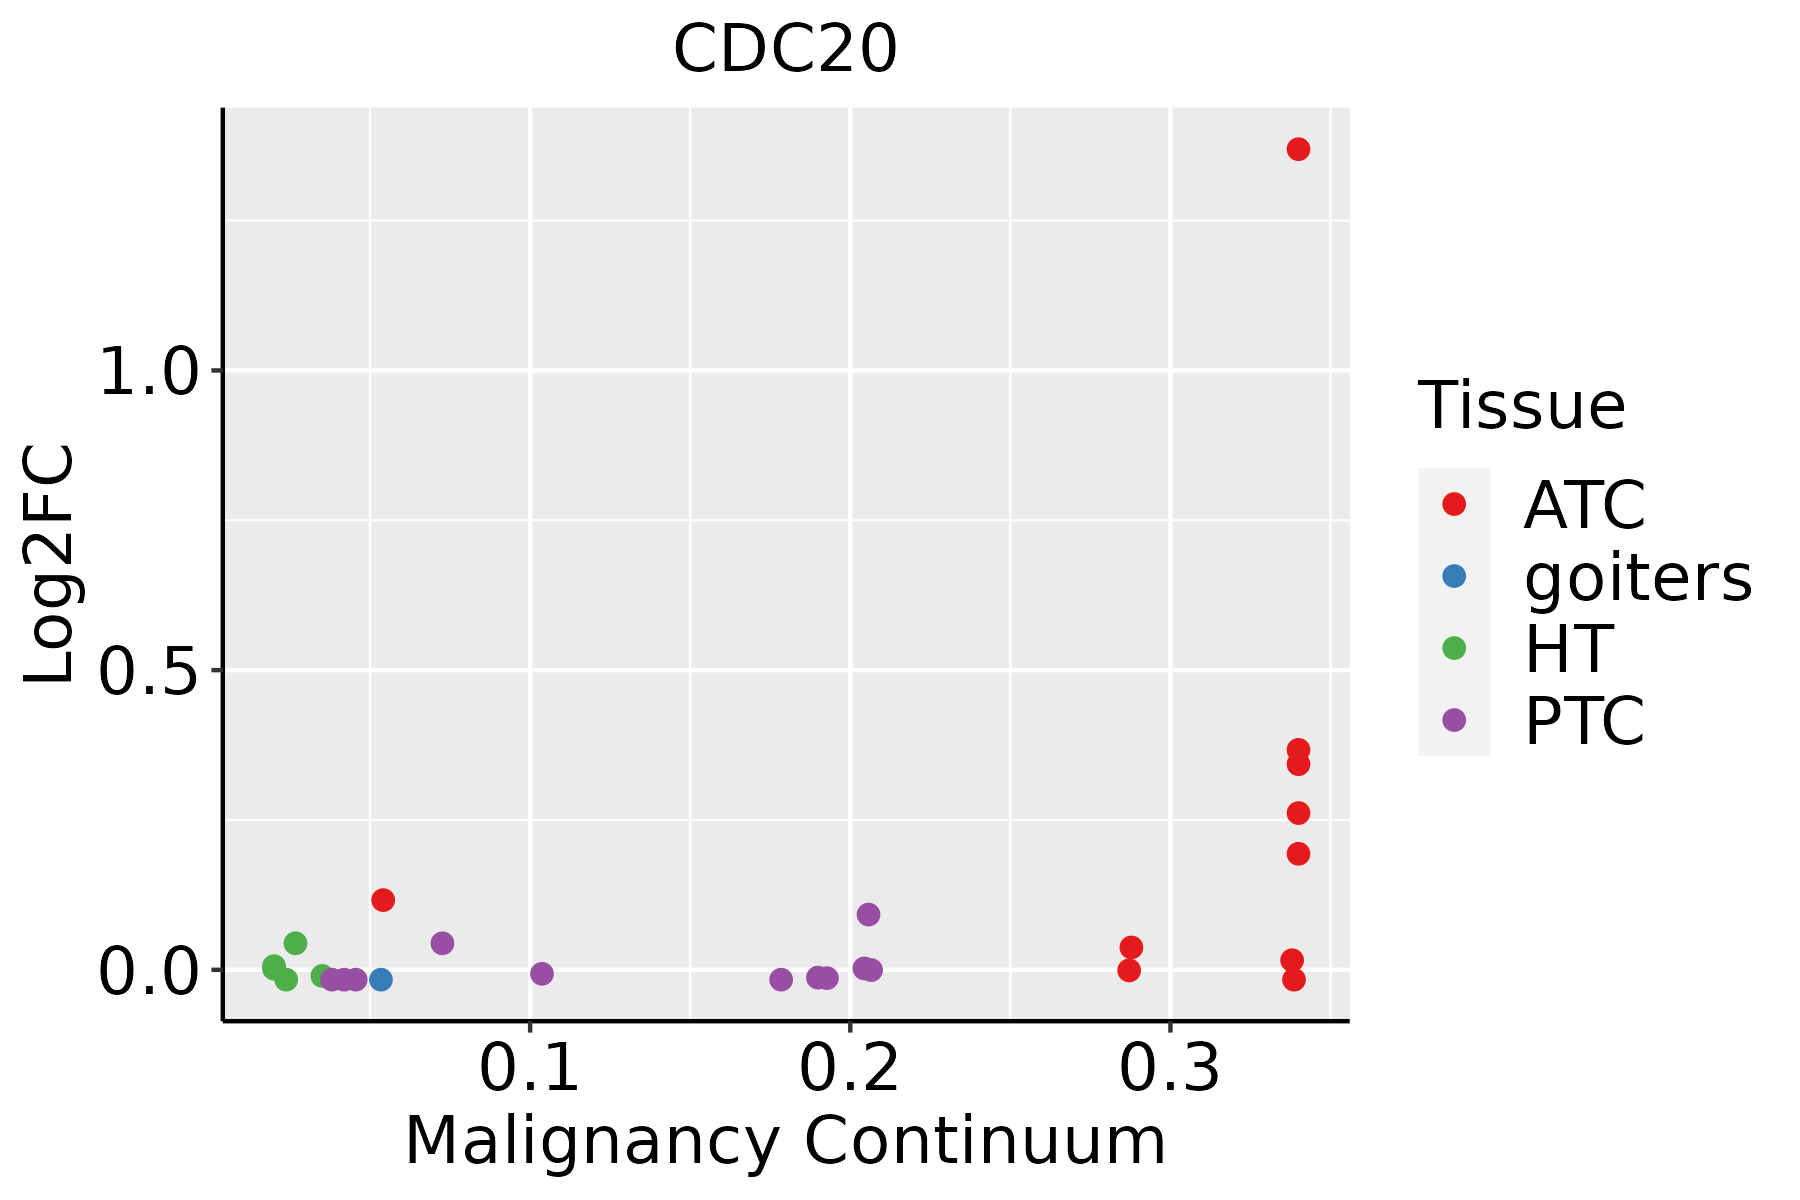 | ATC: Anaplastic thyroid cancer |
| HT: Hashimoto's thyroiditis | ||
| PTC: Papillary thyroid cancer |
| ∗log2FC in expression of this searched gene in stem-like cells from each diseased tissue sample relative to stem-like cells in normal samples in each tissue plotted against the malignancy continuum. Samples are colored based on if they are from different disease stage. |
Top |
Malignant transformation related pathway analysis |
| Find out the enriched GO biological processes and KEGG pathways involved in transition from healthy to precancer to cancer |
| Tissue | Disease Stage | Enriched GO biological Processes |
| Colorectum | AD |  |
| Colorectum | SER |  |
| Colorectum | MSS |  |
| Colorectum | MSI-H |  |
| Colorectum | FAP |  |
| ∗Top 15 enriched GO BP terms are showed in the bar plot of each disease state in each tissue. Each row represents a significant GO biological process which is colored according to the -log10(p.adjust). |
| Page: 1 2 3 4 5 6 7 8 9 |
| GO ID | Tissue | Disease Stage | Description | Gene Ratio | Bg Ratio | pvalue | p.adjust | Count |
| GO:1903364111 | Esophagus | ESCC | positive regulation of cellular protein catabolic process | 117/8552 | 155/18723 | 3.25e-14 | 1.66e-12 | 117 |
| GO:000705114 | Esophagus | ESCC | spindle organization | 134/8552 | 184/18723 | 5.70e-14 | 2.87e-12 | 134 |
| GO:1901800110 | Esophagus | ESCC | positive regulation of proteasomal protein catabolic process | 91/8552 | 114/18723 | 6.74e-14 | 3.34e-12 | 91 |
| GO:00482853 | Esophagus | ESCC | organelle fission | 301/8552 | 488/18723 | 4.64e-13 | 2.12e-11 | 301 |
| GO:1903052110 | Esophagus | ESCC | positive regulation of proteolysis involved in cellular protein catabolic process | 101/8552 | 133/18723 | 9.58e-13 | 4.19e-11 | 101 |
| GO:00988133 | Esophagus | ESCC | nuclear chromosome segregation | 187/8552 | 281/18723 | 1.00e-12 | 4.36e-11 | 187 |
| GO:00002802 | Esophagus | ESCC | nuclear division | 270/8552 | 439/18723 | 1.17e-11 | 4.24e-10 | 270 |
| GO:0032436111 | Esophagus | ESCC | positive regulation of proteasomal ubiquitin-dependent protein catabolic process | 72/8552 | 90/18723 | 2.30e-11 | 7.87e-10 | 72 |
| GO:2000060111 | Esophagus | ESCC | positive regulation of ubiquitin-dependent protein catabolic process | 81/8552 | 107/18723 | 2.23e-10 | 6.34e-09 | 81 |
| GO:190332216 | Esophagus | ESCC | positive regulation of protein modification by small protein conjugation or removal | 99/8552 | 138/18723 | 4.39e-10 | 1.16e-08 | 99 |
| GO:00512256 | Esophagus | ESCC | spindle assembly | 85/8552 | 117/18723 | 2.72e-09 | 5.98e-08 | 85 |
| GO:009030715 | Esophagus | ESCC | mitotic spindle assembly | 52/8552 | 65/18723 | 1.41e-08 | 2.77e-07 | 52 |
| GO:003139816 | Esophagus | ESCC | positive regulation of protein ubiquitination | 82/8552 | 119/18723 | 2.41e-07 | 3.64e-06 | 82 |
| GO:00517831 | Esophagus | ESCC | regulation of nuclear division | 90/8552 | 139/18723 | 4.30e-06 | 4.60e-05 | 90 |
| GO:00070648 | Esophagus | ESCC | mitotic sister chromatid cohesion | 23/8552 | 28/18723 | 8.23e-05 | 6.01e-04 | 23 |
| GO:005143819 | Esophagus | ESCC | regulation of ubiquitin-protein transferase activity | 38/8552 | 53/18723 | 1.10e-04 | 7.69e-04 | 38 |
| GO:00311451 | Esophagus | ESCC | anaphase-promoting complex-dependent catabolic process | 18/8552 | 21/18723 | 1.81e-04 | 1.16e-03 | 18 |
| GO:001097516 | Esophagus | ESCC | regulation of neuron projection development | 240/8552 | 445/18723 | 2.48e-04 | 1.53e-03 | 240 |
| GO:1904666111 | Esophagus | ESCC | regulation of ubiquitin protein ligase activity | 18/8552 | 23/18723 | 1.50e-03 | 7.06e-03 | 18 |
| GO:00070627 | Esophagus | ESCC | sister chromatid cohesion | 40/8552 | 62/18723 | 2.14e-03 | 9.54e-03 | 40 |
| Page: 1 2 3 4 5 6 7 8 9 10 11 12 13 |
| Pathway ID | Tissue | Disease Stage | Description | Gene Ratio | Bg Ratio | pvalue | p.adjust | qvalue | Count |
| hsa0412027 | Esophagus | ESCC | Ubiquitin mediated proteolysis | 122/4205 | 142/8465 | 6.53e-20 | 7.29e-18 | 3.74e-18 | 122 |
| hsa0411023 | Esophagus | ESCC | Cell cycle | 126/4205 | 157/8465 | 1.34e-15 | 5.60e-14 | 2.87e-14 | 126 |
| hsa05166211 | Esophagus | ESCC | Human T-cell leukemia virus 1 infection | 164/4205 | 222/8465 | 8.13e-14 | 2.09e-12 | 1.07e-12 | 164 |
| hsa0520325 | Esophagus | ESCC | Viral carcinogenesis | 137/4205 | 204/8465 | 2.47e-07 | 1.88e-06 | 9.62e-07 | 137 |
| hsa041146 | Esophagus | ESCC | Oocyte meiosis | 77/4205 | 131/8465 | 2.19e-02 | 4.80e-02 | 2.46e-02 | 77 |
| hsa0412036 | Esophagus | ESCC | Ubiquitin mediated proteolysis | 122/4205 | 142/8465 | 6.53e-20 | 7.29e-18 | 3.74e-18 | 122 |
| hsa0411033 | Esophagus | ESCC | Cell cycle | 126/4205 | 157/8465 | 1.34e-15 | 5.60e-14 | 2.87e-14 | 126 |
| hsa05166310 | Esophagus | ESCC | Human T-cell leukemia virus 1 infection | 164/4205 | 222/8465 | 8.13e-14 | 2.09e-12 | 1.07e-12 | 164 |
| hsa0520335 | Esophagus | ESCC | Viral carcinogenesis | 137/4205 | 204/8465 | 2.47e-07 | 1.88e-06 | 9.62e-07 | 137 |
| hsa0411411 | Esophagus | ESCC | Oocyte meiosis | 77/4205 | 131/8465 | 2.19e-02 | 4.80e-02 | 2.46e-02 | 77 |
| hsa0412041 | Liver | HCC | Ubiquitin mediated proteolysis | 110/4020 | 142/8465 | 1.67e-13 | 3.74e-12 | 2.08e-12 | 110 |
| hsa041102 | Liver | HCC | Cell cycle | 106/4020 | 157/8465 | 2.54e-07 | 3.04e-06 | 1.69e-06 | 106 |
| hsa0516622 | Liver | HCC | Human T-cell leukemia virus 1 infection | 139/4020 | 222/8465 | 3.17e-06 | 2.79e-05 | 1.55e-05 | 139 |
| hsa052032 | Liver | HCC | Viral carcinogenesis | 117/4020 | 204/8465 | 2.68e-03 | 8.98e-03 | 5.00e-03 | 117 |
| hsa0412051 | Liver | HCC | Ubiquitin mediated proteolysis | 110/4020 | 142/8465 | 1.67e-13 | 3.74e-12 | 2.08e-12 | 110 |
| hsa041103 | Liver | HCC | Cell cycle | 106/4020 | 157/8465 | 2.54e-07 | 3.04e-06 | 1.69e-06 | 106 |
| hsa0516632 | Liver | HCC | Human T-cell leukemia virus 1 infection | 139/4020 | 222/8465 | 3.17e-06 | 2.79e-05 | 1.55e-05 | 139 |
| hsa052033 | Liver | HCC | Viral carcinogenesis | 117/4020 | 204/8465 | 2.68e-03 | 8.98e-03 | 5.00e-03 | 117 |
| hsa041108 | Oral cavity | OSCC | Cell cycle | 118/3704 | 157/8465 | 7.15e-16 | 2.66e-14 | 1.35e-14 | 118 |
| hsa0412020 | Oral cavity | OSCC | Ubiquitin mediated proteolysis | 105/3704 | 142/8465 | 1.83e-13 | 4.37e-12 | 2.23e-12 | 105 |
| Page: 1 2 |
Top |
Cell-cell communication analysis |
| Identification of potential cell-cell interactions between two cell types and their ligand-receptor pairs for different disease states |
| Ligand | Receptor | LRpair | Pathway | Tissue | Disease Stage |
| Page: 1 |
Top |
Single-cell gene regulatory network inference analysis |
| Find out the significant the regulons (TFs) and the target genes of each regulon across cell types for different disease states |
| TF | Cell Type | Tissue | Disease Stage | Target Gene | RSS | Regulon Activity |
| ∗The dot plots of a searched regulon are shown for all cell subpopulations in each disease state of each tissue based on the regulon specific score inferred using pySCENIC and by calculating the average expression. |
| Page: 1 |
Top |
Somatic mutation of malignant transformation related genes |
| Annotation of somatic variants for genes involved in malignant transformation |
| Hugo Symbol | Variant Class | Variant Classification | dbSNP RS | HGVSc | HGVSp | HGVSp Short | SWISSPROT | BIOTYPE | SIFT | PolyPhen | Tumor Sample Barcode | Tissue | Histology | Sex | Age | Stage | Therapy Types | Drugs | Outcome |
| CDC20 | SNV | Missense_Mutation | novel | c.1228N>T | p.His410Tyr | p.H410Y | Q12834 | protein_coding | deleterious(0.03) | benign(0.232) | TCGA-3C-AAAU-01 | Breast | breast invasive carcinoma | Female | <65 | I/II | Chemotherapy | zoladex | SD |
| CDC20 | SNV | Missense_Mutation | c.1429N>G | p.Pro477Ala | p.P477A | Q12834 | protein_coding | deleterious(0.04) | probably_damaging(1) | TCGA-D8-A1JL-01 | Breast | breast invasive carcinoma | Female | >=65 | I/II | Unknown | Unknown | SD | |
| CDC20 | SNV | Missense_Mutation | c.56N>T | p.Pro19Leu | p.P19L | Q12834 | protein_coding | deleterious(0) | benign(0.282) | TCGA-E2-A14R-01 | Breast | breast invasive carcinoma | Female | <65 | I/II | Chemotherapy | doxorubicin | PD | |
| CDC20 | SNV | Missense_Mutation | novel | c.1312G>A | p.Glu438Lys | p.E438K | Q12834 | protein_coding | deleterious(0) | possibly_damaging(0.745) | TCGA-PL-A8LV-01 | Breast | breast invasive carcinoma | Female | <65 | III/IV | Unknown | Unknown | SD |
| CDC20 | SNV | Missense_Mutation | c.166C>T | p.Pro56Ser | p.P56S | Q12834 | protein_coding | tolerated(0.11) | possibly_damaging(0.685) | TCGA-MU-A51Y-01 | Cervix | cervical & endocervical cancer | Female | <65 | I/II | Unknown | Unknown | SD | |
| CDC20 | SNV | Missense_Mutation | novel | c.959N>T | p.Asp320Val | p.D320V | Q12834 | protein_coding | deleterious(0) | probably_damaging(0.998) | TCGA-AA-3845-01 | Colorectum | colon adenocarcinoma | Female | >=65 | I/II | Unknown | Unknown | PD |
| CDC20 | SNV | Missense_Mutation | novel | c.1235A>G | p.Lys412Arg | p.K412R | Q12834 | protein_coding | tolerated(0.1) | benign(0.261) | TCGA-EI-6511-01 | Colorectum | rectum adenocarcinoma | Male | <65 | III/IV | Chemotherapy | oxaliplatinum+5-fu | SD |
| CDC20 | SNV | Missense_Mutation | rs190674570 | c.836N>G | p.Tyr279Cys | p.Y279C | Q12834 | protein_coding | deleterious(0) | possibly_damaging(0.827) | TCGA-A5-A0G2-01 | Endometrium | uterine corpus endometrioid carcinoma | Female | <65 | III/IV | Unknown | Unknown | SD |
| CDC20 | SNV | Missense_Mutation | c.1276N>T | p.Val426Phe | p.V426F | Q12834 | protein_coding | deleterious(0.02) | possibly_damaging(0.605) | TCGA-AP-A059-01 | Endometrium | uterine corpus endometrioid carcinoma | Female | >=65 | I/II | Unknown | Unknown | SD | |
| CDC20 | SNV | Missense_Mutation | novel | c.785N>A | p.Arg262Gln | p.R262Q | Q12834 | protein_coding | deleterious(0) | probably_damaging(0.996) | TCGA-AP-A0LM-01 | Endometrium | uterine corpus endometrioid carcinoma | Female | <65 | III/IV | Chemotherapy | cisplatin | SD |
| Page: 1 2 3 4 |
Top |
Related drugs of malignant transformation related genes |
| Identification of chemicals and drugs interact with genes involved in malignant transfromation |
| (DGIdb 4.0) |
| Entrez ID | Symbol | Category | Interaction Types | Drug Claim Name | Drug Name | PMIDs |
| Page: 1 |

Copyright 2023-Present -The University of Texas Health Science Center at Houston |