
|
|||||
|
 | |
| |
| |
| |
| |
| |
|
Gene: CD3E |
Gene summary for CD3E |
| Gene information | Species | Human | Gene symbol | CD3E | Gene ID | 916 |
| Gene name | CD3e molecule | |
| Gene Alias | IMD18 | |
| Cytomap | 11q23.3 | |
| Gene Type | protein-coding | GO ID | GO:0001775 | UniProtAcc | P07766 |
Top |
Malignant transformation analysis |
| Identification of the aberrant gene expression in precancerous and cancerous lesions by comparing the gene expression of stem-like cells in diseased tissues with normal stem cells |
| Entrez ID | Symbol | Replicates | Species | Organ | Tissue | Adj P-value | Log2FC | Malignancy |
| 916 | CD3E | LZE4T | Human | Esophagus | ESCC | 5.69e-16 | 9.88e-01 | 0.0811 |
| 916 | CD3E | LZE7T | Human | Esophagus | ESCC | 1.72e-16 | 1.34e+00 | 0.0667 |
| 916 | CD3E | LZE8T | Human | Esophagus | ESCC | 2.59e-04 | 7.69e-01 | 0.067 |
| 916 | CD3E | LZE22D1 | Human | Esophagus | HGIN | 1.84e-03 | 6.00e-01 | 0.0595 |
| 916 | CD3E | LZE24T | Human | Esophagus | ESCC | 5.34e-04 | 3.97e-01 | 0.0596 |
| 916 | CD3E | LZE6T | Human | Esophagus | ESCC | 6.13e-28 | 1.82e+00 | 0.0845 |
| 916 | CD3E | P31T-E | Human | Esophagus | ESCC | 3.98e-14 | 2.95e-01 | 0.1251 |
| 916 | CD3E | P39T-E | Human | Esophagus | ESCC | 3.92e-03 | 1.08e-01 | 0.0894 |
| 916 | CD3E | P42T-E | Human | Esophagus | ESCC | 1.66e-08 | 2.84e-01 | 0.1175 |
| 916 | CD3E | P47T-E | Human | Esophagus | ESCC | 3.45e-04 | 1.14e-01 | 0.1067 |
| 916 | CD3E | P54T-E | Human | Esophagus | ESCC | 5.27e-14 | 3.59e-01 | 0.0975 |
| 916 | CD3E | P130T-E | Human | Esophagus | ESCC | 7.99e-43 | 8.46e-01 | 0.1676 |
| 916 | CD3E | C21 | Human | Oral cavity | OSCC | 2.70e-20 | 6.21e-01 | 0.2678 |
| 916 | CD3E | C30 | Human | Oral cavity | OSCC | 2.40e-04 | 2.28e-01 | 0.3055 |
| 916 | CD3E | C38 | Human | Oral cavity | OSCC | 1.40e-09 | 1.11e+00 | 0.172 |
| 916 | CD3E | C46 | Human | Oral cavity | OSCC | 1.84e-05 | 2.08e-01 | 0.1673 |
| 916 | CD3E | C51 | Human | Oral cavity | OSCC | 1.08e-02 | 1.94e-01 | 0.2674 |
| 916 | CD3E | C57 | Human | Oral cavity | OSCC | 6.40e-05 | 3.06e-01 | 0.1679 |
| 916 | CD3E | C08 | Human | Oral cavity | OSCC | 4.44e-04 | 6.61e-02 | 0.1919 |
| 916 | CD3E | LN46 | Human | Oral cavity | OSCC | 1.64e-06 | 2.37e-01 | 0.1666 |
| Page: 1 |
| Tissue | Expression Dynamics | Abbreviation |
| Esophagus | 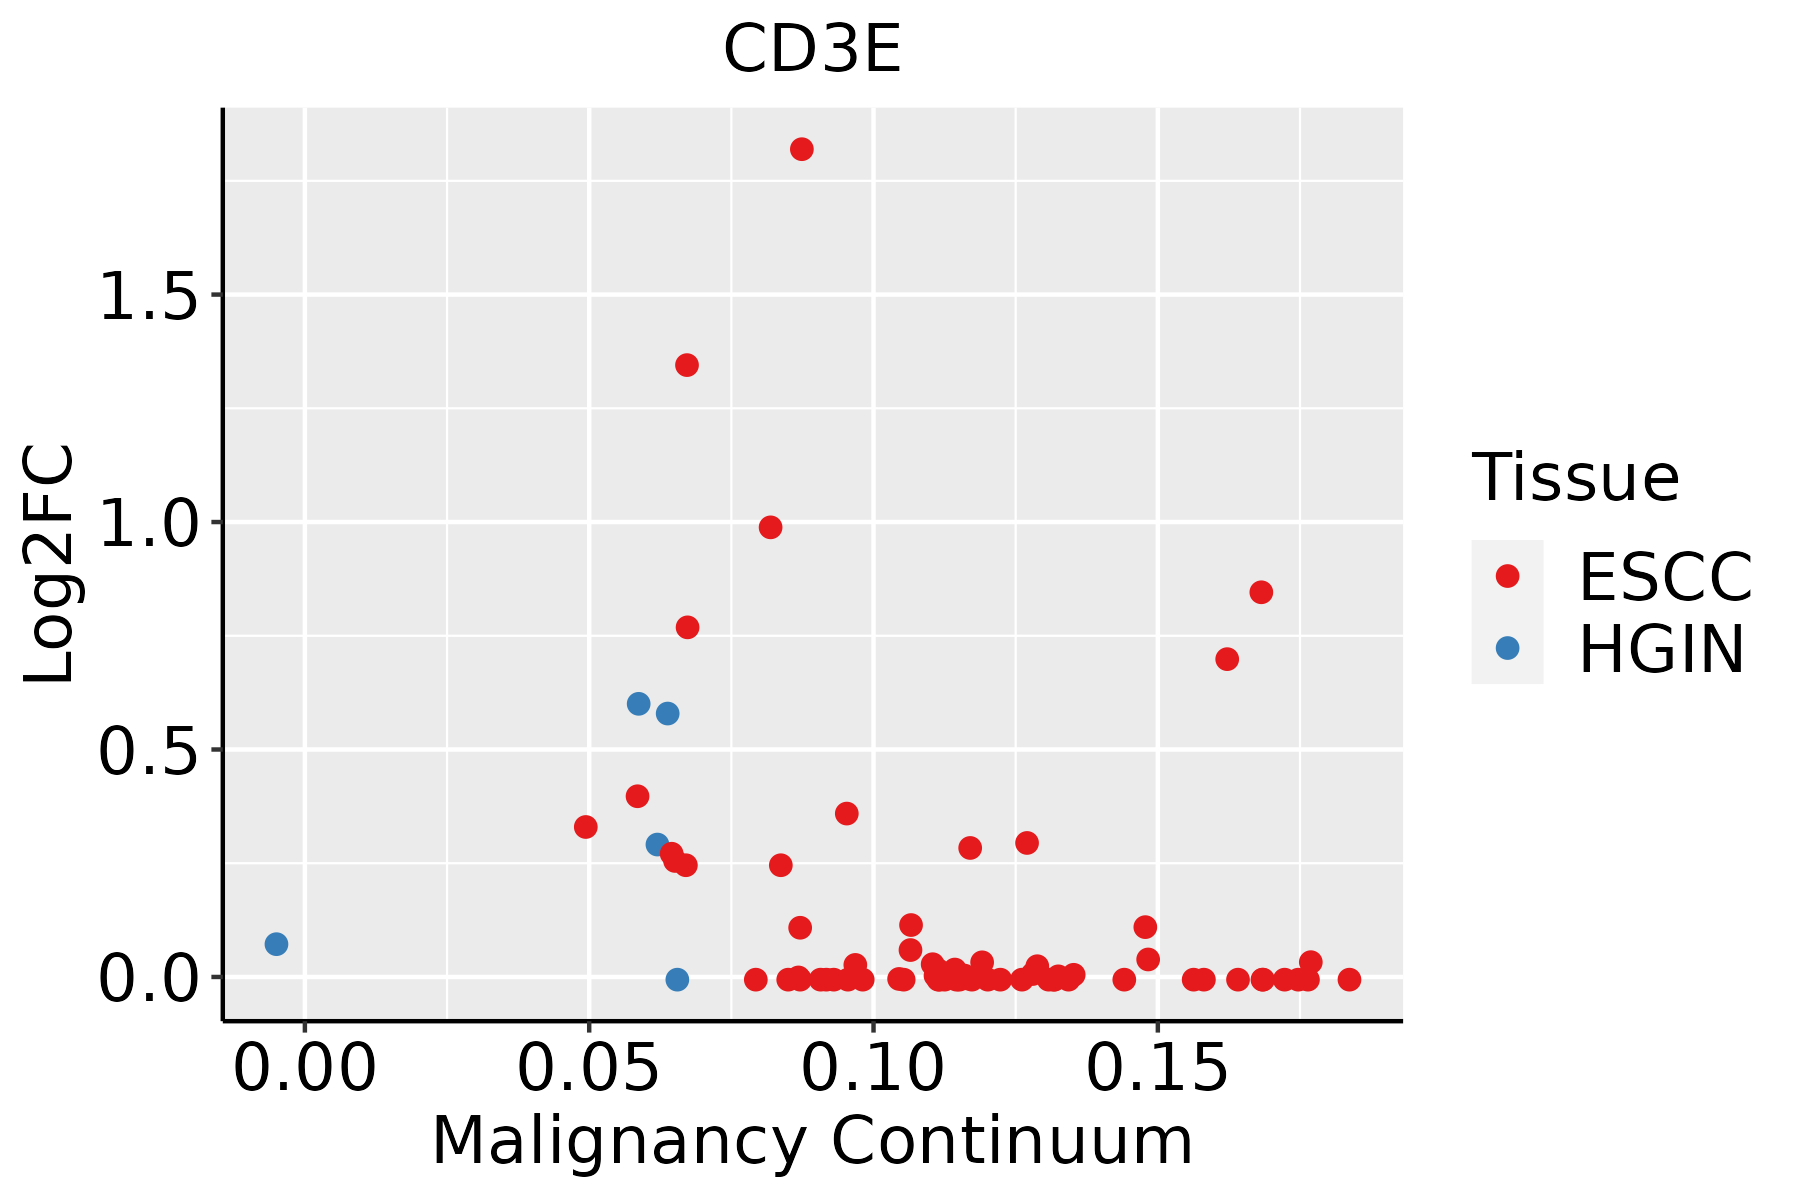 | ESCC: Esophageal squamous cell carcinoma |
| HGIN: High-grade intraepithelial neoplasias | ||
| LGIN: Low-grade intraepithelial neoplasias | ||
| Oral Cavity | 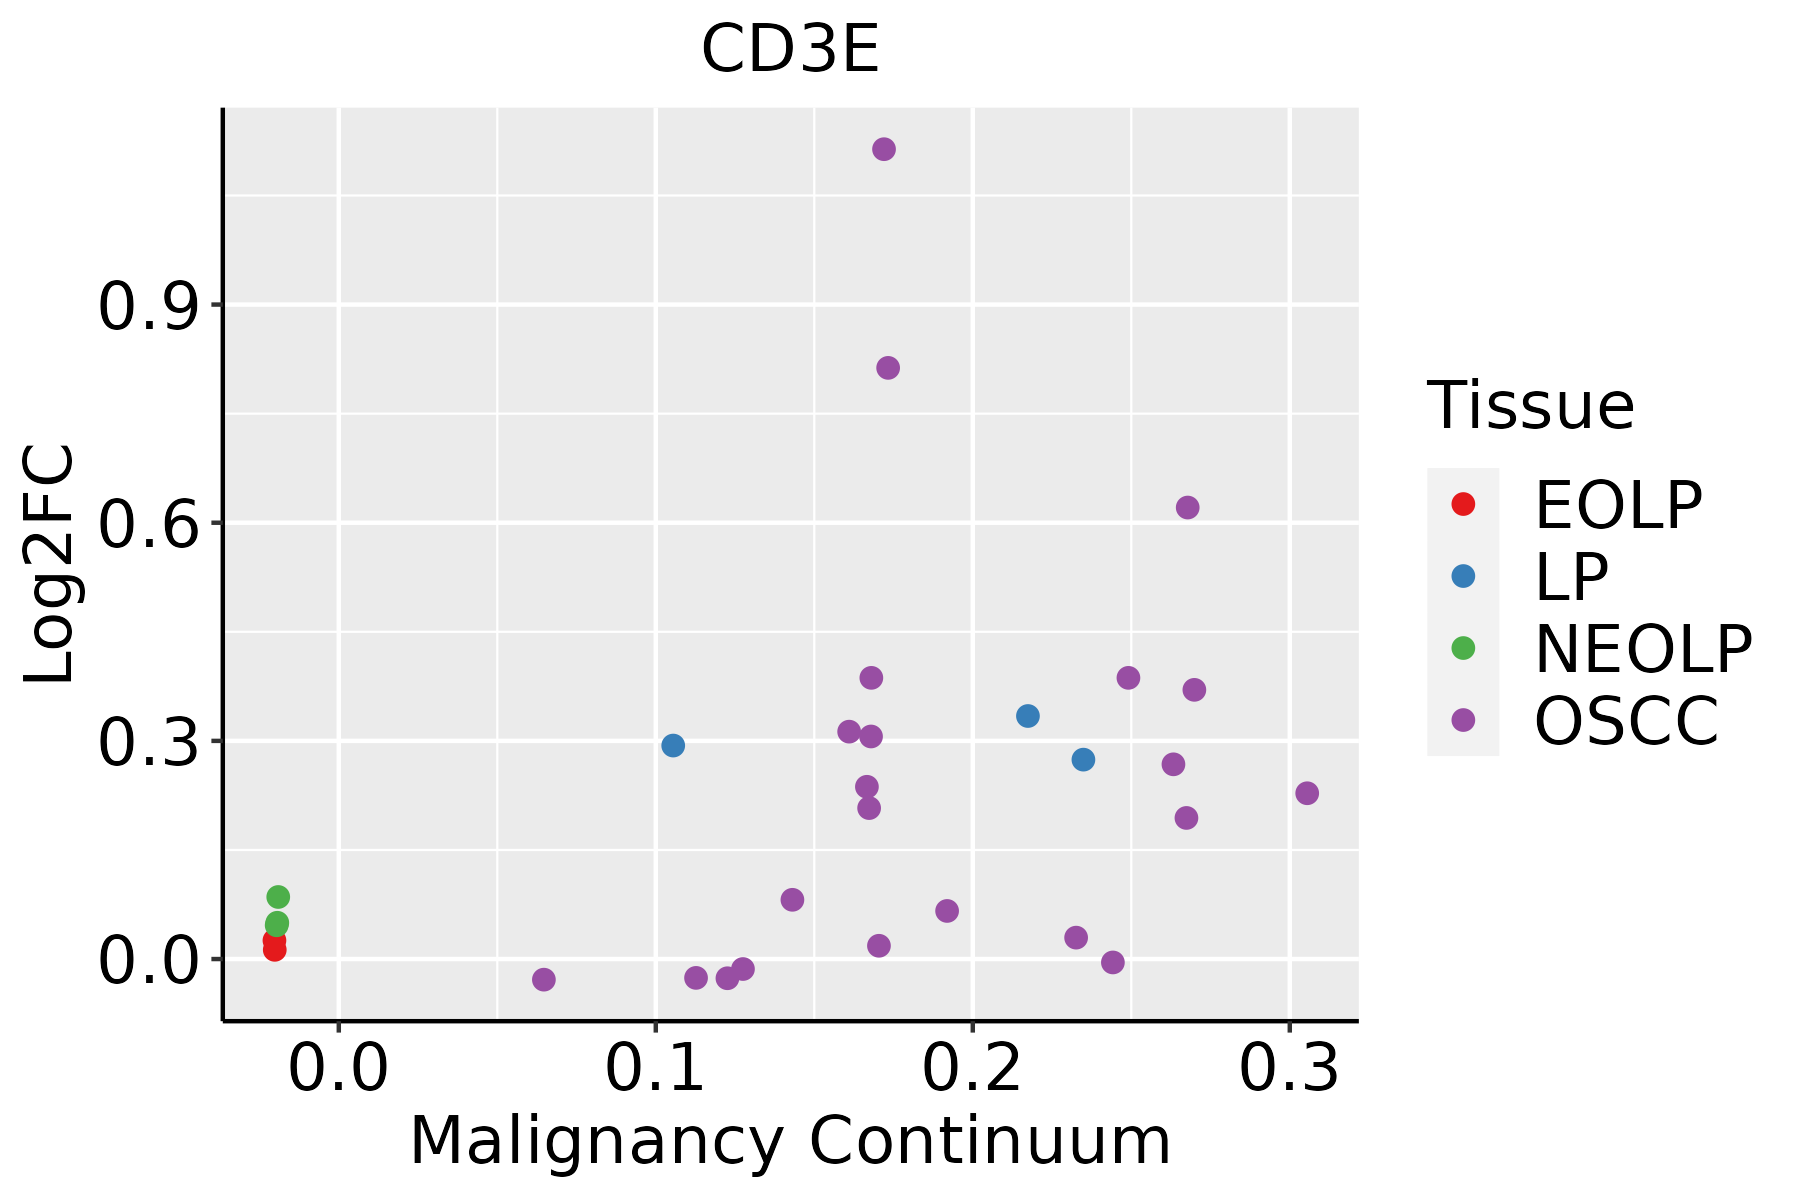 | EOLP: Erosive Oral lichen planus |
| LP: leukoplakia | ||
| NEOLP: Non-erosive oral lichen planus | ||
| OSCC: Oral squamous cell carcinoma |
| ∗log2FC in expression of this searched gene in stem-like cells from each diseased tissue sample relative to stem-like cells in normal samples in each tissue plotted against the malignancy continuum. Samples are colored based on if they are from different disease stage. |
Top |
Malignant transformation related pathway analysis |
| Find out the enriched GO biological processes and KEGG pathways involved in transition from healthy to precancer to cancer |
| Tissue | Disease Stage | Enriched GO biological Processes |
| Colorectum | AD |  |
| Colorectum | SER |  |
| Colorectum | MSS |  |
| Colorectum | MSI-H |  |
| Colorectum | FAP |  |
| ∗Top 15 enriched GO BP terms are showed in the bar plot of each disease state in each tissue. Each row represents a significant GO biological process which is colored according to the -log10(p.adjust). |
| Page: 1 2 3 4 5 6 7 8 9 |
| GO ID | Tissue | Disease Stage | Description | Gene Ratio | Bg Ratio | pvalue | p.adjust | Count |
| GO:00336281 | Esophagus | ESCC | regulation of cell adhesion mediated by integrin | 31/8552 | 48/18723 | 6.41e-03 | 2.35e-02 | 31 |
| GO:005087015 | Esophagus | ESCC | positive regulation of T cell activation | 117/8552 | 216/18723 | 7.23e-03 | 2.62e-02 | 117 |
| GO:00302176 | Esophagus | ESCC | T cell differentiation | 137/8552 | 257/18723 | 8.09e-03 | 2.87e-02 | 137 |
| GO:001635816 | Esophagus | ESCC | dendrite development | 130/8552 | 243/18723 | 8.33e-03 | 2.95e-02 | 130 |
| GO:190303916 | Esophagus | ESCC | positive regulation of leukocyte cell-cell adhesion | 128/8552 | 239/18723 | 8.40e-03 | 2.96e-02 | 128 |
| GO:000715918 | Esophagus | ESCC | leukocyte cell-cell adhesion | 192/8552 | 371/18723 | 1.03e-02 | 3.51e-02 | 192 |
| GO:190303717 | Esophagus | ESCC | regulation of leukocyte cell-cell adhesion | 174/8552 | 336/18723 | 1.36e-02 | 4.43e-02 | 174 |
| GO:00300984 | Esophagus | ESCC | lymphocyte differentiation | 192/8552 | 374/18723 | 1.52e-02 | 4.93e-02 | 192 |
| GO:003166720 | Oral cavity | OSCC | response to nutrient levels | 245/7305 | 474/18723 | 1.02e-08 | 2.10e-07 | 245 |
| GO:003158917 | Oral cavity | OSCC | cell-substrate adhesion | 193/7305 | 363/18723 | 2.48e-08 | 4.82e-07 | 193 |
| GO:001081019 | Oral cavity | OSCC | regulation of cell-substrate adhesion | 126/7305 | 221/18723 | 4.02e-08 | 7.55e-07 | 126 |
| GO:004578520 | Oral cavity | OSCC | positive regulation of cell adhesion | 225/7305 | 437/18723 | 6.06e-08 | 1.09e-06 | 225 |
| GO:004211016 | Oral cavity | OSCC | T cell activation | 245/7305 | 487/18723 | 2.00e-07 | 3.22e-06 | 245 |
| GO:000195215 | Oral cavity | OSCC | regulation of cell-matrix adhesion | 78/7305 | 128/18723 | 4.05e-07 | 6.02e-06 | 78 |
| GO:000716016 | Oral cavity | OSCC | cell-matrix adhesion | 125/7305 | 233/18723 | 3.76e-06 | 4.45e-05 | 125 |
| GO:19031316 | Oral cavity | OSCC | mononuclear cell differentiation | 210/7305 | 426/18723 | 8.44e-06 | 9.02e-05 | 210 |
| GO:00336274 | Oral cavity | OSCC | cell adhesion mediated by integrin | 46/7305 | 72/18723 | 1.66e-05 | 1.64e-04 | 46 |
| GO:002240718 | Oral cavity | OSCC | regulation of cell-cell adhesion | 218/7305 | 448/18723 | 1.71e-05 | 1.68e-04 | 218 |
| GO:001081120 | Oral cavity | OSCC | positive regulation of cell-substrate adhesion | 71/7305 | 123/18723 | 1.96e-05 | 1.87e-04 | 71 |
| GO:00075849 | Oral cavity | OSCC | response to nutrient | 95/7305 | 174/18723 | 2.09e-05 | 1.99e-04 | 95 |
| Page: 1 2 3 4 |
| Pathway ID | Tissue | Disease Stage | Description | Gene Ratio | Bg Ratio | pvalue | p.adjust | qvalue | Count |
| hsa0516930 | Esophagus | HGIN | Epstein-Barr virus infection | 55/1383 | 202/8465 | 5.13e-05 | 6.19e-04 | 4.92e-04 | 55 |
| hsa0517029 | Esophagus | HGIN | Human immunodeficiency virus 1 infection | 51/1383 | 212/8465 | 2.16e-03 | 1.90e-02 | 1.51e-02 | 51 |
| hsa0516639 | Esophagus | HGIN | Human T-cell leukemia virus 1 infection | 51/1383 | 222/8465 | 5.84e-03 | 4.05e-02 | 3.22e-02 | 51 |
| hsa05169114 | Esophagus | HGIN | Epstein-Barr virus infection | 55/1383 | 202/8465 | 5.13e-05 | 6.19e-04 | 4.92e-04 | 55 |
| hsa05170112 | Esophagus | HGIN | Human immunodeficiency virus 1 infection | 51/1383 | 212/8465 | 2.16e-03 | 1.90e-02 | 1.51e-02 | 51 |
| hsa05166114 | Esophagus | HGIN | Human T-cell leukemia virus 1 infection | 51/1383 | 222/8465 | 5.84e-03 | 4.05e-02 | 3.22e-02 | 51 |
| hsa05166211 | Esophagus | ESCC | Human T-cell leukemia virus 1 infection | 164/4205 | 222/8465 | 8.13e-14 | 2.09e-12 | 1.07e-12 | 164 |
| hsa05169210 | Esophagus | ESCC | Epstein-Barr virus infection | 151/4205 | 202/8465 | 1.55e-13 | 3.45e-12 | 1.77e-12 | 151 |
| hsa05170210 | Esophagus | ESCC | Human immunodeficiency virus 1 infection | 147/4205 | 212/8465 | 3.37e-09 | 3.53e-08 | 1.81e-08 | 147 |
| hsa051629 | Esophagus | ESCC | Measles | 90/4205 | 139/8465 | 2.16e-04 | 7.87e-04 | 4.03e-04 | 90 |
| hsa052356 | Esophagus | ESCC | PD-L1 expression and PD-1 checkpoint pathway in cancer | 58/4205 | 89/8465 | 2.19e-03 | 6.16e-03 | 3.16e-03 | 58 |
| hsa051425 | Esophagus | ESCC | Chagas disease | 65/4205 | 102/8465 | 2.81e-03 | 7.59e-03 | 3.89e-03 | 65 |
| hsa046599 | Esophagus | ESCC | Th17 cell differentiation | 68/4205 | 108/8465 | 3.53e-03 | 9.30e-03 | 4.76e-03 | 68 |
| hsa046585 | Esophagus | ESCC | Th1 and Th2 cell differentiation | 58/4205 | 92/8465 | 6.49e-03 | 1.60e-02 | 8.19e-03 | 58 |
| hsa046607 | Esophagus | ESCC | T cell receptor signaling pathway | 63/4205 | 104/8465 | 1.60e-02 | 3.60e-02 | 1.84e-02 | 63 |
| hsa05166310 | Esophagus | ESCC | Human T-cell leukemia virus 1 infection | 164/4205 | 222/8465 | 8.13e-14 | 2.09e-12 | 1.07e-12 | 164 |
| hsa0516937 | Esophagus | ESCC | Epstein-Barr virus infection | 151/4205 | 202/8465 | 1.55e-13 | 3.45e-12 | 1.77e-12 | 151 |
| hsa0517038 | Esophagus | ESCC | Human immunodeficiency virus 1 infection | 147/4205 | 212/8465 | 3.37e-09 | 3.53e-08 | 1.81e-08 | 147 |
| hsa0516213 | Esophagus | ESCC | Measles | 90/4205 | 139/8465 | 2.16e-04 | 7.87e-04 | 4.03e-04 | 90 |
| hsa0523511 | Esophagus | ESCC | PD-L1 expression and PD-1 checkpoint pathway in cancer | 58/4205 | 89/8465 | 2.19e-03 | 6.16e-03 | 3.16e-03 | 58 |
| Page: 1 2 3 |
Top |
Cell-cell communication analysis |
| Identification of potential cell-cell interactions between two cell types and their ligand-receptor pairs for different disease states |
| Ligand | Receptor | LRpair | Pathway | Tissue | Disease Stage |
| Page: 1 |
Top |
Single-cell gene regulatory network inference analysis |
| Find out the significant the regulons (TFs) and the target genes of each regulon across cell types for different disease states |
| TF | Cell Type | Tissue | Disease Stage | Target Gene | RSS | Regulon Activity |
| ∗The dot plots of a searched regulon are shown for all cell subpopulations in each disease state of each tissue based on the regulon specific score inferred using pySCENIC and by calculating the average expression. |
| Page: 1 |
Top |
Somatic mutation of malignant transformation related genes |
| Annotation of somatic variants for genes involved in malignant transformation |
| Hugo Symbol | Variant Class | Variant Classification | dbSNP RS | HGVSc | HGVSp | HGVSp Short | SWISSPROT | BIOTYPE | SIFT | PolyPhen | Tumor Sample Barcode | Tissue | Histology | Sex | Age | Stage | Therapy Types | Drugs | Outcome |
| CD3E | SNV | Missense_Mutation | novel | c.424N>T | p.Gly142Trp | p.G142W | P07766 | protein_coding | deleterious(0) | benign(0.283) | TCGA-A7-A0DB-01 | Breast | breast invasive carcinoma | Female | <65 | I/II | Hormone Therapy | arimidex | SD |
| CD3E | SNV | Missense_Mutation | c.560N>G | p.Asp187Gly | p.D187G | P07766 | protein_coding | deleterious(0) | probably_damaging(1) | TCGA-B6-A0RU-01 | Breast | breast invasive carcinoma | Female | <65 | I/II | Unknown | Unknown | PD | |
| CD3E | SNV | Missense_Mutation | c.79N>A | p.Glu27Lys | p.E27K | P07766 | protein_coding | tolerated(0.33) | benign(0.026) | TCGA-EW-A1J5-01 | Breast | breast invasive carcinoma | Female | <65 | I/II | Chemotherapy | adriamycin | SD | |
| CD3E | SNV | Missense_Mutation | rs144452564 | c.497C>T | p.Ala166Val | p.A166V | P07766 | protein_coding | tolerated(0.17) | benign(0.006) | TCGA-CA-6718-01 | Colorectum | colon adenocarcinoma | Male | <65 | I/II | Unknown | Unknown | PD |
| CD3E | SNV | Missense_Mutation | novel | c.67G>T | p.Asp23Tyr | p.D23Y | P07766 | protein_coding | deleterious(0) | possibly_damaging(0.862) | TCGA-F5-6814-01 | Colorectum | rectum adenocarcinoma | Male | <65 | I/II | Unknown | Unknown | SD |
| CD3E | SNV | Missense_Mutation | c.569N>T | p.Pro190Leu | p.P190L | P07766 | protein_coding | deleterious(0) | probably_damaging(0.992) | TCGA-A5-A0G2-01 | Endometrium | uterine corpus endometrioid carcinoma | Female | <65 | III/IV | Unknown | Unknown | SD | |
| CD3E | SNV | Missense_Mutation | c.459G>T | p.Lys153Asn | p.K153N | P07766 | protein_coding | deleterious(0) | probably_damaging(0.997) | TCGA-B5-A0JY-01 | Endometrium | uterine corpus endometrioid carcinoma | Female | <65 | III/IV | Chemotherapy | doxorubicin | SD | |
| CD3E | SNV | Missense_Mutation | novel | c.518N>T | p.Arg173Met | p.R173M | P07766 | protein_coding | deleterious(0) | probably_damaging(0.963) | TCGA-B5-A1MX-01 | Endometrium | uterine corpus endometrioid carcinoma | Female | <65 | I/II | Hormone Therapy | megace | SD |
| CD3E | SNV | Missense_Mutation | rs563868055 | c.386N>T | p.Ser129Leu | p.S129L | P07766 | protein_coding | deleterious(0.01) | benign(0.003) | TCGA-B5-A3FA-01 | Endometrium | uterine corpus endometrioid carcinoma | Female | >=65 | I/II | Unknown | Unknown | SD |
| CD3E | SNV | Missense_Mutation | rs563868055 | c.386N>T | p.Ser129Leu | p.S129L | P07766 | protein_coding | deleterious(0.01) | benign(0.003) | TCGA-BG-A0VW-01 | Endometrium | uterine corpus endometrioid carcinoma | Female | >=65 | I/II | Unknown | Unknown | SD |
| Page: 1 2 |
Top |
Related drugs of malignant transformation related genes |
| Identification of chemicals and drugs interact with genes involved in malignant transfromation |
| (DGIdb 4.0) |
| Entrez ID | Symbol | Category | Interaction Types | Drug Claim Name | Drug Name | PMIDs |
| 916 | CD3E | DRUGGABLE GENOME, EXTERNAL SIDE OF PLASMA MEMBRANE, KINASE | CHEMBL1742992 | BLINATUMOMAB | ||
| 916 | CD3E | DRUGGABLE GENOME, EXTERNAL SIDE OF PLASMA MEMBRANE, KINASE | antibody | 178103956 | BLINATUMOMAB | |
| 916 | CD3E | DRUGGABLE GENOME, EXTERNAL SIDE OF PLASMA MEMBRANE, KINASE | CHEMBL1743078 | TEPLIZUMAB | ||
| 916 | CD3E | DRUGGABLE GENOME, EXTERNAL SIDE OF PLASMA MEMBRANE, KINASE | MT-110 | |||
| 916 | CD3E | DRUGGABLE GENOME, EXTERNAL SIDE OF PLASMA MEMBRANE, KINASE | CHEMBL1743053 | OTELIXIZUMAB | ||
| 916 | CD3E | DRUGGABLE GENOME, EXTERNAL SIDE OF PLASMA MEMBRANE, KINASE | antibody | 178103957 | CATUMAXOMAB | |
| 916 | CD3E | DRUGGABLE GENOME, EXTERNAL SIDE OF PLASMA MEMBRANE, KINASE | CATUMAXOMAB | CATUMAXOMAB | ||
| 916 | CD3E | DRUGGABLE GENOME, EXTERNAL SIDE OF PLASMA MEMBRANE, KINASE | CHEMBL2108029 | ERTUMAXOMAB | ||
| 916 | CD3E | DRUGGABLE GENOME, EXTERNAL SIDE OF PLASMA MEMBRANE, KINASE | antibody | 252166668 | OTELIXIZUMAB | |
| 916 | CD3E | DRUGGABLE GENOME, EXTERNAL SIDE OF PLASMA MEMBRANE, KINASE | antibody | 384403634 |
| Page: 1 2 3 |

Copyright 2023-Present -The University of Texas Health Science Center at Houston |