
|
|||||
|
 | |
| |
| |
| |
| |
| |
|
Gene: CD177 |
Gene summary for CD177 |
| Gene information | Species | Human | Gene symbol | CD177 | Gene ID | 57126 |
| Gene name | CD177 molecule | |
| Gene Alias | HNA-2a | |
| Cytomap | 19q13.31 | |
| Gene Type | protein-coding | GO ID | GO:0001775 | UniProtAcc | A0A087WVM2 |
Top |
Malignant transformation analysis |
| Identification of the aberrant gene expression in precancerous and cancerous lesions by comparing the gene expression of stem-like cells in diseased tissues with normal stem cells |
| Entrez ID | Symbol | Replicates | Species | Organ | Tissue | Adj P-value | Log2FC | Malignancy |
| 57126 | CD177 | HTA11_347_2000001011 | Human | Colorectum | AD | 3.14e-17 | 8.09e-01 | -0.1954 |
| 57126 | CD177 | HTA11_411_2000001011 | Human | Colorectum | SER | 3.11e-03 | 8.61e-01 | -0.2602 |
| 57126 | CD177 | HTA11_2112_2000001011 | Human | Colorectum | SER | 6.44e-04 | 7.97e-01 | -0.2196 |
| 57126 | CD177 | HTA11_696_2000001011 | Human | Colorectum | AD | 3.47e-09 | 3.79e-01 | -0.1464 |
| 57126 | CD177 | HTA11_5212_2000001011 | Human | Colorectum | AD | 4.46e-13 | 1.04e+00 | -0.2061 |
| 57126 | CD177 | A002-C-021 | Human | Colorectum | FAP | 1.09e-04 | 1.83e-01 | 0.1171 |
| 57126 | CD177 | P31T-E | Human | Esophagus | ESCC | 3.95e-30 | 1.24e+00 | 0.1251 |
| 57126 | CD177 | P61T-E | Human | Esophagus | ESCC | 7.45e-21 | 8.29e-01 | 0.099 |
| 57126 | CD177 | P84T-E | Human | Esophagus | ESCC | 8.33e-03 | 9.03e-01 | 0.0933 |
| Page: 1 |
| Tissue | Expression Dynamics | Abbreviation |
| Colorectum (GSE201348) |  | FAP: Familial adenomatous polyposis |
| CRC: Colorectal cancer | ||
| Colorectum (HTA11) |  | AD: Adenomas |
| SER: Sessile serrated lesions | ||
| MSI-H: Microsatellite-high colorectal cancer | ||
| MSS: Microsatellite stable colorectal cancer | ||
| Esophagus | 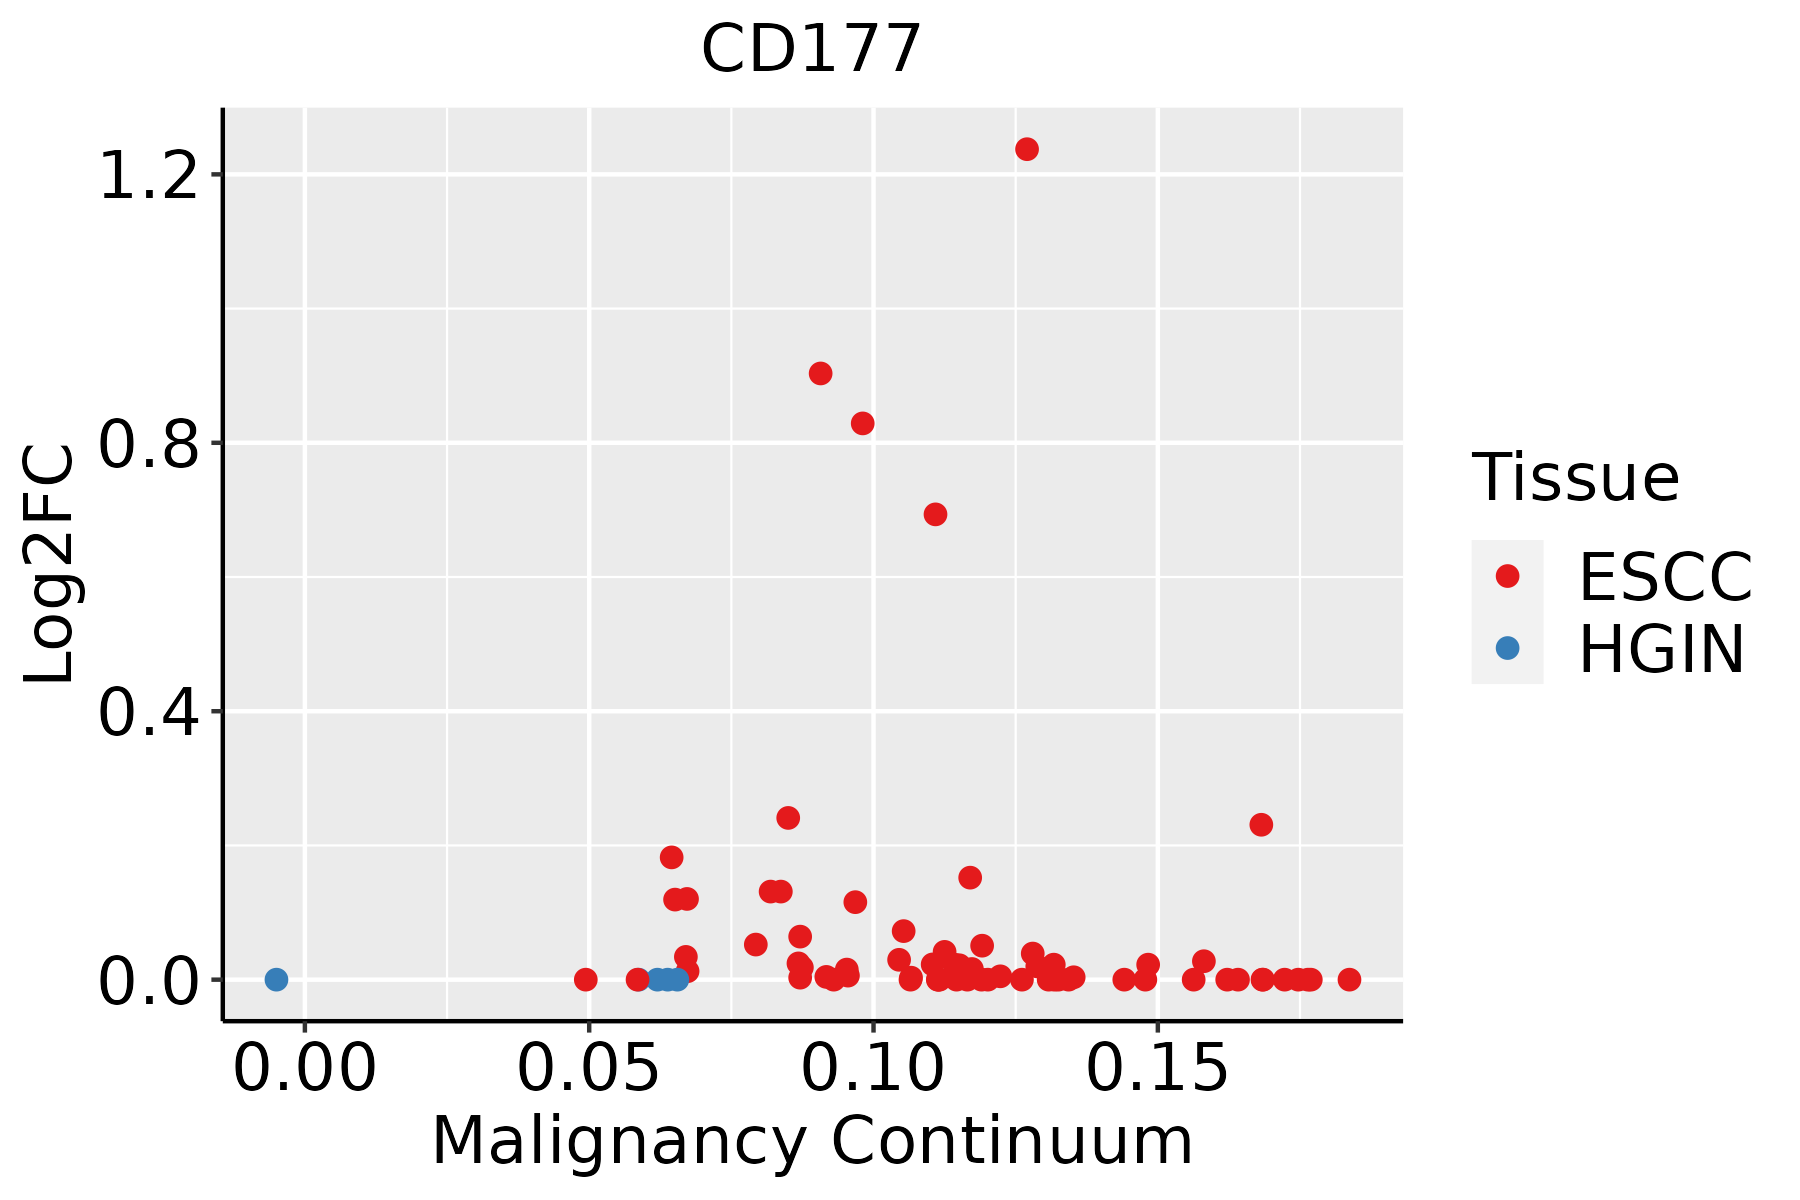 | ESCC: Esophageal squamous cell carcinoma |
| HGIN: High-grade intraepithelial neoplasias | ||
| LGIN: Low-grade intraepithelial neoplasias |
| ∗log2FC in expression of this searched gene in stem-like cells from each diseased tissue sample relative to stem-like cells in normal samples in each tissue plotted against the malignancy continuum. Samples are colored based on if they are from different disease stage. |
Top |
Malignant transformation related pathway analysis |
| Find out the enriched GO biological processes and KEGG pathways involved in transition from healthy to precancer to cancer |
| Tissue | Disease Stage | Enriched GO biological Processes |
| Colorectum | AD |  |
| Colorectum | SER |  |
| Colorectum | MSS |  |
| Colorectum | MSI-H |  |
| Colorectum | FAP |  |
| ∗Top 15 enriched GO BP terms are showed in the bar plot of each disease state in each tissue. Each row represents a significant GO biological process which is colored according to the -log10(p.adjust). |
| Page: 1 2 3 4 5 6 7 8 9 |
| GO ID | Tissue | Disease Stage | Description | Gene Ratio | Bg Ratio | pvalue | p.adjust | Count |
| GO:00301001 | Colorectum | SER | regulation of endocytosis | 48/2897 | 211/18723 | 3.29e-03 | 2.82e-02 | 48 |
| GO:00343311 | Colorectum | SER | cell junction maintenance | 12/2897 | 35/18723 | 4.72e-03 | 3.71e-02 | 12 |
| GO:00510471 | Colorectum | SER | positive regulation of secretion | 65/2897 | 310/18723 | 5.71e-03 | 4.19e-02 | 65 |
| GO:00171571 | Colorectum | SER | regulation of exocytosis | 45/2897 | 202/18723 | 6.46e-03 | 4.63e-02 | 45 |
| GO:00452164 | Colorectum | FAP | cell-cell junction organization | 58/2622 | 200/18723 | 2.51e-08 | 2.36e-06 | 58 |
| GO:00301003 | Colorectum | FAP | regulation of endocytosis | 52/2622 | 211/18723 | 2.47e-05 | 5.77e-04 | 52 |
| GO:0007229 | Colorectum | FAP | integrin-mediated signaling pathway | 30/2622 | 107/18723 | 1.10e-04 | 1.81e-03 | 30 |
| GO:00510473 | Colorectum | FAP | positive regulation of secretion | 67/2622 | 310/18723 | 1.59e-04 | 2.43e-03 | 67 |
| GO:19035322 | Colorectum | FAP | positive regulation of secretion by cell | 62/2622 | 282/18723 | 1.67e-04 | 2.52e-03 | 62 |
| GO:00439543 | Colorectum | FAP | cellular component maintenance | 19/2622 | 61/18723 | 4.61e-04 | 5.39e-03 | 19 |
| GO:00459213 | Colorectum | FAP | positive regulation of exocytosis | 22/2622 | 86/18723 | 3.11e-03 | 2.33e-02 | 22 |
| GO:00343313 | Colorectum | FAP | cell junction maintenance | 11/2622 | 35/18723 | 6.53e-03 | 4.05e-02 | 11 |
| GO:00171572 | Colorectum | FAP | regulation of exocytosis | 41/2622 | 202/18723 | 8.51e-03 | 4.95e-02 | 41 |
| GO:003010018 | Esophagus | ESCC | regulation of endocytosis | 135/8552 | 211/18723 | 5.75e-08 | 1.02e-06 | 135 |
| GO:200037718 | Esophagus | ESCC | regulation of reactive oxygen species metabolic process | 100/8552 | 157/18723 | 3.87e-06 | 4.17e-05 | 100 |
| GO:007259318 | Esophagus | ESCC | reactive oxygen species metabolic process | 137/8552 | 239/18723 | 1.82e-04 | 1.16e-03 | 137 |
| GO:00072299 | Esophagus | ESCC | integrin-mediated signaling pathway | 67/8552 | 107/18723 | 3.03e-04 | 1.81e-03 | 67 |
| GO:004521620 | Esophagus | ESCC | cell-cell junction organization | 114/8552 | 200/18723 | 8.04e-04 | 4.16e-03 | 114 |
| GO:000715918 | Esophagus | ESCC | leukocyte cell-cell adhesion | 192/8552 | 371/18723 | 1.03e-02 | 3.51e-02 | 192 |
| GO:200037918 | Esophagus | ESCC | positive regulation of reactive oxygen species metabolic process | 45/8552 | 76/18723 | 1.21e-02 | 4.04e-02 | 45 |
| Page: 1 2 |
| Pathway ID | Tissue | Disease Stage | Description | Gene Ratio | Bg Ratio | pvalue | p.adjust | qvalue | Count |
| Page: 1 |
Top |
Cell-cell communication analysis |
| Identification of potential cell-cell interactions between two cell types and their ligand-receptor pairs for different disease states |
| Ligand | Receptor | LRpair | Pathway | Tissue | Disease Stage |
| Page: 1 |
Top |
Single-cell gene regulatory network inference analysis |
| Find out the significant the regulons (TFs) and the target genes of each regulon across cell types for different disease states |
| TF | Cell Type | Tissue | Disease Stage | Target Gene | RSS | Regulon Activity |
| ∗The dot plots of a searched regulon are shown for all cell subpopulations in each disease state of each tissue based on the regulon specific score inferred using pySCENIC and by calculating the average expression. |
| Page: 1 |
Top |
Somatic mutation of malignant transformation related genes |
| Annotation of somatic variants for genes involved in malignant transformation |
| Hugo Symbol | Variant Class | Variant Classification | dbSNP RS | HGVSc | HGVSp | HGVSp Short | SWISSPROT | BIOTYPE | SIFT | PolyPhen | Tumor Sample Barcode | Tissue | Histology | Sex | Age | Stage | Therapy Types | Drugs | Outcome |
| CD177 | SNV | Missense_Mutation | rs553041744 | c.676N>A | p.Glu226Lys | p.E226K | protein_coding | tolerated(0.69) | benign(0.013) | TCGA-A2-A0CL-01 | Breast | breast invasive carcinoma | Female | <65 | III/IV | Chemotherapy | cytoxan | SD | |
| CD177 | SNV | Missense_Mutation | novel | c.1171T>C | p.Ser391Pro | p.S391P | protein_coding | deleterious(0.02) | possibly_damaging(0.891) | TCGA-A2-A0SX-01 | Breast | breast invasive carcinoma | Female | <65 | I/II | Chemotherapy | adriamycin | PD | |
| CD177 | SNV | Missense_Mutation | novel | c.803N>C | p.Val268Ala | p.V268A | protein_coding | tolerated(0.99) | benign(0) | TCGA-AN-A046-01 | Breast | breast invasive carcinoma | Female | >=65 | I/II | Unknown | Unknown | SD | |
| CD177 | SNV | Missense_Mutation | rs778544491 | c.638G>A | p.Arg213Gln | p.R213Q | protein_coding | tolerated(0.08) | benign(0.038) | TCGA-C8-A26W-01 | Breast | breast invasive carcinoma | Female | <65 | I/II | Chemotherapy | doxorubicin | CR | |
| CD177 | SNV | Missense_Mutation | novel | c.1091N>T | p.Ser364Phe | p.S364F | protein_coding | tolerated(0.2) | benign(0.02) | TCGA-C8-A3M7-01 | Breast | breast invasive carcinoma | Female | <65 | III/IV | Unknown | Unknown | PD | |
| CD177 | SNV | Missense_Mutation | novel | c.1273G>A | p.Ala425Thr | p.A425T | protein_coding | tolerated(0.39) | possibly_damaging(0.511) | TCGA-EK-A2R7-01 | Cervix | cervical & endocervical cancer | Female | <65 | I/II | Unknown | Unknown | SD | |
| CD177 | SNV | Missense_Mutation | novel | c.943C>G | p.Gln315Glu | p.Q315E | protein_coding | tolerated(0.11) | benign(0.039) | TCGA-MY-A913-01 | Cervix | cervical & endocervical cancer | Female | <65 | I/II | Chemotherapy | cisplatin | CR | |
| CD177 | SNV | Missense_Mutation | novel | c.306C>A | p.Phe102Leu | p.F102L | protein_coding | tolerated(0.12) | benign(0.003) | TCGA-VS-A94X-01 | Cervix | cervical & endocervical cancer | Female | <65 | I/II | Chemotherapy | cisplatin | PD | |
| CD177 | SNV | Missense_Mutation | novel | c.773N>A | p.Thr258Asn | p.T258N | protein_coding | deleterious(0.01) | benign(0.031) | TCGA-AA-3685-01 | Colorectum | colon adenocarcinoma | Male | >=65 | I/II | Unknown | Unknown | SD | |
| CD177 | SNV | Missense_Mutation | c.476A>G | p.Tyr159Cys | p.Y159C | protein_coding | deleterious(0) | probably_damaging(1) | TCGA-AA-3811-01 | Colorectum | colon adenocarcinoma | Female | >=65 | III/IV | Unknown | Unknown | PD |
| Page: 1 2 3 4 5 6 |
Top |
Related drugs of malignant transformation related genes |
| Identification of chemicals and drugs interact with genes involved in malignant transfromation |
| (DGIdb 4.0) |
| Entrez ID | Symbol | Category | Interaction Types | Drug Claim Name | Drug Name | PMIDs |
| Page: 1 |

Copyright 2023-Present -The University of Texas Health Science Center at Houston |