Schematic overview of the cellular and molecular mechanisms involved in the cancer progression, including the proposed cellular and molecular mechanisms in cancer cells trajectory. AT1: alveolar type 1 cells; AT2: alveolar type 2 cells; AAH: atypical adenomatous hyperplasia; AIS: adenocarcinoma in situ; MIA: minimally invasive adenocarcinoma; IA: invasive adenocarcinoma; EMT: epithelial-mesenchymal transition

Home

Download

Statistics

Help

Contact

Center for Computational Systems Medicine
leaf

Gene summary

leaf

Malignant transformation analysis

leaf

Malignant transformation related pathway analysis

leaf

Cell-cell communication analysis

leaf

Single-cell gene regulatory network inference analysis

leaf

Somatic mutation of malignant transformation related genes

leaf

Related drugs of malignant transformation related genes

Gene: CCT3

Gene summary for CCT3

check button Gene summary.

Gene informationSpeciesHuman
Gene symbol

CCT3

Gene ID

7203

Gene namechaperonin containing TCP1 subunit 3
Gene AliasCCT-gamma
Cytomap1q22
Gene Typeprotein-coding
GO ID

GO:0000003

UniProtAcc

B3KX11


Top

Malignant transformation analysis

check button Identification of the aberrant gene expression in precancerous and cancerous lesions by comparing the gene expression of stem-like cells in diseased tissues with normal stem cells
check button Malignant transformation involving gene list.
Entrez IDSymbolReplicatesSpeciesOrganTissueAdj P-valueLog2FCMalignancy
7203CCT3HTA11_3410_2000001011HumanColorectumAD4.31e-063.23e-010.0155
7203CCT3HTA11_2487_2000001011HumanColorectumSER2.24e-044.71e-01-0.1808
7203CCT3HTA11_2951_2000001011HumanColorectumAD4.86e-025.58e-010.0216
7203CCT3HTA11_1938_2000001011HumanColorectumAD5.74e-177.87e-01-0.0811
7203CCT3HTA11_78_2000001011HumanColorectumAD3.45e-085.31e-01-0.1088
7203CCT3HTA11_347_2000001011HumanColorectumAD3.63e-206.57e-01-0.1954
7203CCT3HTA11_3361_2000001011HumanColorectumAD4.45e-077.28e-01-0.1207
7203CCT3HTA11_83_2000001011HumanColorectumSER3.90e-074.94e-01-0.1526
7203CCT3HTA11_696_2000001011HumanColorectumAD7.49e-146.02e-01-0.1464
7203CCT3HTA11_866_2000001011HumanColorectumAD2.40e-105.03e-01-0.1001
7203CCT3HTA11_1391_2000001011HumanColorectumAD2.57e-291.25e+00-0.059
7203CCT3HTA11_2992_2000001011HumanColorectumSER6.44e-057.46e-01-0.1706
7203CCT3HTA11_5212_2000001011HumanColorectumAD1.37e-033.79e-01-0.2061
7203CCT3HTA11_5216_2000001011HumanColorectumSER3.11e-046.53e-01-0.1462
7203CCT3HTA11_546_2000001011HumanColorectumAD2.92e-065.60e-01-0.0842
7203CCT3HTA11_7862_2000001011HumanColorectumAD2.18e-024.93e-01-0.0179
7203CCT3HTA11_866_3004761011HumanColorectumAD2.93e-291.10e+000.096
7203CCT3HTA11_4255_2000001011HumanColorectumSER2.67e-026.16e-010.0446
7203CCT3HTA11_8622_2000001021HumanColorectumSER1.81e-045.50e-010.0528
7203CCT3HTA11_7663_2000001011HumanColorectumSER8.84e-056.63e-010.0131
Page: 1 2 3 4 5 6 7 8 9 10 11 

check button Transcriptomic changes along malignancy continuum.
TissueExpression DynamicsAbbreviation
Colorectum (GSE201348)The image shows the transcriptomic changes along malignancy continuum.log2FC in expression of this searched gene in stem-like cells from each diseased tissue sample relative to stem-like cells in normal samples in each tissue plotted against the malignancy continuum. Samples are colored based on if they are from different disease stage.FAP: Familial adenomatous polyposis
CRC: Colorectal cancer
Colorectum (HTA11)The image shows the transcriptomic changes along malignancy continuum.log2FC in expression of this searched gene in stem-like cells from each diseased tissue sample relative to stem-like cells in normal samples in each tissue plotted against the malignancy continuum. Samples are colored based on if they are from different disease stage.AD: Adenomas
SER: Sessile serrated lesions
MSI-H: Microsatellite-high colorectal cancer
MSS: Microsatellite stable colorectal cancer
EndometriumThe image shows the transcriptomic changes along malignancy continuum.log2FC in expression of this searched gene in stem-like cells from each diseased tissue sample relative to stem-like cells in normal samples in each tissue plotted against the malignancy continuum. Samples are colored based on if they are from different disease stage.
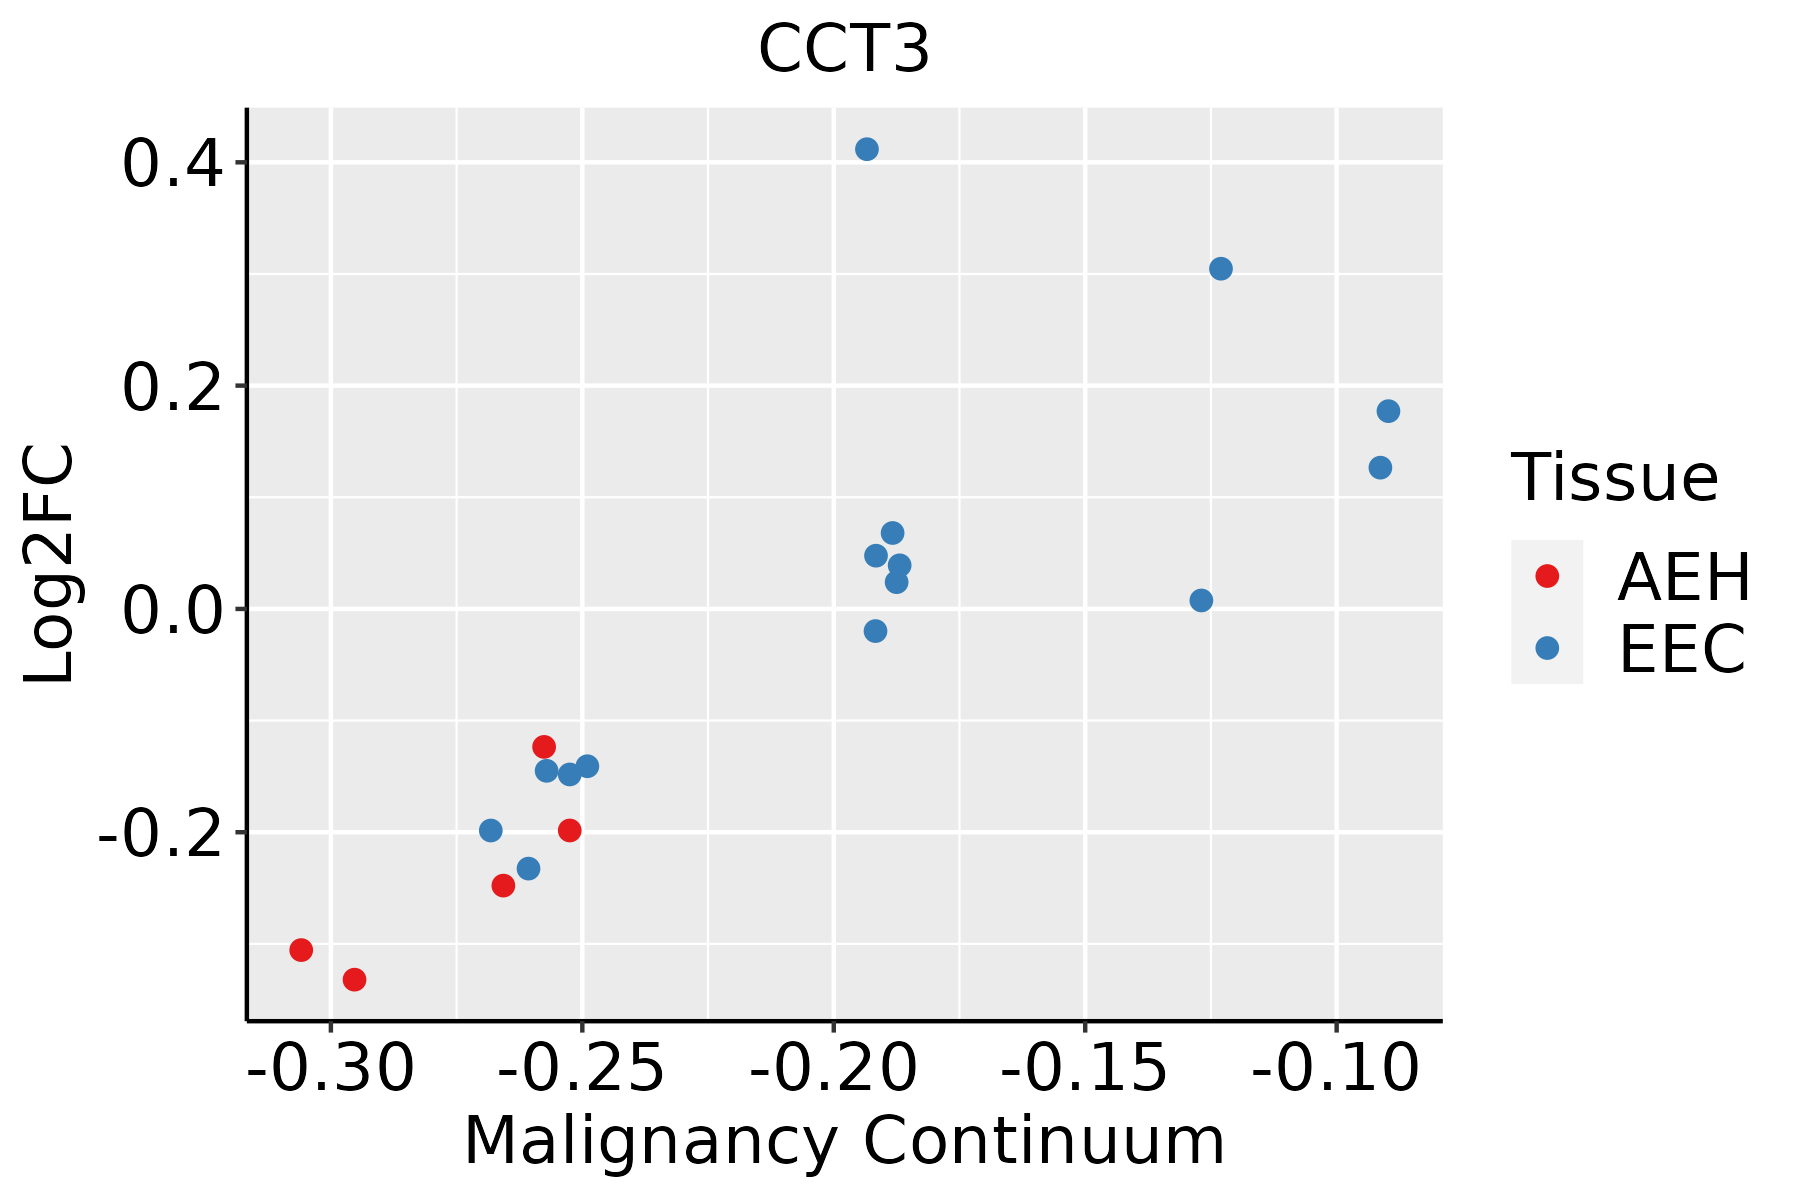
AEH: Atypical endometrial hyperplasia
EEC: Endometrioid Cancer
EsophagusThe image shows the transcriptomic changes along malignancy continuum.log2FC in expression of this searched gene in stem-like cells from each diseased tissue sample relative to stem-like cells in normal samples in each tissue plotted against the malignancy continuum. Samples are colored based on if they are from different disease stage.
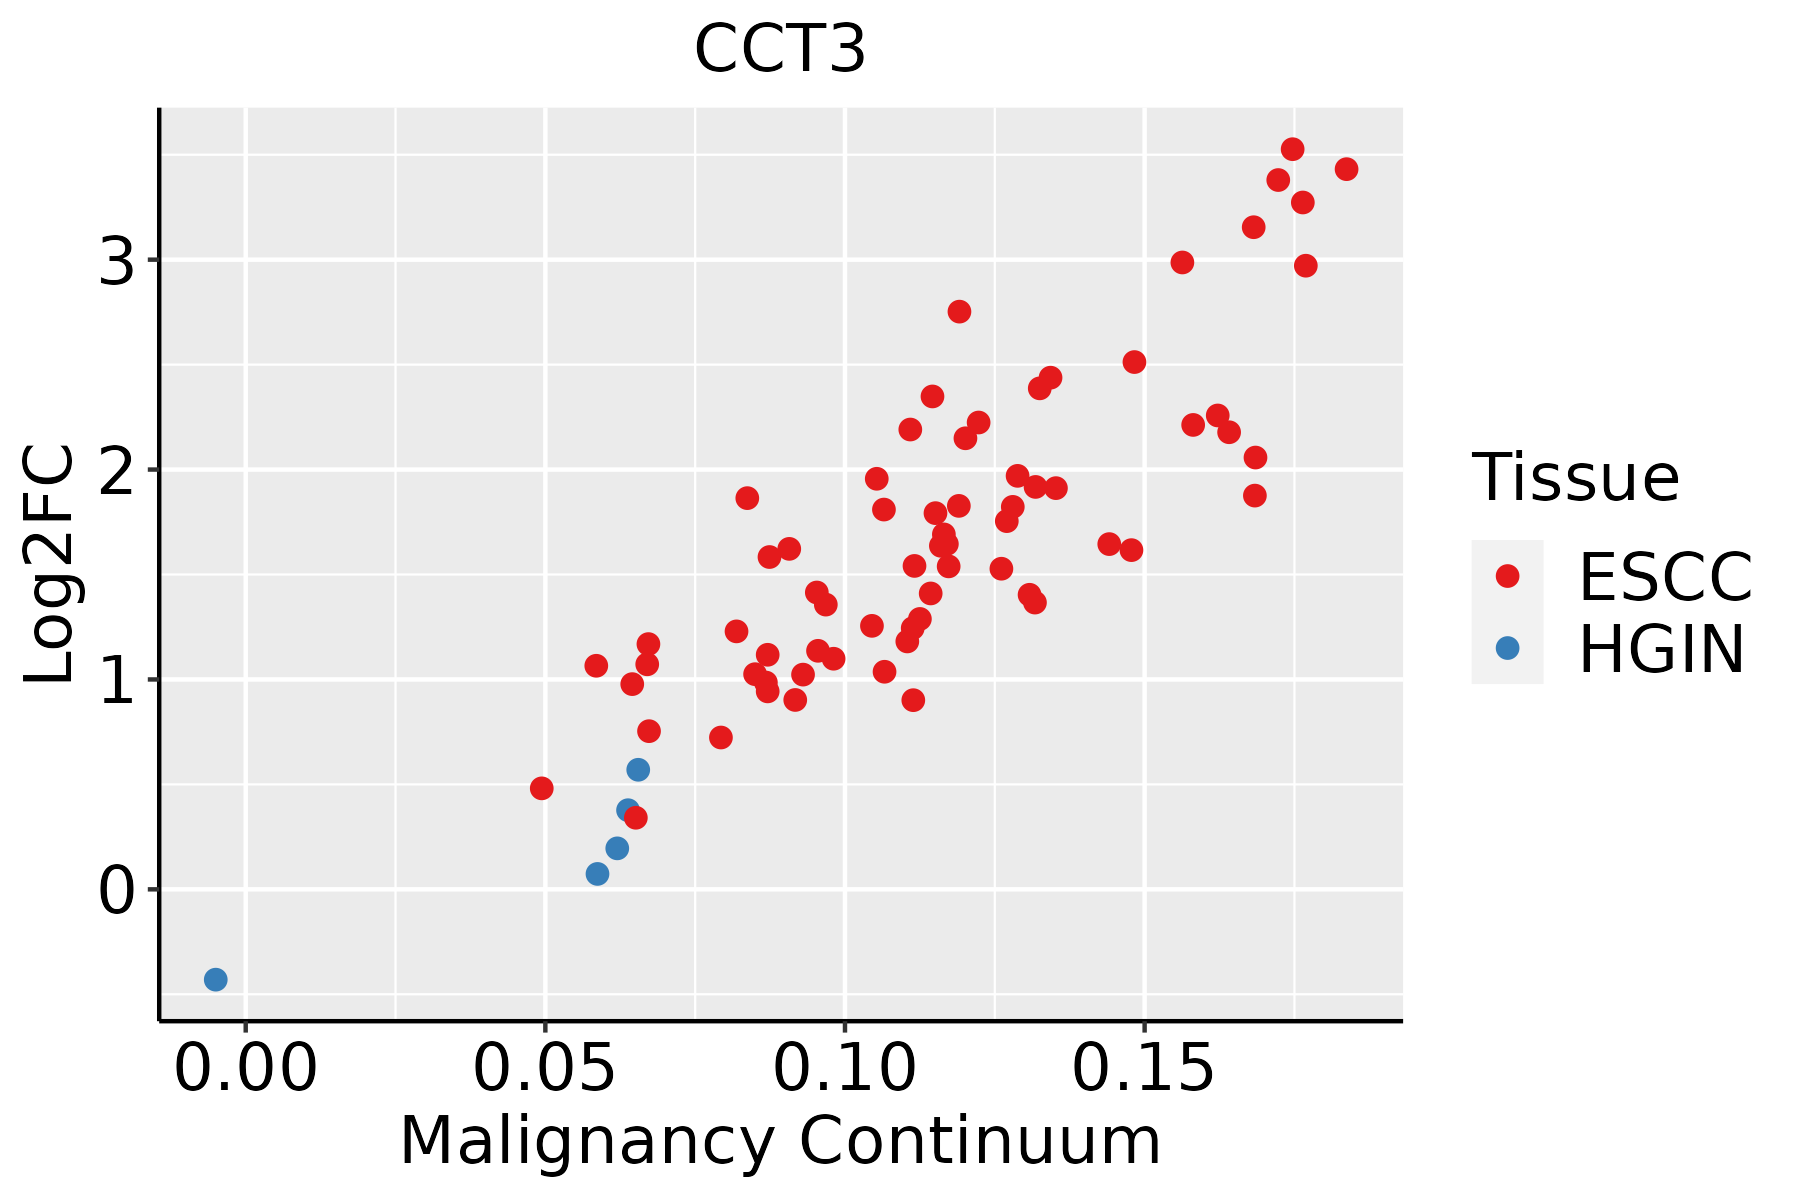
ESCC: Esophageal squamous cell carcinoma
HGIN: High-grade intraepithelial neoplasias
LGIN: Low-grade intraepithelial neoplasias
LiverThe image shows the transcriptomic changes along malignancy continuum.log2FC in expression of this searched gene in stem-like cells from each diseased tissue sample relative to stem-like cells in normal samples in each tissue plotted against the malignancy continuum. Samples are colored based on if they are from different disease stage.
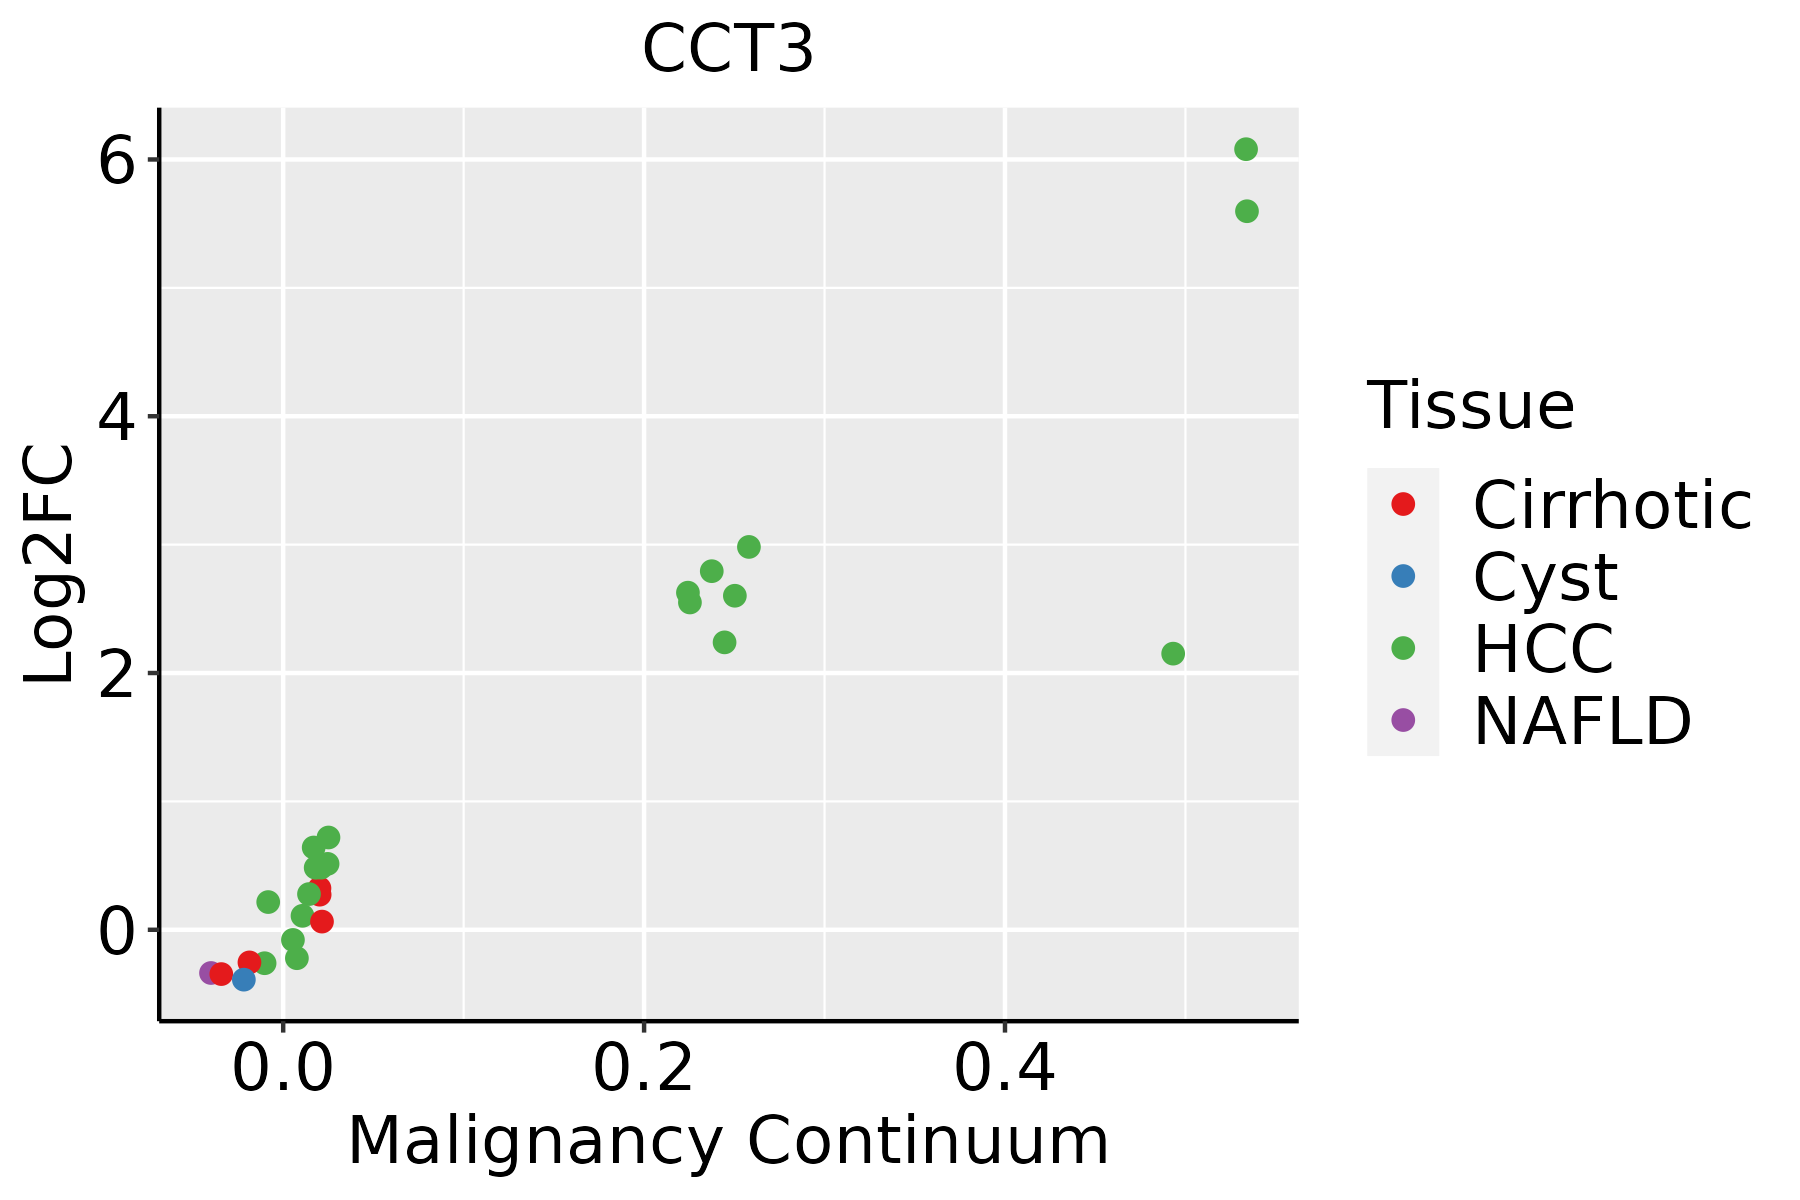
HCC: Hepatocellular carcinoma
NAFLD: Non-alcoholic fatty liver disease
Oral CavityThe image shows the transcriptomic changes along malignancy continuum.log2FC in expression of this searched gene in stem-like cells from each diseased tissue sample relative to stem-like cells in normal samples in each tissue plotted against the malignancy continuum. Samples are colored based on if they are from different disease stage.EOLP: Erosive Oral lichen planus
LP: leukoplakia
NEOLP: Non-erosive oral lichen planus
OSCC: Oral squamous cell carcinoma
ProstateThe image shows the transcriptomic changes along malignancy continuum.log2FC in expression of this searched gene in stem-like cells from each diseased tissue sample relative to stem-like cells in normal samples in each tissue plotted against the malignancy continuum. Samples are colored based on if they are from different disease stage.
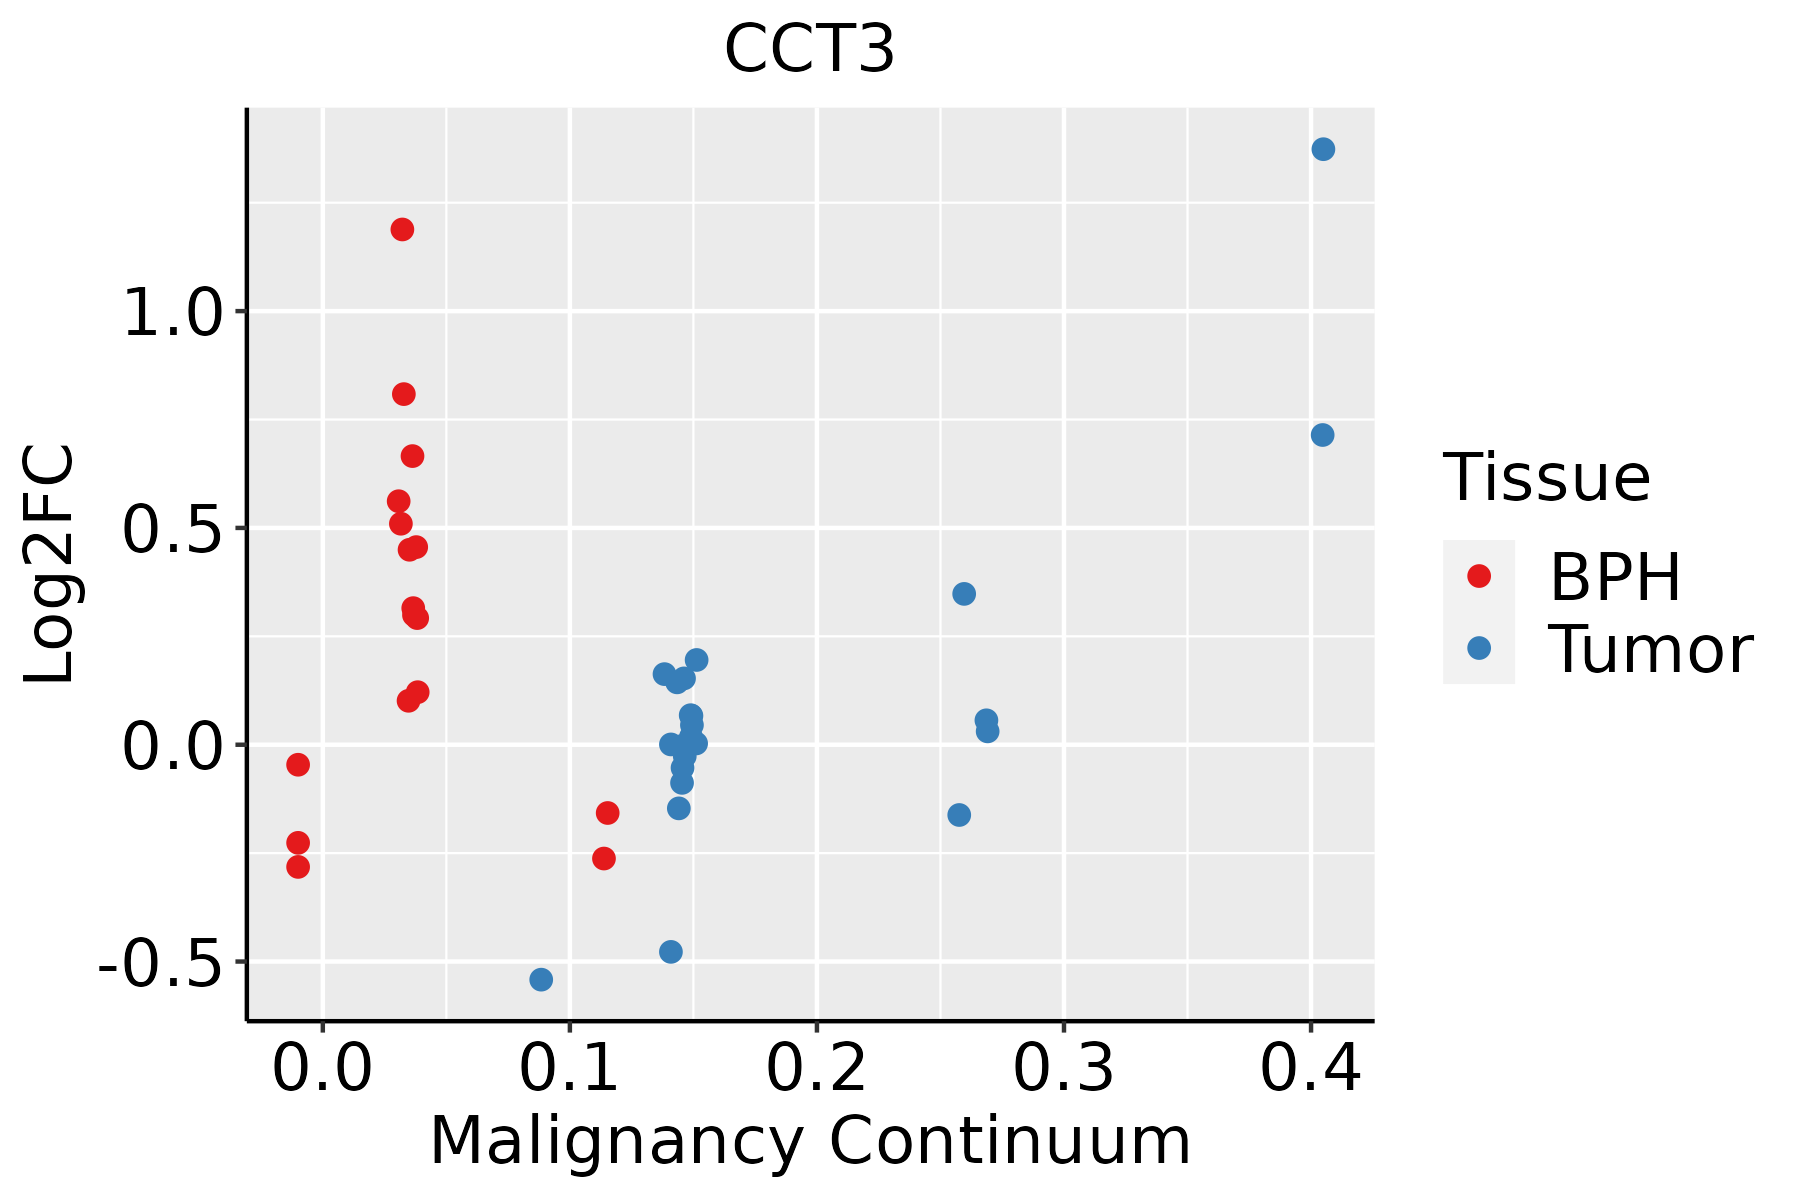
BPH: Benign Prostatic Hyperplasia
SkinThe image shows the transcriptomic changes along malignancy continuum.log2FC in expression of this searched gene in stem-like cells from each diseased tissue sample relative to stem-like cells in normal samples in each tissue plotted against the malignancy continuum. Samples are colored based on if they are from different disease stage.
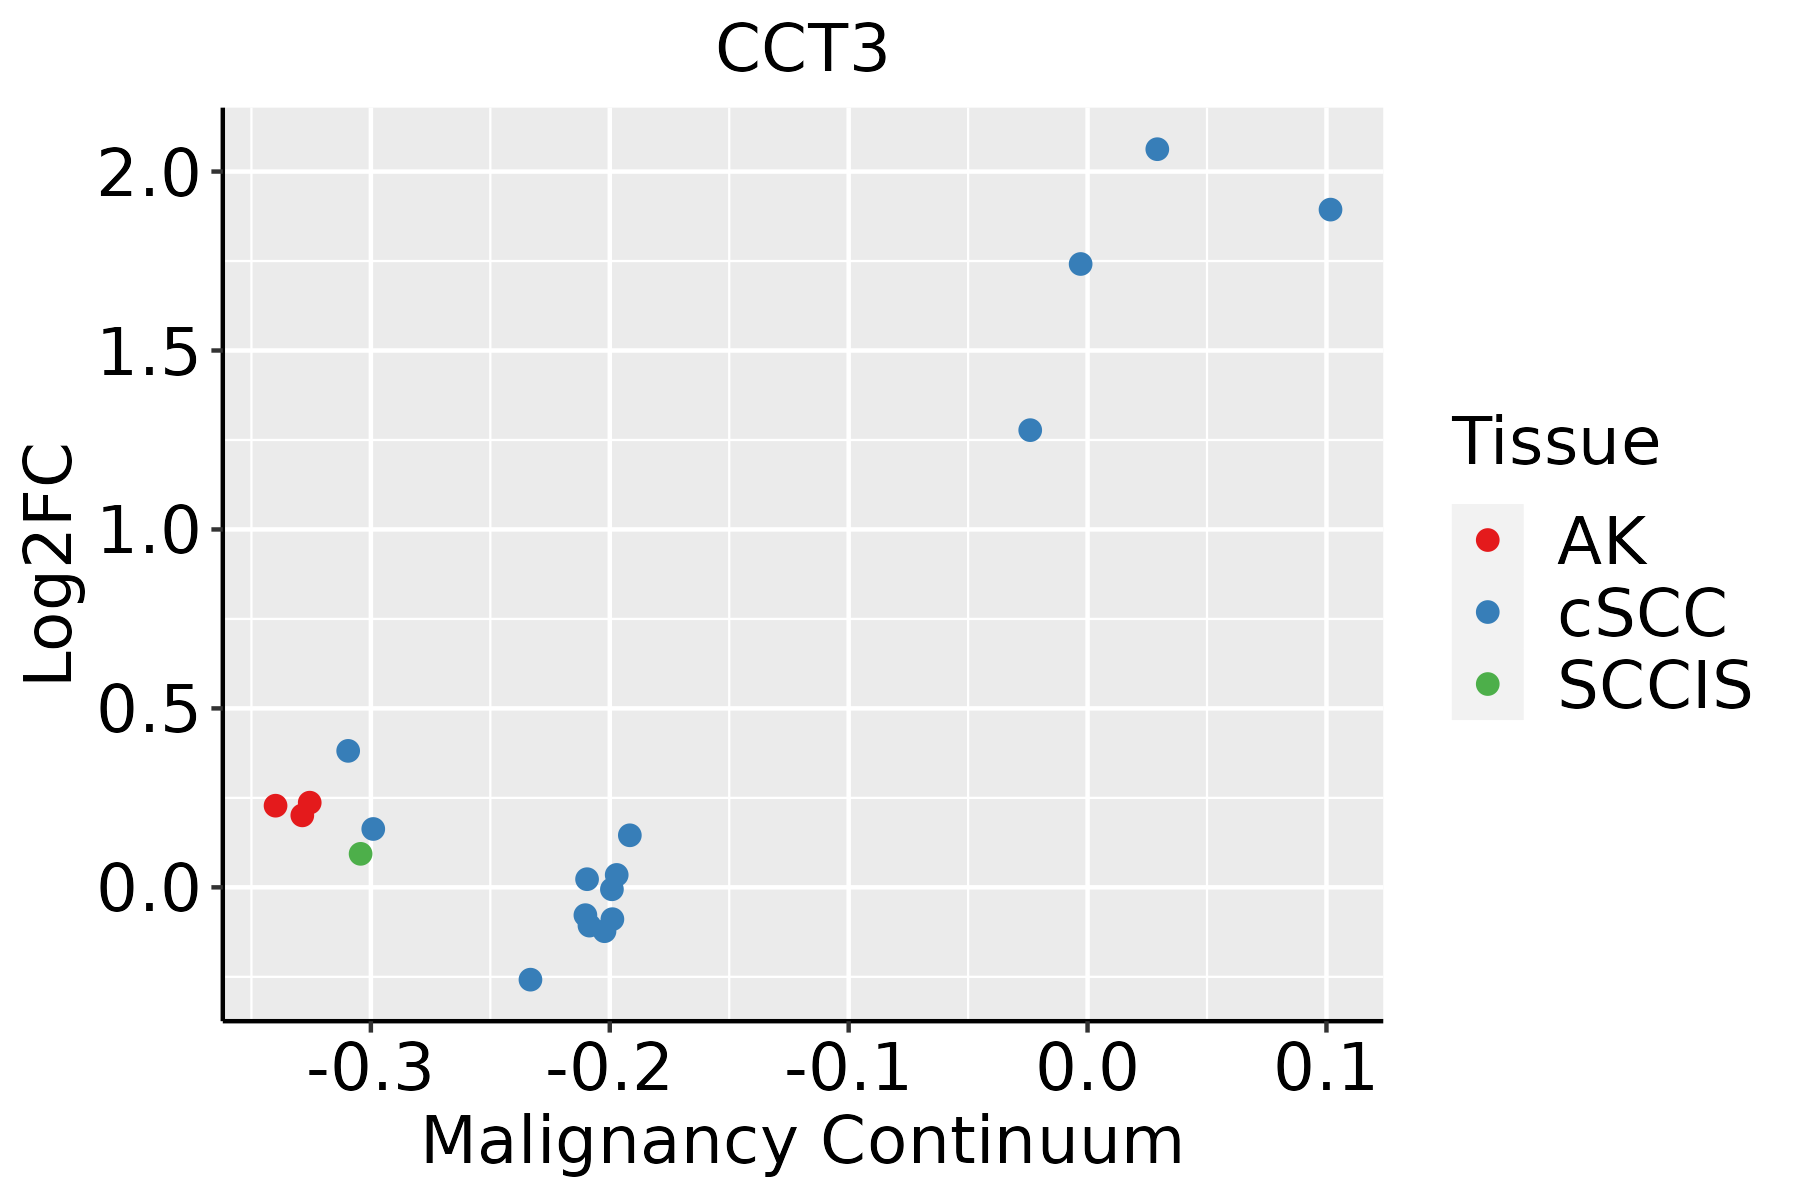
AK: Actinic keratosis
cSCC: Cutaneous squamous cell carcinoma
SCCIS:squamous cell carcinoma in situ
ThyroidThe image shows the transcriptomic changes along malignancy continuum.log2FC in expression of this searched gene in stem-like cells from each diseased tissue sample relative to stem-like cells in normal samples in each tissue plotted against the malignancy continuum. Samples are colored based on if they are from different disease stage.
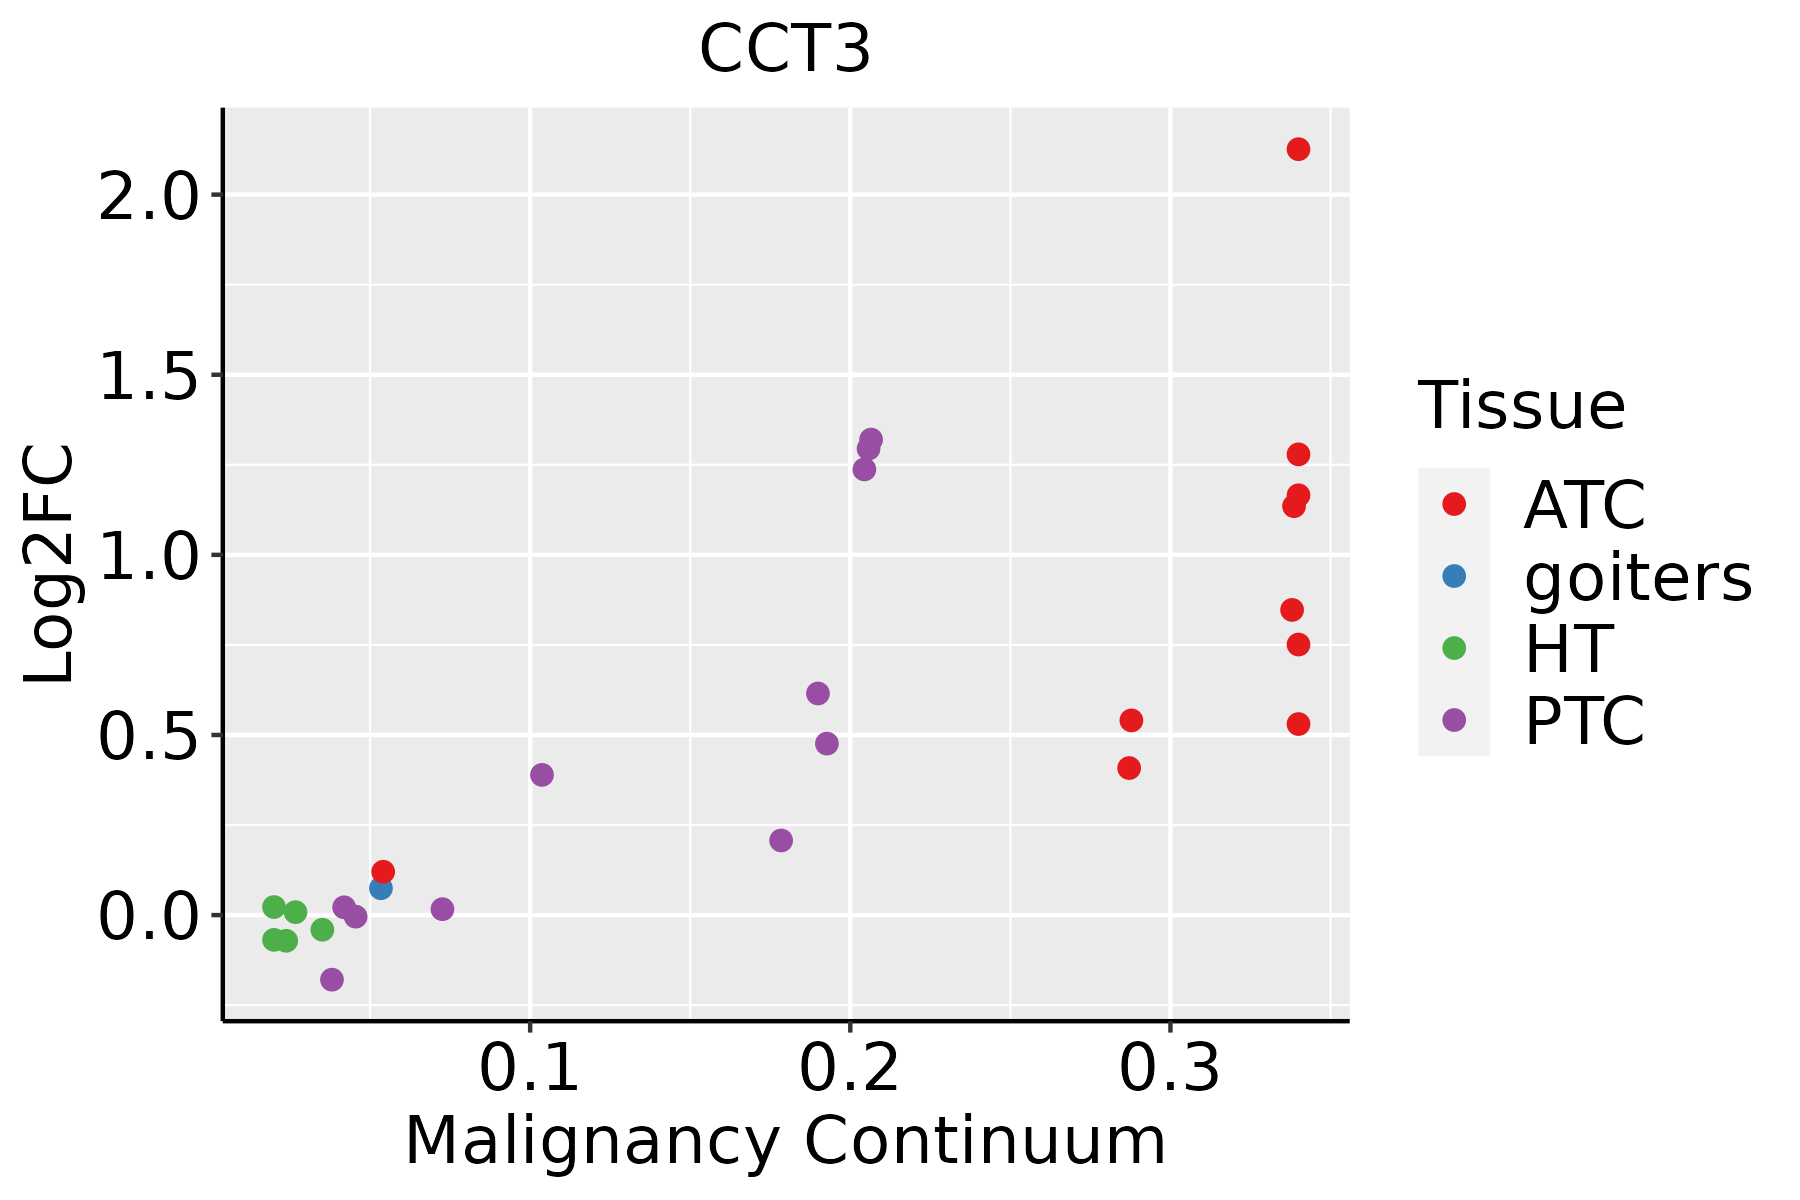
ATC: Anaplastic thyroid cancer
HT: Hashimoto's thyroiditis
PTC: Papillary thyroid cancer
∗log2FC in expression of this searched gene in stem-like cells from each diseased tissue sample relative to stem-like cells in normal samples in each tissue plotted against the malignancy continuum. Samples are colored based on if they are from different disease stage.

Top

Malignant transformation related pathway analysis

check buttonFind out the enriched GO biological processes and KEGG pathways involved in transition from healthy to precancer to cancer
check button Figure of enriched GO biological processes.
TissueDisease StageEnriched GO biological Processes
ColorectumADGO analysis - Figure of enriched GO biological processes: Top 15 enriched GO BP terms are showed in the bar plot of each disease state in each tissue. Each row represents a significant GO biological process which is colored according to the -log10(p.adjust).
ColorectumSERGO analysis - Figure of enriched GO biological processes: Top 15 enriched GO BP terms are showed in the bar plot of each disease state in each tissue. Each row represents a significant GO biological process which is colored according to the -log10(p.adjust).
ColorectumMSSGO analysis - Figure of enriched GO biological processes: Top 15 enriched GO BP terms are showed in the bar plot of each disease state in each tissue. Each row represents a significant GO biological process which is colored according to the -log10(p.adjust).
ColorectumMSI-HGO analysis - Figure of enriched GO biological processes: Top 15 enriched GO BP terms are showed in the bar plot of each disease state in each tissue. Each row represents a significant GO biological process which is colored according to the -log10(p.adjust).
ColorectumFAPGO analysis - Figure of enriched GO biological processes: Top 15 enriched GO BP terms are showed in the bar plot of each disease state in each tissue. Each row represents a significant GO biological process which is colored according to the -log10(p.adjust).
∗Top 15 enriched GO BP terms are showed in the bar plot of each disease state in each tissue. Each row represents a significant GO biological process which is colored according to the -log10(p.adjust).
Page: 1 2 3 4 5 6 7 8 9 

check button Enriched GO biological processes.
GO IDTissueDisease StageDescriptionGene RatioBg Ratiopvaluep.adjustCount
GO:0071897ColorectumADDNA biosynthetic process55/3918180/187231.46e-031.24e-0255
GO:1904358ColorectumADpositive regulation of telomere maintenance via telomere lengthening16/391837/187231.81e-031.49e-0216
GO:1904356ColorectumADregulation of telomere maintenance via telomere lengthening23/391861/187231.96e-031.58e-0223
GO:0032212ColorectumADpositive regulation of telomere maintenance via telomerase15/391834/187231.96e-031.58e-0215
GO:0007004ColorectumADtelomere maintenance via telomerase25/391869/187232.43e-031.88e-0225
GO:0070198ColorectumADprotein localization to chromosome, telomeric region13/391829/187233.26e-032.39e-0213
GO:0070202ColorectumADregulation of establishment of protein localization to chromosome7/391812/187235.09e-033.38e-027
GO:1904851ColorectumADpositive regulation of establishment of protein localization to telomere6/391810/187238.03e-034.73e-026
GO:0006278ColorectumADRNA-dependent DNA biosynthetic process25/391875/187238.36e-034.89e-0225
GO:19038291ColorectumSERpositive regulation of cellular protein localization86/2897276/187233.61e-116.11e-0986
GO:19049511ColorectumSERpositive regulation of establishment of protein localization91/2897319/187231.69e-091.68e-0791
GO:00316471ColorectumSERregulation of protein stability86/2897298/187232.56e-092.42e-0786
GO:00725941ColorectumSERestablishment of protein localization to organelle111/2897422/187234.98e-094.49e-07111
GO:19001801ColorectumSERregulation of protein localization to nucleus46/2897136/187238.50e-085.27e-0646
GO:00508211ColorectumSERprotein stabilization58/2897191/187231.46e-078.59e-0658
GO:19001821ColorectumSERpositive regulation of protein localization to nucleus33/289787/187232.81e-071.52e-0533
GO:00345041ColorectumSERprotein localization to nucleus74/2897290/187235.74e-062.05e-0474
GO:20002781ColorectumSERregulation of DNA biosynthetic process33/2897106/187233.83e-059.82e-0433
GO:00064031ColorectumSERRNA localization53/2897201/187234.51e-051.13e-0353
GO:00510541ColorectumSERpositive regulation of DNA metabolic process53/2897201/187234.51e-051.13e-0353
Page: 1 2 3 4 5 6 7 8 9 10 11 12 13 14 15 16 17 18 19 20 21 22 23 24 25 26 27 28 29 30 31 32 33 34 35 36 37 38 39 40 41 42 

check button Enriched KEGG pathways.
Pathway IDTissueDisease StageDescriptionGene RatioBg Ratiopvaluep.adjustqvalueCount
Page: 1 

Top

Cell-cell communication analysis

check buttonIdentification of potential cell-cell interactions between two cell types and their ligand-receptor pairs for different disease states
LigandReceptorLRpairPathwayTissueDisease Stage
Page: 1 

Top

Single-cell gene regulatory network inference analysis

check buttonFind out the significant the regulons (TFs) and the target genes of each regulon across cell types for different disease states
TFCell TypeTissueDisease StageTarget GeneRSSRegulon Activity
∗The dot plots of a searched regulon are shown for all cell subpopulations in each disease state of each tissue based on the regulon specific score inferred using pySCENIC and by calculating the average expression.
Page: 1 

Top

Somatic mutation of malignant transformation related genes

check buttonAnnotation of somatic variants for genes involved in malignant transformation
Hugo SymbolVariant ClassVariant ClassificationdbSNP RSHGVScHGVSpHGVSp ShortSWISSPROTBIOTYPESIFTPolyPhenTumor Sample BarcodeTissueHistologySexAgeStageTherapy TypesDrugsOutcome
CCT3SNVMissense_Mutationnovelc.1345C>Ap.Arg449Serp.R449SP49368protein_codingdeleterious(0.04)possibly_damaging(0.531)TCGA-A7-A4SF-01Breastbreast invasive carcinomaFemale<65I/IIChemotherapycarboplatinCR
CCT3SNVMissense_Mutationrs763340746c.1535N>Tp.Thr512Metp.T512MP49368protein_codingdeleterious(0)probably_damaging(0.932)TCGA-BH-A0EE-01Breastbreast invasive carcinomaFemale>=65I/IIChemotherapydocetaxelSD
CCT3SNVMissense_Mutationc.773N>Gp.Ile258Serp.I258SP49368protein_codingdeleterious(0)possibly_damaging(0.883)TCGA-D8-A1X9-01Breastbreast invasive carcinomaFemale>=65I/IIChemotherapyadriamycin+cyclophosphamideSD
CCT3SNVMissense_Mutationrs746245572c.710N>Ap.Arg237Hisp.R237HP49368protein_codingdeleterious(0)possibly_damaging(0.803)TCGA-D8-A1XT-01Breastbreast invasive carcinomaFemale<65I/IIChemotherapyadriamycin+cyclophosphamideSD
CCT3SNVMissense_Mutationc.1447G>Ap.Glu483Lysp.E483KP49368protein_codingtolerated(0.47)benign(0.013)TCGA-EW-A1OV-01Breastbreast invasive carcinomaFemale<65I/IIChemotherapyepirubicinSD
CCT3insertionNonsense_Mutationnovelc.1227_1228insAAGACCTAACTTTATGGTTAGp.Pro409_Gly410insLysThrTerLeuTyrGlyTerp.P409_G410insKT*LYG*P49368protein_codingTCGA-B6-A0RG-01Breastbreast invasive carcinomaFemale<65I/IIUnknownUnknownSD
CCT3insertionNonsense_Mutationnovelc.1225_1226insTAGCATAATGGAp.Pro409delinsLeuAlaTerTrpThrp.P409delinsLA*WTP49368protein_codingTCGA-B6-A0RG-01Breastbreast invasive carcinomaFemale<65I/IIUnknownUnknownSD
CCT3SNVMissense_Mutationrs375964353c.688C>Tp.Arg230Trpp.R230WP49368protein_codingdeleterious(0)probably_damaging(0.995)TCGA-EA-A3HU-01Cervixcervical & endocervical cancerFemale<65I/IIUnknownUnknownSD
CCT3SNVMissense_Mutationrs373870763c.1567G>Ap.Val523Ilep.V523IP49368protein_codingtolerated(0.29)possibly_damaging(0.546)TCGA-AA-3864-01Colorectumcolon adenocarcinomaMale>=65I/IIUnknownUnknownSD
CCT3SNVMissense_Mutationnovelc.59G>Tp.Arg20Ilep.R20IP49368protein_codingdeleterious(0)possibly_damaging(0.786)TCGA-AA-A00N-01Colorectumcolon adenocarcinomaMale>=65I/IIUnknownUnknownPD
Page: 1 2 3 4 5 6 7 

Top

Related drugs of malignant transformation related genes

check buttonIdentification of chemicals and drugs interact with genes involved in malignant transfromation
(DGIdb 4.0)
Entrez IDSymbolCategoryInteraction TypesDrug Claim NameDrug NamePMIDs
Page: 1