
|
|||||
|
 | |
| |
| |
| |
| |
| |
|
Gene: CCS |
Gene summary for CCS |
| Gene information | Species | Human | Gene symbol | CCS | Gene ID | 9973 |
| Gene name | copper chaperone for superoxide dismutase | |
| Gene Alias | CCS | |
| Cytomap | 11q13.2 | |
| Gene Type | protein-coding | GO ID | GO:0000302 | UniProtAcc | O14618 |
Top |
Malignant transformation analysis |
| Identification of the aberrant gene expression in precancerous and cancerous lesions by comparing the gene expression of stem-like cells in diseased tissues with normal stem cells |
| Entrez ID | Symbol | Replicates | Species | Organ | Tissue | Adj P-value | Log2FC | Malignancy |
| 9973 | CCS | LZE4T | Human | Esophagus | ESCC | 2.15e-10 | 4.19e-01 | 0.0811 |
| 9973 | CCS | LZE5T | Human | Esophagus | ESCC | 1.78e-05 | 3.64e-01 | 0.0514 |
| 9973 | CCS | LZE7T | Human | Esophagus | ESCC | 1.11e-05 | 5.48e-01 | 0.0667 |
| 9973 | CCS | LZE8T | Human | Esophagus | ESCC | 3.49e-03 | 2.65e-01 | 0.067 |
| 9973 | CCS | LZE20T | Human | Esophagus | ESCC | 3.61e-13 | 6.50e-01 | 0.0662 |
| 9973 | CCS | LZE22T | Human | Esophagus | ESCC | 3.35e-03 | 2.65e-01 | 0.068 |
| 9973 | CCS | LZE24T | Human | Esophagus | ESCC | 9.47e-35 | 9.88e-01 | 0.0596 |
| 9973 | CCS | LZE6T | Human | Esophagus | ESCC | 2.62e-10 | 4.16e-01 | 0.0845 |
| 9973 | CCS | P1T-E | Human | Esophagus | ESCC | 5.11e-14 | 7.24e-01 | 0.0875 |
| 9973 | CCS | P2T-E | Human | Esophagus | ESCC | 1.30e-34 | 6.24e-01 | 0.1177 |
| 9973 | CCS | P4T-E | Human | Esophagus | ESCC | 4.07e-45 | 1.01e+00 | 0.1323 |
| 9973 | CCS | P5T-E | Human | Esophagus | ESCC | 1.41e-32 | 5.74e-01 | 0.1327 |
| 9973 | CCS | P8T-E | Human | Esophagus | ESCC | 5.85e-55 | 1.06e+00 | 0.0889 |
| 9973 | CCS | P9T-E | Human | Esophagus | ESCC | 4.76e-22 | 4.22e-01 | 0.1131 |
| 9973 | CCS | P10T-E | Human | Esophagus | ESCC | 2.18e-22 | 4.27e-01 | 0.116 |
| 9973 | CCS | P11T-E | Human | Esophagus | ESCC | 1.04e-25 | 8.32e-01 | 0.1426 |
| 9973 | CCS | P12T-E | Human | Esophagus | ESCC | 1.20e-52 | 9.72e-01 | 0.1122 |
| 9973 | CCS | P15T-E | Human | Esophagus | ESCC | 4.97e-26 | 5.90e-01 | 0.1149 |
| 9973 | CCS | P16T-E | Human | Esophagus | ESCC | 1.31e-36 | 6.63e-01 | 0.1153 |
| 9973 | CCS | P17T-E | Human | Esophagus | ESCC | 1.78e-13 | 7.14e-01 | 0.1278 |
| Page: 1 2 3 4 5 6 |
| Tissue | Expression Dynamics | Abbreviation |
| Esophagus | 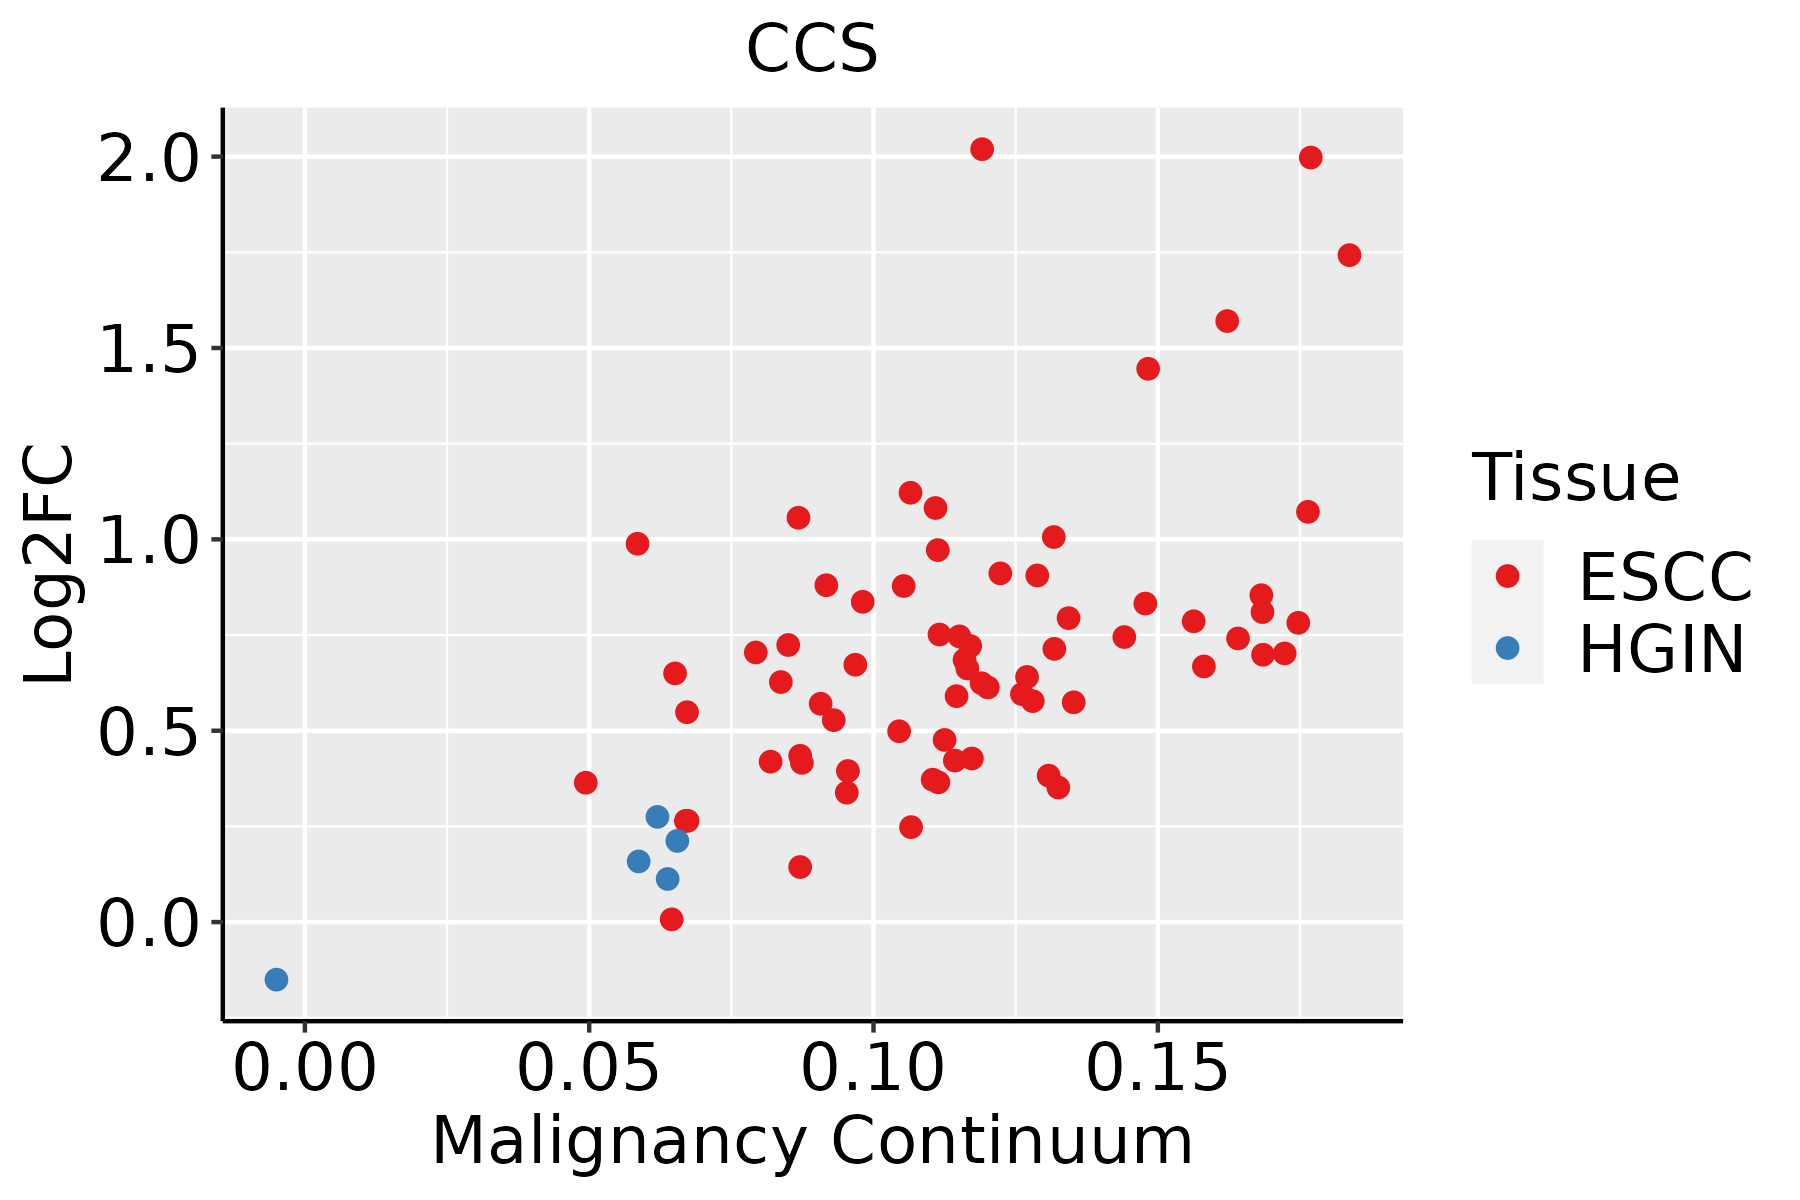 | ESCC: Esophageal squamous cell carcinoma |
| HGIN: High-grade intraepithelial neoplasias | ||
| LGIN: Low-grade intraepithelial neoplasias | ||
| Liver | 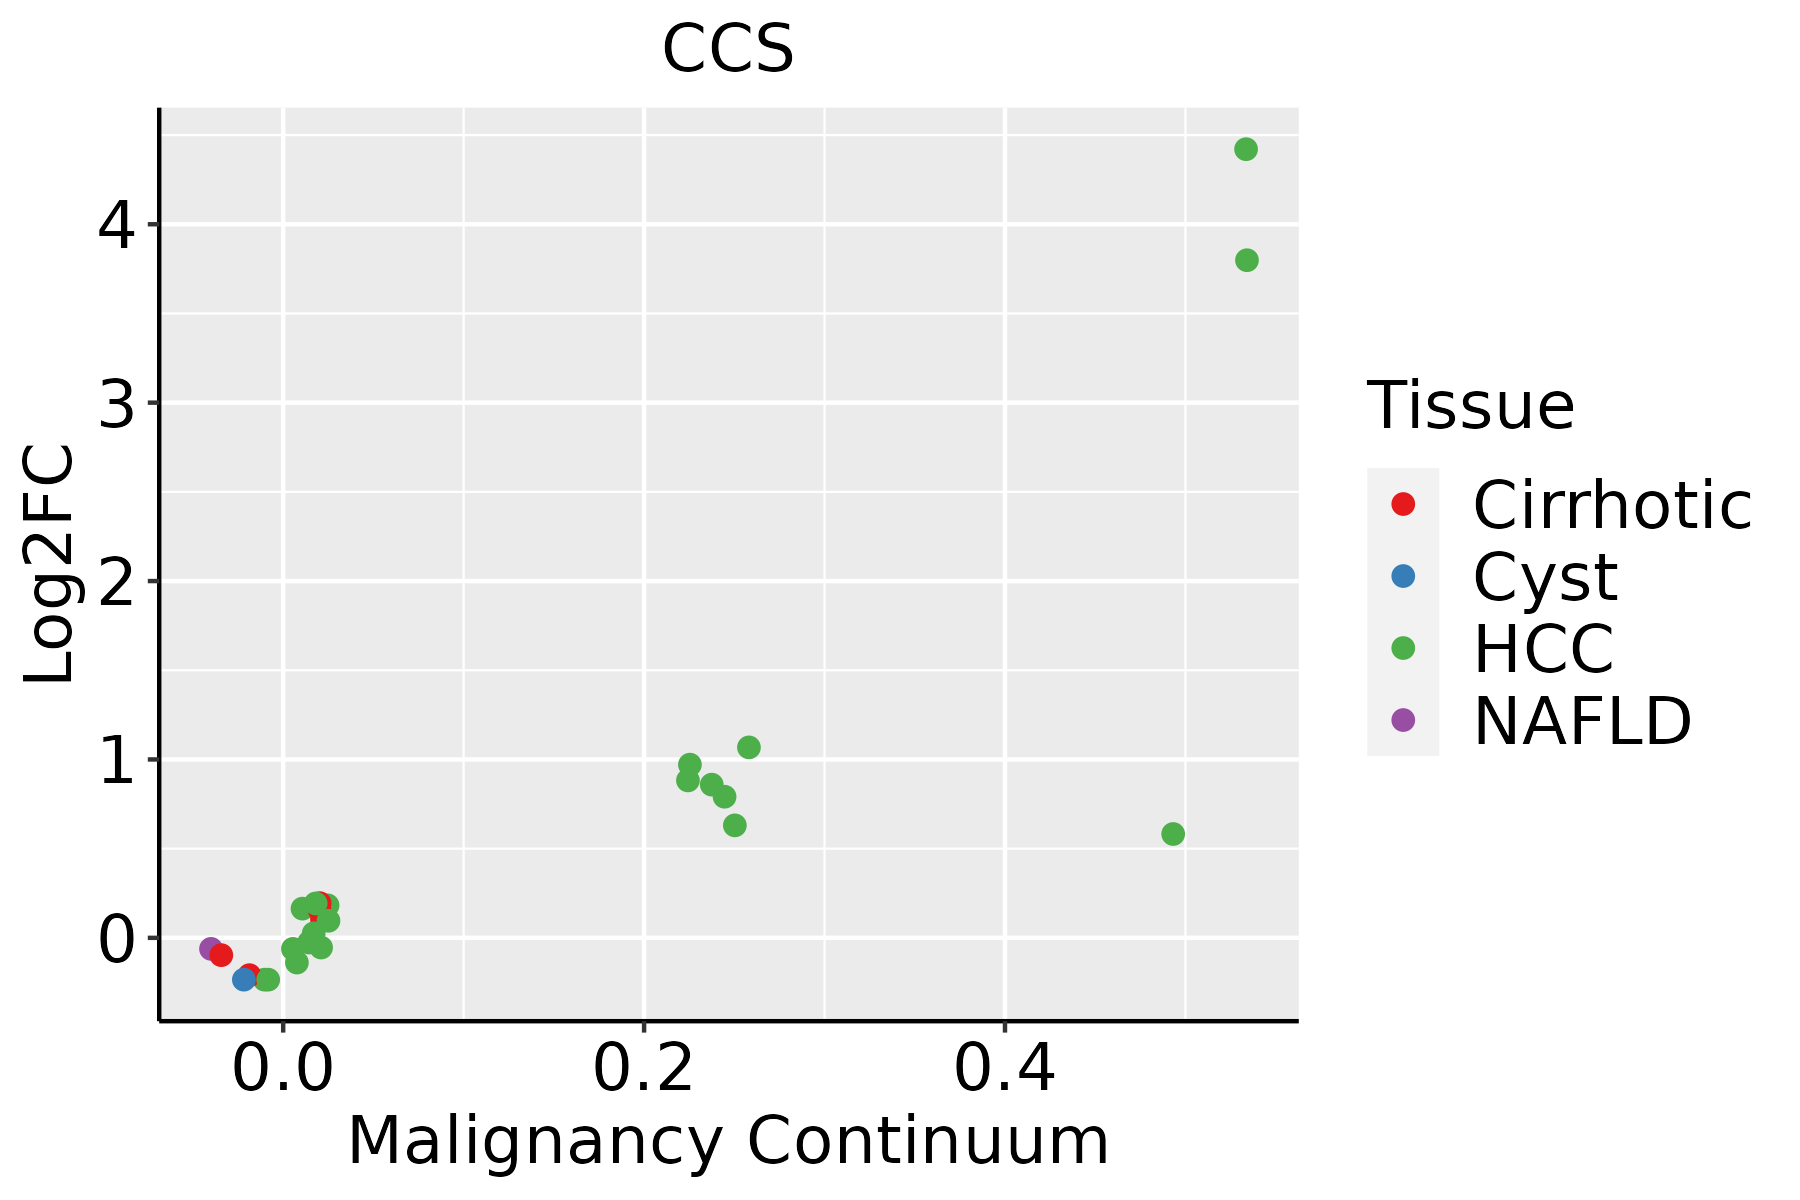 | HCC: Hepatocellular carcinoma |
| NAFLD: Non-alcoholic fatty liver disease | ||
| Oral Cavity | 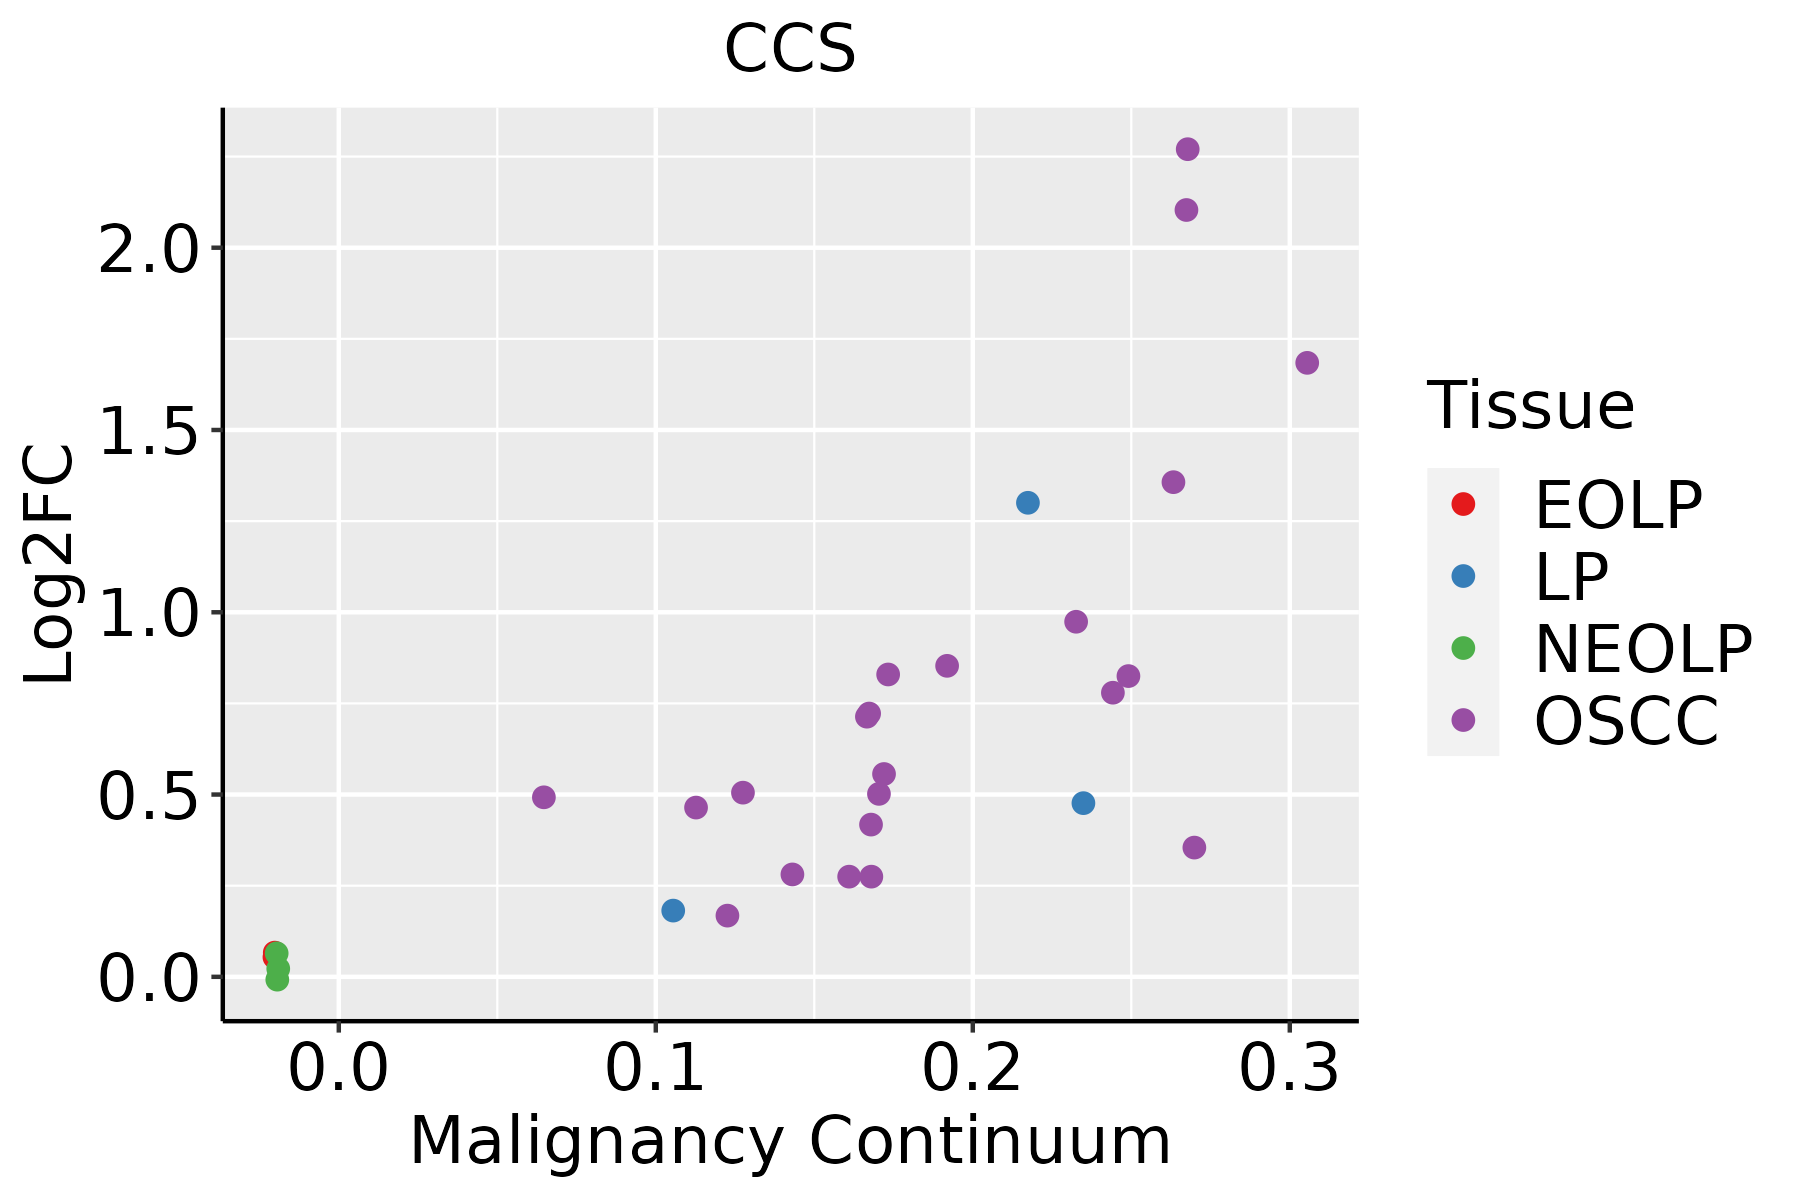 | EOLP: Erosive Oral lichen planus |
| LP: leukoplakia | ||
| NEOLP: Non-erosive oral lichen planus | ||
| OSCC: Oral squamous cell carcinoma | ||
| Skin | 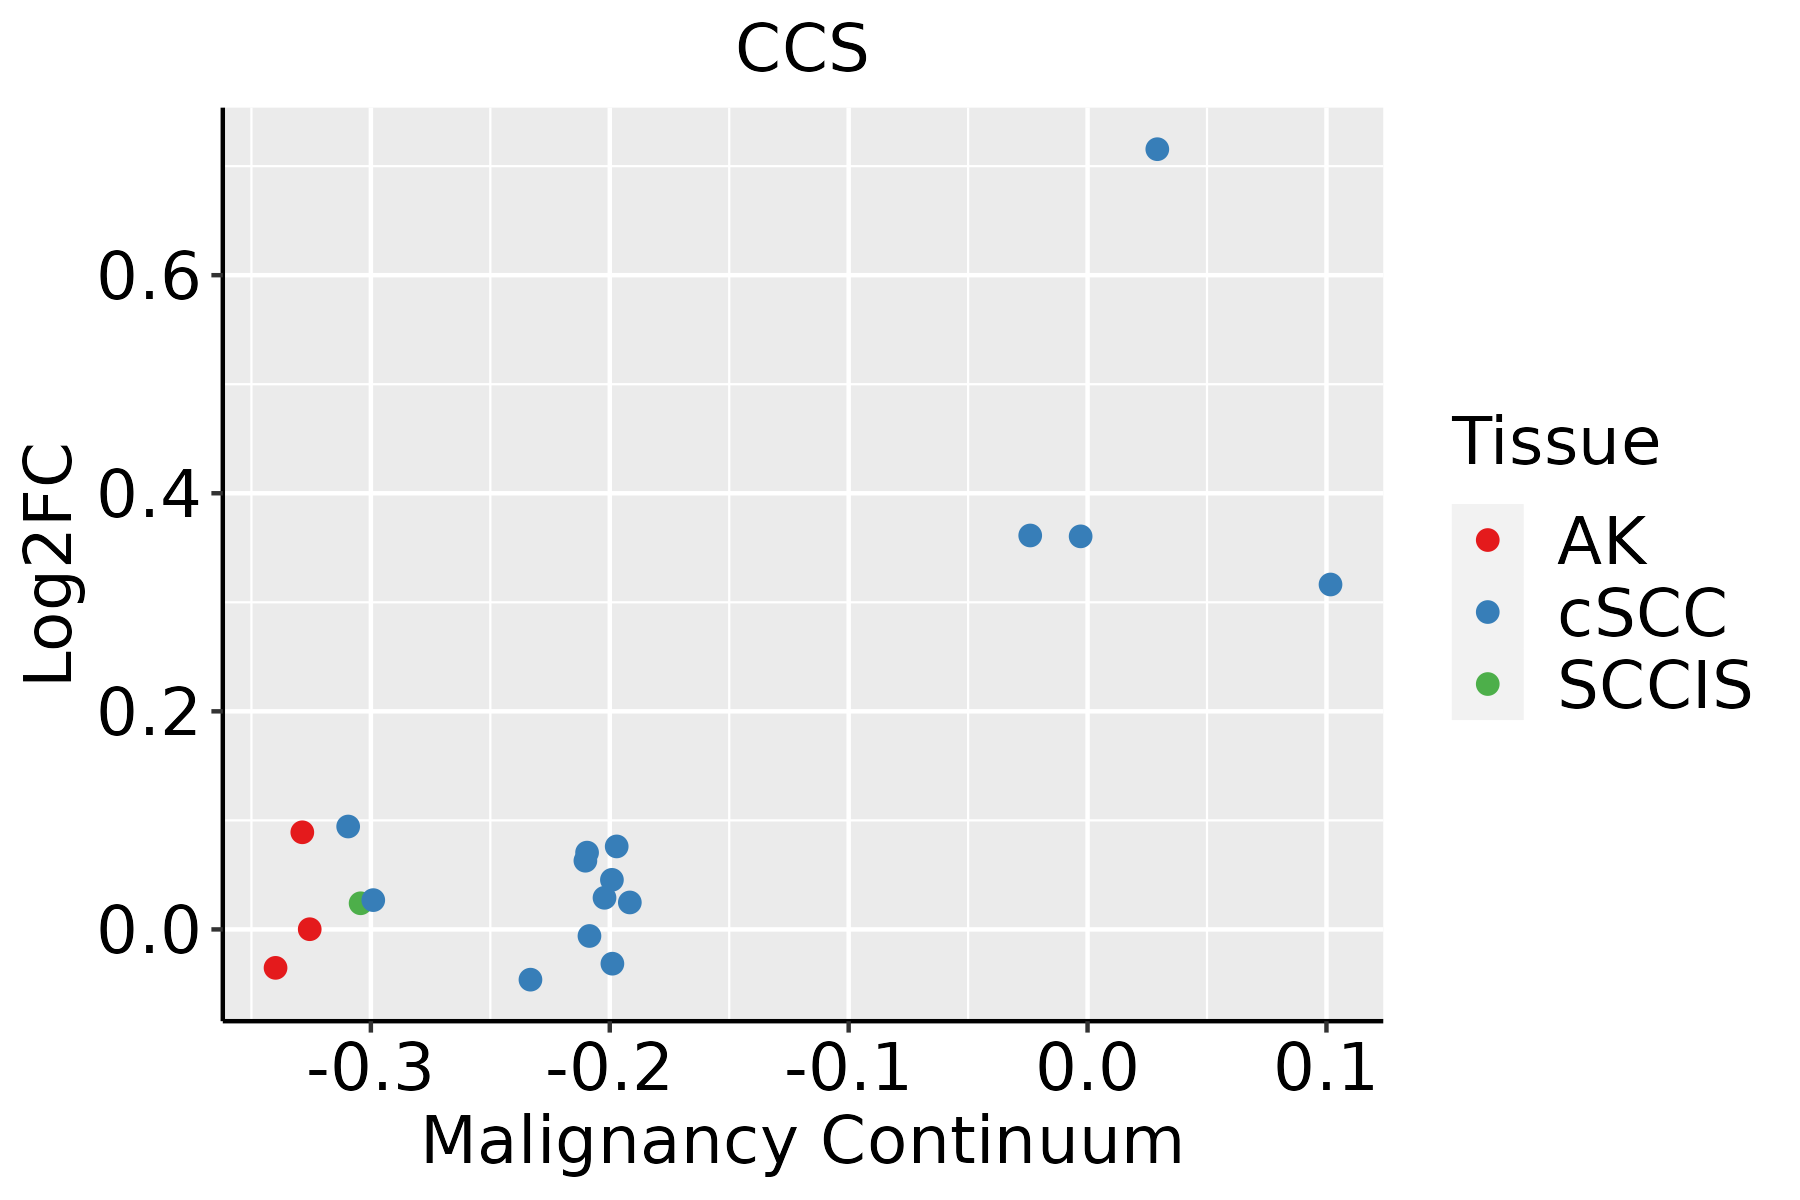 | AK: Actinic keratosis |
| cSCC: Cutaneous squamous cell carcinoma | ||
| SCCIS:squamous cell carcinoma in situ | ||
| Thyroid |  | ATC: Anaplastic thyroid cancer |
| HT: Hashimoto's thyroiditis | ||
| PTC: Papillary thyroid cancer |
| ∗log2FC in expression of this searched gene in stem-like cells from each diseased tissue sample relative to stem-like cells in normal samples in each tissue plotted against the malignancy continuum. Samples are colored based on if they are from different disease stage. |
Top |
Malignant transformation related pathway analysis |
| Find out the enriched GO biological processes and KEGG pathways involved in transition from healthy to precancer to cancer |
| Tissue | Disease Stage | Enriched GO biological Processes |
| Colorectum | AD |  |
| Colorectum | SER |  |
| Colorectum | MSS |  |
| Colorectum | MSI-H |  |
| Colorectum | FAP |  |
| ∗Top 15 enriched GO BP terms are showed in the bar plot of each disease state in each tissue. Each row represents a significant GO biological process which is colored according to the -log10(p.adjust). |
| Page: 1 2 3 4 5 6 7 8 9 |
| GO ID | Tissue | Disease Stage | Description | Gene Ratio | Bg Ratio | pvalue | p.adjust | Count |
| GO:00725937 | Liver | Cirrhotic | reactive oxygen species metabolic process | 92/4634 | 239/18723 | 1.57e-06 | 3.03e-05 | 92 |
| GO:0017004 | Liver | Cirrhotic | cytochrome complex assembly | 22/4634 | 36/18723 | 3.92e-06 | 6.70e-05 | 22 |
| GO:00987547 | Liver | Cirrhotic | detoxification | 60/4634 | 152/18723 | 4.09e-05 | 4.86e-04 | 60 |
| GO:00972377 | Liver | Cirrhotic | cellular response to toxic substance | 50/4634 | 124/18723 | 9.20e-05 | 9.79e-04 | 50 |
| GO:19907487 | Liver | Cirrhotic | cellular detoxification | 47/4634 | 116/18723 | 1.28e-04 | 1.26e-03 | 47 |
| GO:00988697 | Liver | Cirrhotic | cellular oxidant detoxification | 38/4634 | 101/18723 | 2.72e-03 | 1.59e-02 | 38 |
| GO:000697922 | Liver | HCC | response to oxidative stress | 281/7958 | 446/18723 | 9.75e-19 | 1.24e-16 | 281 |
| GO:006219722 | Liver | HCC | cellular response to chemical stress | 216/7958 | 337/18723 | 6.86e-16 | 5.44e-14 | 216 |
| GO:003459922 | Liver | HCC | cellular response to oxidative stress | 183/7958 | 288/18723 | 3.65e-13 | 1.93e-11 | 183 |
| GO:000030222 | Liver | HCC | response to reactive oxygen species | 144/7958 | 222/18723 | 1.24e-11 | 5.09e-10 | 144 |
| GO:003461412 | Liver | HCC | cellular response to reactive oxygen species | 102/7958 | 155/18723 | 3.70e-09 | 9.89e-08 | 102 |
| GO:005160412 | Liver | HCC | protein maturation | 171/7958 | 294/18723 | 3.80e-08 | 8.30e-07 | 171 |
| GO:000963622 | Liver | HCC | response to toxic substance | 153/7958 | 262/18723 | 1.37e-07 | 2.58e-06 | 153 |
| GO:00170041 | Liver | HCC | cytochrome complex assembly | 30/7958 | 36/18723 | 5.69e-07 | 9.03e-06 | 30 |
| GO:199074812 | Liver | HCC | cellular detoxification | 70/7958 | 116/18723 | 7.87e-05 | 7.02e-04 | 70 |
| GO:009723712 | Liver | HCC | cellular response to toxic substance | 74/7958 | 124/18723 | 8.36e-05 | 7.36e-04 | 74 |
| GO:009875412 | Liver | HCC | detoxification | 87/7958 | 152/18723 | 1.70e-04 | 1.35e-03 | 87 |
| GO:009886912 | Liver | HCC | cellular oxidant detoxification | 59/7958 | 101/18723 | 9.00e-04 | 5.31e-03 | 59 |
| GO:007259312 | Liver | HCC | reactive oxygen species metabolic process | 124/7958 | 239/18723 | 2.05e-03 | 1.04e-02 | 124 |
| GO:000697920 | Oral cavity | OSCC | response to oxidative stress | 273/7305 | 446/18723 | 8.35e-22 | 1.65e-19 | 273 |
| Page: 1 2 3 4 5 6 |
| Pathway ID | Tissue | Disease Stage | Description | Gene Ratio | Bg Ratio | pvalue | p.adjust | qvalue | Count |
| hsa05014210 | Esophagus | ESCC | Amyotrophic lateral sclerosis | 266/4205 | 364/8465 | 1.31e-20 | 2.20e-18 | 1.13e-18 | 266 |
| hsa05022210 | Esophagus | ESCC | Pathways of neurodegeneration - multiple diseases | 318/4205 | 476/8465 | 6.10e-15 | 2.04e-13 | 1.05e-13 | 318 |
| hsa0501438 | Esophagus | ESCC | Amyotrophic lateral sclerosis | 266/4205 | 364/8465 | 1.31e-20 | 2.20e-18 | 1.13e-18 | 266 |
| hsa0502238 | Esophagus | ESCC | Pathways of neurodegeneration - multiple diseases | 318/4205 | 476/8465 | 6.10e-15 | 2.04e-13 | 1.05e-13 | 318 |
| hsa0501414 | Liver | Cirrhotic | Amyotrophic lateral sclerosis | 187/2530 | 364/8465 | 1.56e-18 | 6.50e-17 | 4.01e-17 | 187 |
| hsa0502214 | Liver | Cirrhotic | Pathways of neurodegeneration - multiple diseases | 217/2530 | 476/8465 | 7.30e-14 | 2.03e-12 | 1.25e-12 | 217 |
| hsa0501415 | Liver | Cirrhotic | Amyotrophic lateral sclerosis | 187/2530 | 364/8465 | 1.56e-18 | 6.50e-17 | 4.01e-17 | 187 |
| hsa0502215 | Liver | Cirrhotic | Pathways of neurodegeneration - multiple diseases | 217/2530 | 476/8465 | 7.30e-14 | 2.03e-12 | 1.25e-12 | 217 |
| hsa0501422 | Liver | HCC | Amyotrophic lateral sclerosis | 252/4020 | 364/8465 | 8.85e-18 | 7.41e-16 | 4.12e-16 | 252 |
| hsa0502222 | Liver | HCC | Pathways of neurodegeneration - multiple diseases | 298/4020 | 476/8465 | 6.59e-12 | 1.30e-10 | 7.22e-11 | 298 |
| hsa0501432 | Liver | HCC | Amyotrophic lateral sclerosis | 252/4020 | 364/8465 | 8.85e-18 | 7.41e-16 | 4.12e-16 | 252 |
| hsa0502232 | Liver | HCC | Pathways of neurodegeneration - multiple diseases | 298/4020 | 476/8465 | 6.59e-12 | 1.30e-10 | 7.22e-11 | 298 |
| hsa0501428 | Oral cavity | OSCC | Amyotrophic lateral sclerosis | 246/3704 | 364/8465 | 6.65e-21 | 1.11e-18 | 5.67e-19 | 246 |
| hsa0502228 | Oral cavity | OSCC | Pathways of neurodegeneration - multiple diseases | 292/3704 | 476/8465 | 1.60e-15 | 4.47e-14 | 2.28e-14 | 292 |
| hsa05014112 | Oral cavity | OSCC | Amyotrophic lateral sclerosis | 246/3704 | 364/8465 | 6.65e-21 | 1.11e-18 | 5.67e-19 | 246 |
| hsa05022112 | Oral cavity | OSCC | Pathways of neurodegeneration - multiple diseases | 292/3704 | 476/8465 | 1.60e-15 | 4.47e-14 | 2.28e-14 | 292 |
| hsa0501429 | Oral cavity | LP | Amyotrophic lateral sclerosis | 197/2418 | 364/8465 | 1.25e-25 | 1.39e-23 | 8.93e-24 | 197 |
| hsa0502229 | Oral cavity | LP | Pathways of neurodegeneration - multiple diseases | 232/2418 | 476/8465 | 7.77e-22 | 3.69e-20 | 2.38e-20 | 232 |
| hsa0501437 | Oral cavity | LP | Amyotrophic lateral sclerosis | 197/2418 | 364/8465 | 1.25e-25 | 1.39e-23 | 8.93e-24 | 197 |
| hsa0502237 | Oral cavity | LP | Pathways of neurodegeneration - multiple diseases | 232/2418 | 476/8465 | 7.77e-22 | 3.69e-20 | 2.38e-20 | 232 |
| Page: 1 |
Top |
Cell-cell communication analysis |
| Identification of potential cell-cell interactions between two cell types and their ligand-receptor pairs for different disease states |
| Ligand | Receptor | LRpair | Pathway | Tissue | Disease Stage |
| Page: 1 |
Top |
Single-cell gene regulatory network inference analysis |
| Find out the significant the regulons (TFs) and the target genes of each regulon across cell types for different disease states |
| TF | Cell Type | Tissue | Disease Stage | Target Gene | RSS | Regulon Activity |
| ∗The dot plots of a searched regulon are shown for all cell subpopulations in each disease state of each tissue based on the regulon specific score inferred using pySCENIC and by calculating the average expression. |
| Page: 1 |
Top |
Somatic mutation of malignant transformation related genes |
| Annotation of somatic variants for genes involved in malignant transformation |
| Hugo Symbol | Variant Class | Variant Classification | dbSNP RS | HGVSc | HGVSp | HGVSp Short | SWISSPROT | BIOTYPE | SIFT | PolyPhen | Tumor Sample Barcode | Tissue | Histology | Sex | Age | Stage | Therapy Types | Drugs | Outcome |
| CCS | SNV | Missense_Mutation | c.613N>T | p.Asp205Tyr | p.D205Y | O14618 | protein_coding | deleterious(0.03) | probably_damaging(0.999) | TCGA-D8-A1J9-01 | Breast | breast invasive carcinoma | Female | <65 | I/II | Unknown | Unknown | SD | |
| CCS | insertion | Frame_Shift_Ins | novel | c.589_590insCTCCATCTCAACAAAACAAAACAAAACAAAACAAAACAAAAGTT | p.Ser197ThrfsTer17 | p.S197Tfs*17 | O14618 | protein_coding | TCGA-AN-A03X-01 | Breast | breast invasive carcinoma | Female | >=65 | I/II | Unknown | Unknown | SD | ||
| CCS | SNV | Missense_Mutation | c.571N>C | p.Trp191Arg | p.W191R | O14618 | protein_coding | tolerated(0.08) | benign(0.354) | TCGA-AA-A010-01 | Colorectum | colon adenocarcinoma | Female | <65 | I/II | Chemotherapy | folinic | CR | |
| CCS | SNV | Missense_Mutation | c.407N>G | p.Asp136Gly | p.D136G | O14618 | protein_coding | deleterious(0) | probably_damaging(0.999) | TCGA-AU-6004-01 | Colorectum | colon adenocarcinoma | Female | >=65 | I/II | Unknown | Unknown | SD | |
| CCS | SNV | Missense_Mutation | c.779N>T | p.Ala260Val | p.A260V | O14618 | protein_coding | deleterious(0.02) | benign(0.141) | TCGA-NH-A5IV-01 | Colorectum | colon adenocarcinoma | Female | >=65 | I/II | Unknown | Unknown | SD | |
| CCS | insertion | Frame_Shift_Ins | rs759691599 | c.278_279insG | p.Pro96AlafsTer16 | p.P96Afs*16 | O14618 | protein_coding | TCGA-CM-4743-01 | Colorectum | colon adenocarcinoma | Male | >=65 | I/II | Chemotherapy | capecitabine | SD | ||
| CCS | SNV | Missense_Mutation | novel | c.141N>T | p.Glu47Asp | p.E47D | O14618 | protein_coding | tolerated(0.43) | benign(0.02) | TCGA-A5-A0G2-01 | Endometrium | uterine corpus endometrioid carcinoma | Female | <65 | III/IV | Unknown | Unknown | SD |
| CCS | SNV | Missense_Mutation | rs776789603 | c.334N>T | p.Arg112Cys | p.R112C | O14618 | protein_coding | tolerated(0.07) | benign(0.02) | TCGA-AX-A1CE-01 | Endometrium | uterine corpus endometrioid carcinoma | Female | <65 | I/II | Unspecific | Paclitaxel | SD |
| CCS | SNV | Missense_Mutation | novel | c.648N>T | p.Lys216Asn | p.K216N | O14618 | protein_coding | deleterious(0.02) | benign(0.364) | TCGA-B5-A3FC-01 | Endometrium | uterine corpus endometrioid carcinoma | Female | <65 | I/II | Unknown | Unknown | SD |
| CCS | SNV | Missense_Mutation | rs765752116 | c.590G>C | p.Ser197Thr | p.S197T | O14618 | protein_coding | deleterious(0) | possibly_damaging(0.855) | TCGA-D1-A103-01 | Endometrium | uterine corpus endometrioid carcinoma | Female | >=65 | I/II | Unknown | Unknown | SD |
| Page: 1 2 3 |
Top |
Related drugs of malignant transformation related genes |
| Identification of chemicals and drugs interact with genes involved in malignant transfromation |
| (DGIdb 4.0) |
| Entrez ID | Symbol | Category | Interaction Types | Drug Claim Name | Drug Name | PMIDs |
| Page: 1 |

Copyright 2023-Present -The University of Texas Health Science Center at Houston |