
|
|||||
|
 | |
| |
| |
| |
| |
| |
|
Gene: CCNT2 |
Gene summary for CCNT2 |
| Gene information | Species | Human | Gene symbol | CCNT2 | Gene ID | 905 |
| Gene name | cyclin T2 | |
| Gene Alias | CYCT2 | |
| Cytomap | 2q21.3 | |
| Gene Type | protein-coding | GO ID | GO:0000079 | UniProtAcc | B4DH21 |
Top |
Malignant transformation analysis |
| Identification of the aberrant gene expression in precancerous and cancerous lesions by comparing the gene expression of stem-like cells in diseased tissues with normal stem cells |
| Entrez ID | Symbol | Replicates | Species | Organ | Tissue | Adj P-value | Log2FC | Malignancy |
| 905 | CCNT2 | HTA11_3410_2000001011 | Human | Colorectum | AD | 8.46e-12 | -4.51e-01 | 0.0155 |
| 905 | CCNT2 | HTA11_2487_2000001011 | Human | Colorectum | SER | 3.43e-05 | -4.33e-01 | -0.1808 |
| 905 | CCNT2 | HTA11_2951_2000001011 | Human | Colorectum | AD | 2.86e-02 | -5.11e-01 | 0.0216 |
| 905 | CCNT2 | HTA11_3361_2000001011 | Human | Colorectum | AD | 7.46e-04 | -4.37e-01 | -0.1207 |
| 905 | CCNT2 | HTA11_696_2000001011 | Human | Colorectum | AD | 2.48e-11 | -3.81e-01 | -0.1464 |
| 905 | CCNT2 | HTA11_866_2000001011 | Human | Colorectum | AD | 2.18e-08 | -3.35e-01 | -0.1001 |
| 905 | CCNT2 | HTA11_1391_2000001011 | Human | Colorectum | AD | 3.36e-04 | -3.68e-01 | -0.059 |
| 905 | CCNT2 | HTA11_866_3004761011 | Human | Colorectum | AD | 5.61e-08 | -4.23e-01 | 0.096 |
| 905 | CCNT2 | HTA11_8622_2000001021 | Human | Colorectum | SER | 2.28e-04 | -5.11e-01 | 0.0528 |
| 905 | CCNT2 | HTA11_10711_2000001011 | Human | Colorectum | AD | 5.74e-05 | -4.37e-01 | 0.0338 |
| 905 | CCNT2 | HTA11_7696_3000711011 | Human | Colorectum | AD | 4.55e-11 | -3.75e-01 | 0.0674 |
| 905 | CCNT2 | HTA11_6818_2000001021 | Human | Colorectum | AD | 8.39e-03 | -4.17e-01 | 0.0588 |
| 905 | CCNT2 | HTA11_99999970781_79442 | Human | Colorectum | MSS | 3.83e-03 | -2.52e-01 | 0.294 |
| 905 | CCNT2 | HTA11_99999971662_82457 | Human | Colorectum | MSS | 1.96e-07 | -3.49e-01 | 0.3859 |
| 905 | CCNT2 | HTA11_99999973899_84307 | Human | Colorectum | MSS | 1.83e-03 | -4.63e-01 | 0.2585 |
| 905 | CCNT2 | HTA11_99999974143_84620 | Human | Colorectum | MSS | 1.52e-11 | -3.99e-01 | 0.3005 |
| 905 | CCNT2 | A001-C-207 | Human | Colorectum | FAP | 7.59e-04 | -2.82e-01 | 0.1278 |
| 905 | CCNT2 | A015-C-203 | Human | Colorectum | FAP | 3.70e-21 | -3.46e-01 | -0.1294 |
| 905 | CCNT2 | A015-C-204 | Human | Colorectum | FAP | 7.93e-03 | -2.19e-01 | -0.0228 |
| 905 | CCNT2 | A014-C-040 | Human | Colorectum | FAP | 3.09e-04 | -4.60e-01 | -0.1184 |
| Page: 1 2 3 4 5 6 7 |
| Tissue | Expression Dynamics | Abbreviation |
| Colorectum (GSE201348) |  | FAP: Familial adenomatous polyposis |
| CRC: Colorectal cancer | ||
| Colorectum (HTA11) | 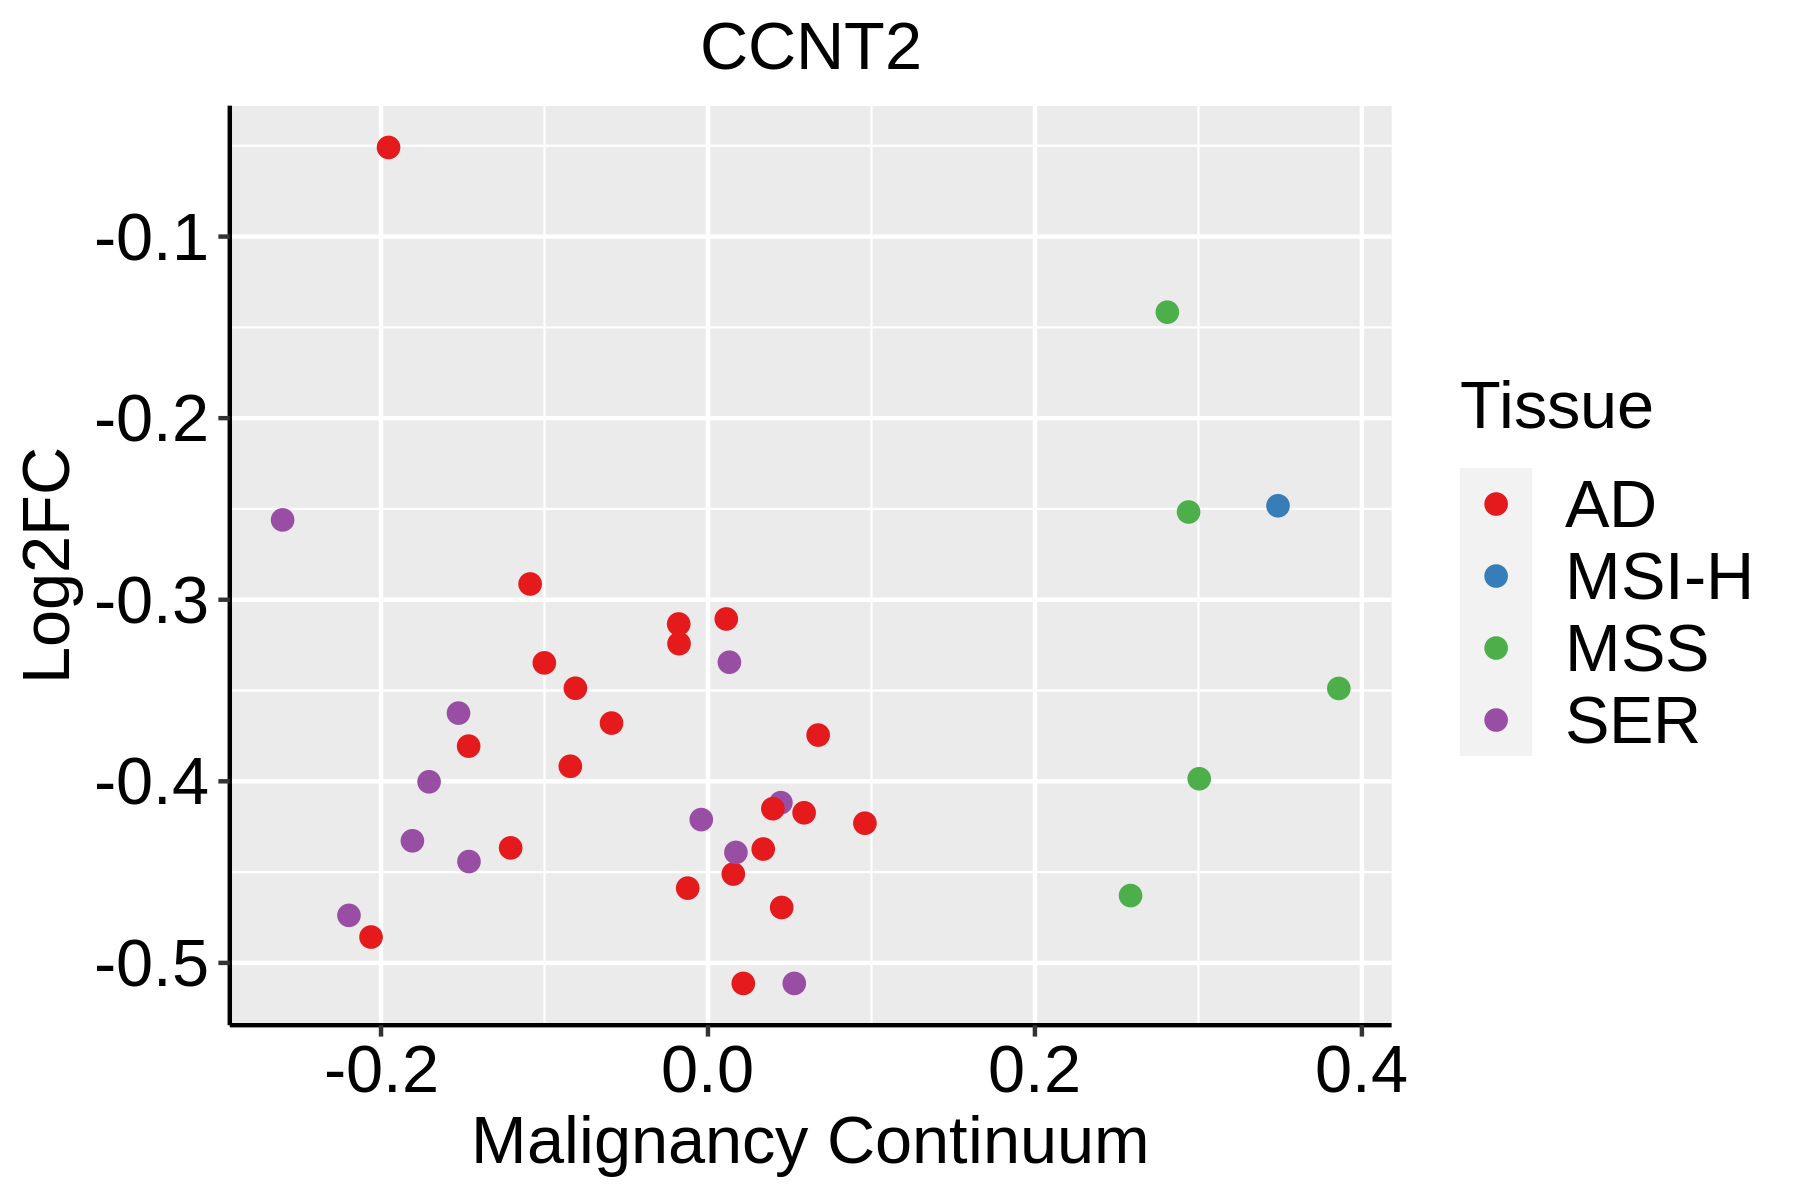 | AD: Adenomas |
| SER: Sessile serrated lesions | ||
| MSI-H: Microsatellite-high colorectal cancer | ||
| MSS: Microsatellite stable colorectal cancer | ||
| Esophagus | 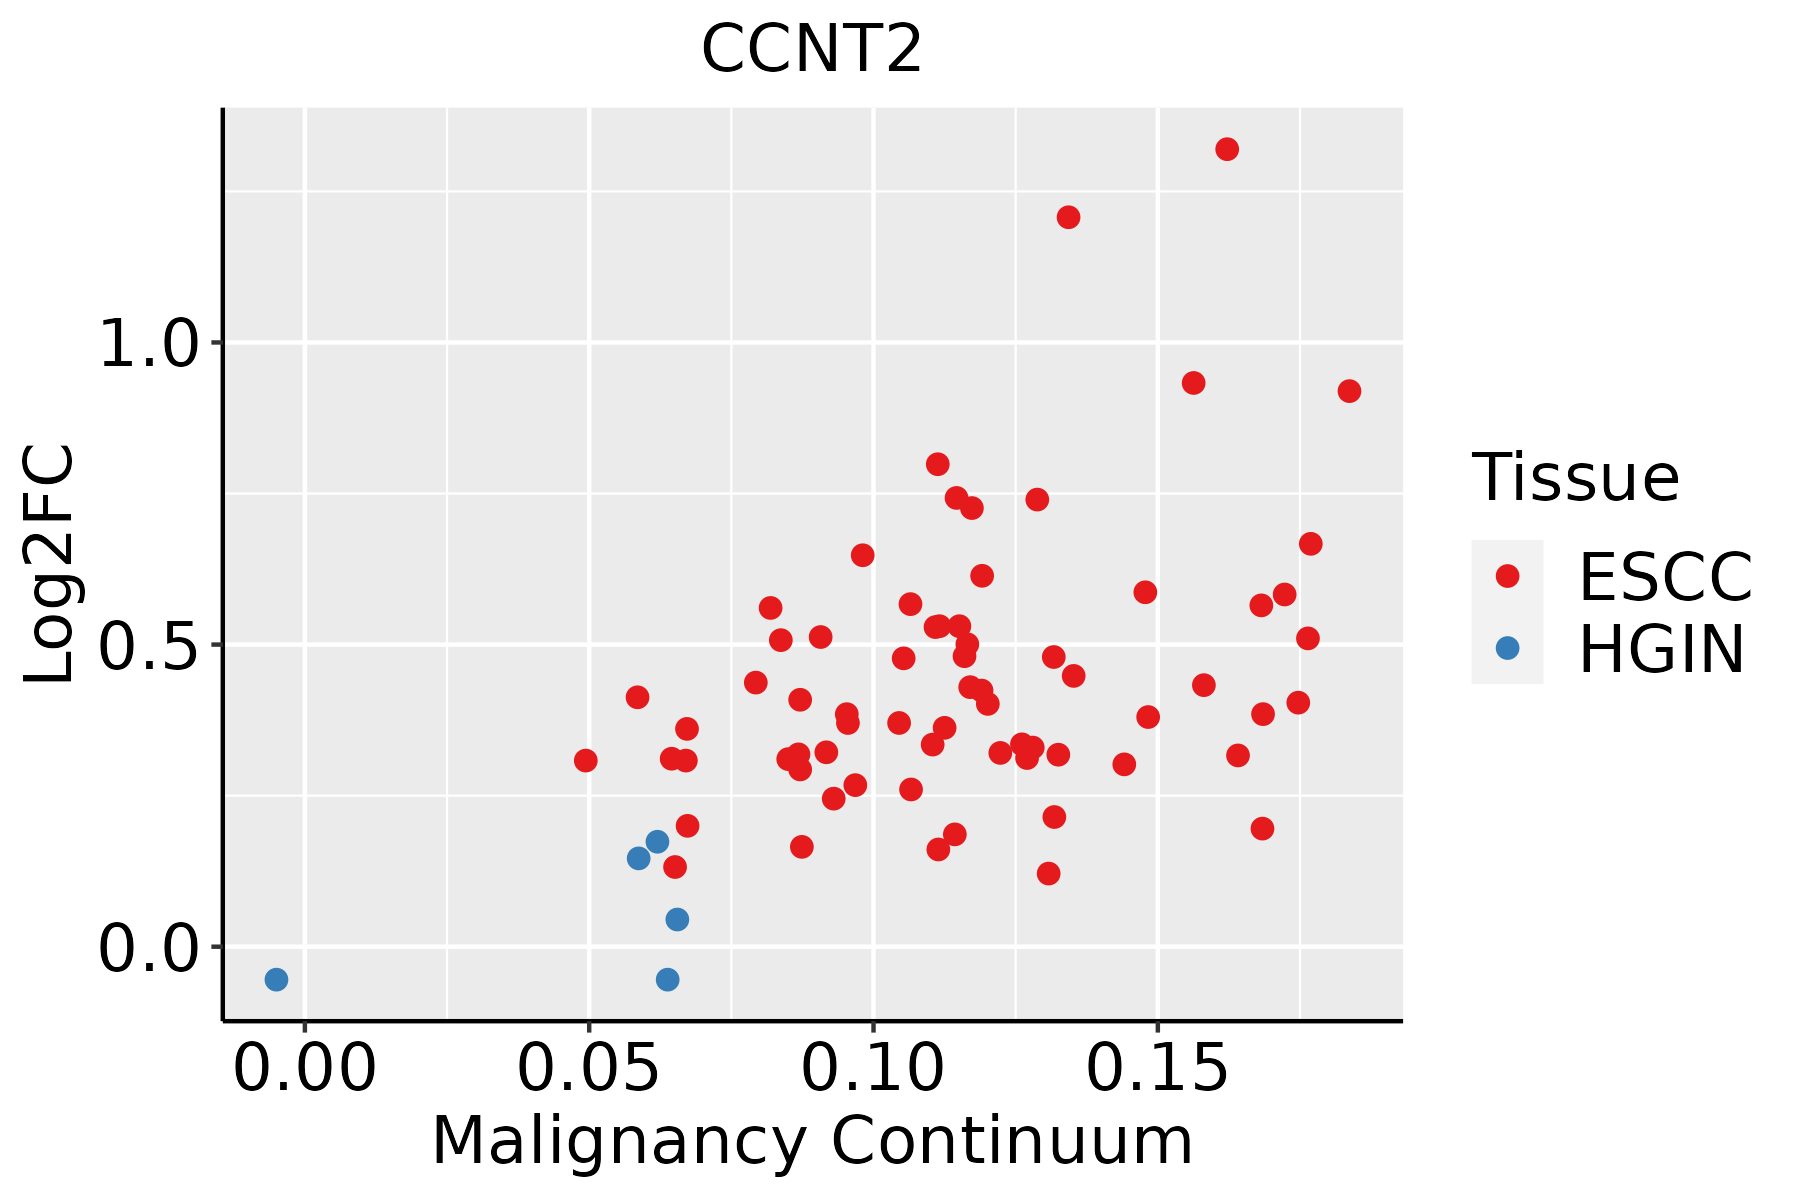 | ESCC: Esophageal squamous cell carcinoma |
| HGIN: High-grade intraepithelial neoplasias | ||
| LGIN: Low-grade intraepithelial neoplasias | ||
| Liver | 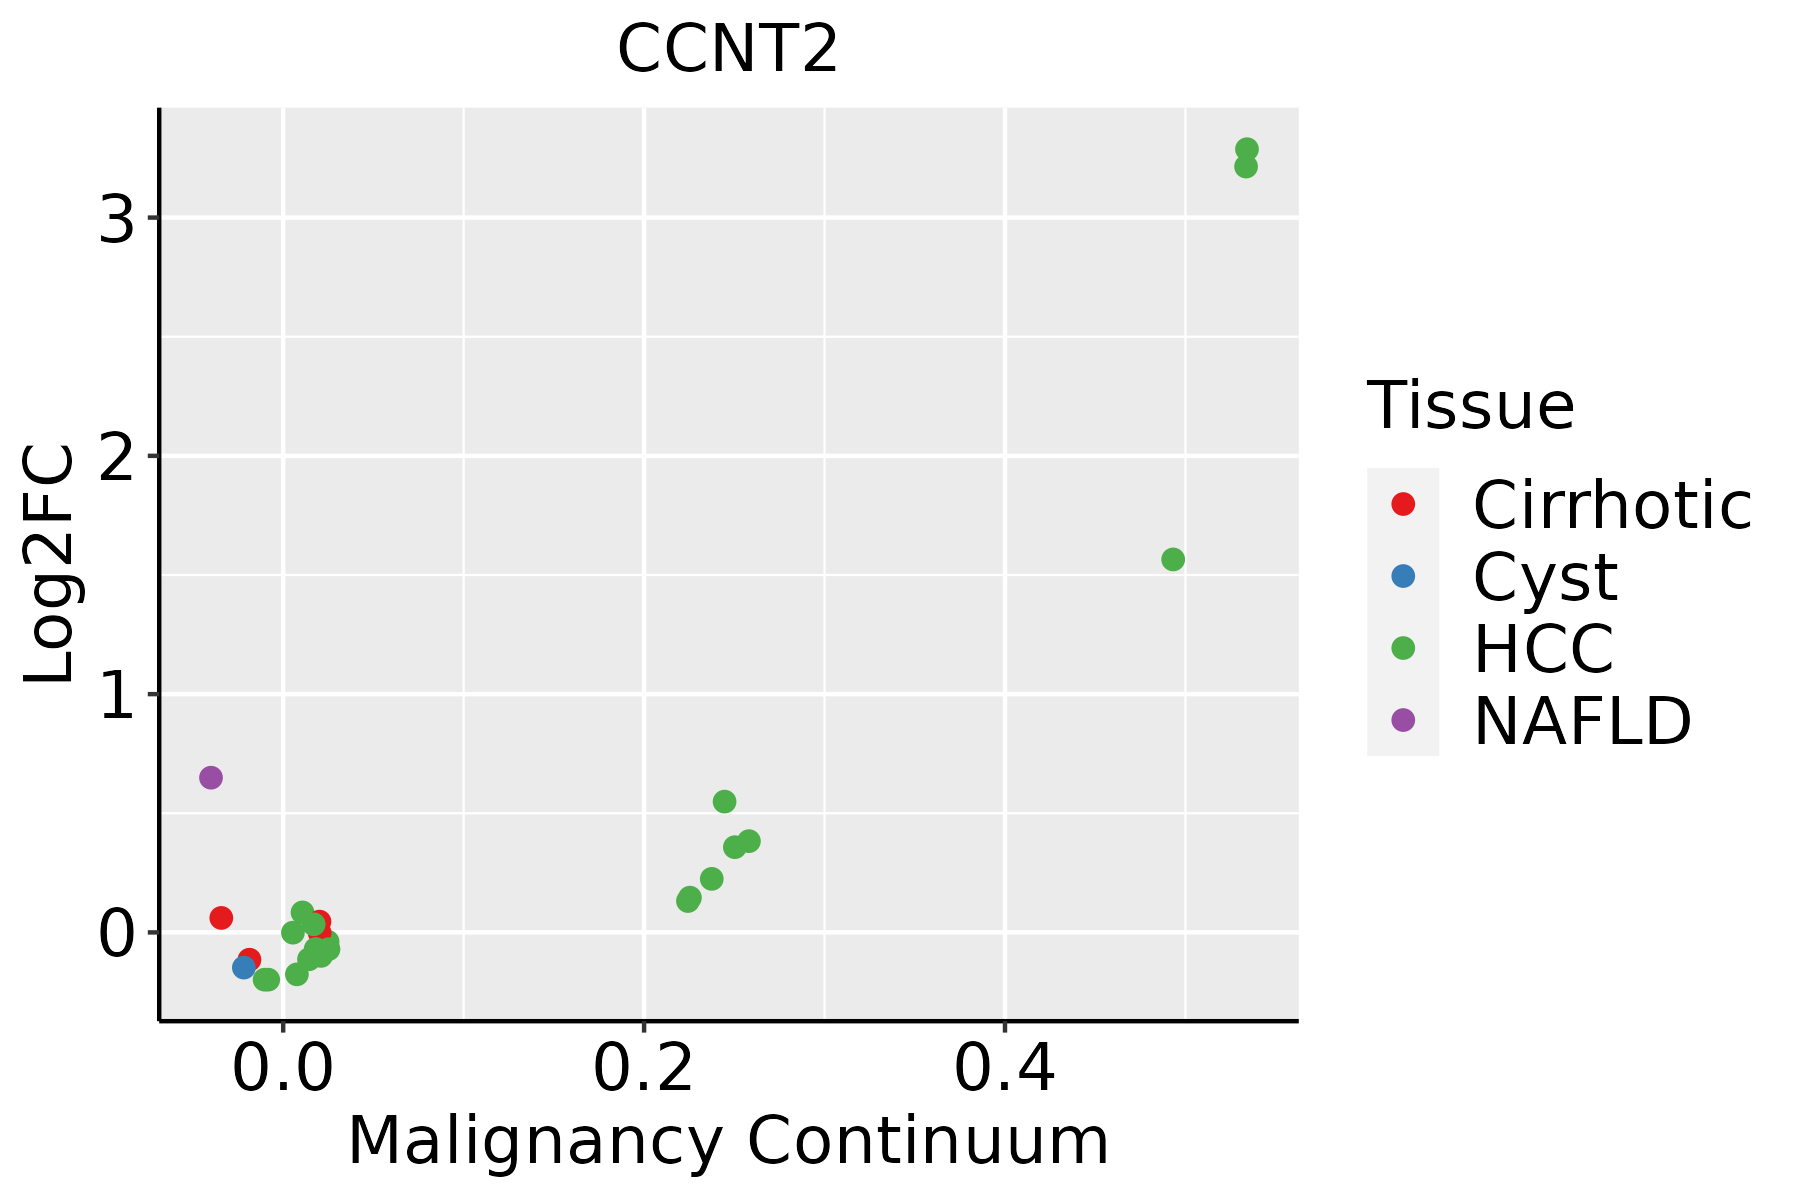 | HCC: Hepatocellular carcinoma |
| NAFLD: Non-alcoholic fatty liver disease | ||
| Thyroid |  | ATC: Anaplastic thyroid cancer |
| HT: Hashimoto's thyroiditis | ||
| PTC: Papillary thyroid cancer |
| ∗log2FC in expression of this searched gene in stem-like cells from each diseased tissue sample relative to stem-like cells in normal samples in each tissue plotted against the malignancy continuum. Samples are colored based on if they are from different disease stage. |
Top |
Malignant transformation related pathway analysis |
| Find out the enriched GO biological processes and KEGG pathways involved in transition from healthy to precancer to cancer |
| Tissue | Disease Stage | Enriched GO biological Processes |
| Colorectum | AD |  |
| Colorectum | SER |  |
| Colorectum | MSS |  |
| Colorectum | MSI-H |  |
| Colorectum | FAP |  |
| ∗Top 15 enriched GO BP terms are showed in the bar plot of each disease state in each tissue. Each row represents a significant GO biological process which is colored according to the -log10(p.adjust). |
| Page: 1 2 3 4 5 6 7 8 9 |
| GO ID | Tissue | Disease Stage | Description | Gene Ratio | Bg Ratio | pvalue | p.adjust | Count |
| GO:00457871 | Colorectum | MSS | positive regulation of cell cycle | 80/3467 | 313/18723 | 1.15e-03 | 1.12e-02 | 80 |
| GO:00063541 | Colorectum | MSS | DNA-templated transcription, elongation | 29/3467 | 91/18723 | 1.52e-03 | 1.39e-02 | 29 |
| GO:00327861 | Colorectum | MSS | positive regulation of DNA-templated transcription, elongation | 12/3467 | 27/18723 | 1.74e-03 | 1.55e-02 | 12 |
| GO:00160324 | Colorectum | FAP | viral process | 114/2622 | 415/18723 | 3.00e-13 | 2.63e-10 | 114 |
| GO:00190804 | Colorectum | FAP | viral gene expression | 29/2622 | 94/18723 | 2.07e-05 | 5.05e-04 | 29 |
| GO:00719003 | Colorectum | FAP | regulation of protein serine/threonine kinase activity | 78/2622 | 359/18723 | 3.99e-05 | 8.48e-04 | 78 |
| GO:00457872 | Colorectum | FAP | positive regulation of cell cycle | 66/2622 | 313/18723 | 3.66e-04 | 4.63e-03 | 66 |
| GO:00327862 | Colorectum | FAP | positive regulation of DNA-templated transcription, elongation | 11/2622 | 27/18723 | 5.93e-04 | 6.58e-03 | 11 |
| GO:00458604 | Colorectum | FAP | positive regulation of protein kinase activity | 77/2622 | 386/18723 | 7.31e-04 | 7.81e-03 | 77 |
| GO:00719022 | Colorectum | FAP | positive regulation of protein serine/threonine kinase activity | 45/2622 | 200/18723 | 7.36e-04 | 7.83e-03 | 45 |
| GO:00063542 | Colorectum | FAP | DNA-templated transcription, elongation | 24/2622 | 91/18723 | 1.32e-03 | 1.22e-02 | 24 |
| GO:00336744 | Colorectum | FAP | positive regulation of kinase activity | 89/2622 | 467/18723 | 1.33e-03 | 1.22e-02 | 89 |
| GO:00160325 | Colorectum | CRC | viral process | 95/2078 | 415/18723 | 3.31e-12 | 3.30e-09 | 95 |
| GO:00190805 | Colorectum | CRC | viral gene expression | 26/2078 | 94/18723 | 7.43e-06 | 2.72e-04 | 26 |
| GO:00719004 | Colorectum | CRC | regulation of protein serine/threonine kinase activity | 65/2078 | 359/18723 | 4.67e-05 | 1.10e-03 | 65 |
| GO:00458605 | Colorectum | CRC | positive regulation of protein kinase activity | 67/2078 | 386/18723 | 1.34e-04 | 2.55e-03 | 67 |
| GO:00336745 | Colorectum | CRC | positive regulation of kinase activity | 77/2078 | 467/18723 | 2.42e-04 | 4.00e-03 | 77 |
| GO:00719023 | Colorectum | CRC | positive regulation of protein serine/threonine kinase activity | 39/2078 | 200/18723 | 3.20e-04 | 4.95e-03 | 39 |
| GO:00457873 | Colorectum | CRC | positive regulation of cell cycle | 55/2078 | 313/18723 | 3.76e-04 | 5.57e-03 | 55 |
| GO:0060537 | Colorectum | CRC | muscle tissue development | 63/2078 | 403/18723 | 3.17e-03 | 2.78e-02 | 63 |
| Page: 1 2 3 4 5 6 |
| Pathway ID | Tissue | Disease Stage | Description | Gene Ratio | Bg Ratio | pvalue | p.adjust | qvalue | Count |
| hsa03250 | Colorectum | MSS | Viral life cycle - HIV-1 | 23/1875 | 63/8465 | 6.55e-03 | 2.64e-02 | 1.62e-02 | 23 |
| hsa032501 | Colorectum | MSS | Viral life cycle - HIV-1 | 23/1875 | 63/8465 | 6.55e-03 | 2.64e-02 | 1.62e-02 | 23 |
| hsa05202 | Colorectum | FAP | Transcriptional misregulation in cancer | 45/1404 | 193/8465 | 9.19e-03 | 3.33e-02 | 2.03e-02 | 45 |
| hsa052021 | Colorectum | FAP | Transcriptional misregulation in cancer | 45/1404 | 193/8465 | 9.19e-03 | 3.33e-02 | 2.03e-02 | 45 |
| hsa032509 | Esophagus | ESCC | Viral life cycle - HIV-1 | 54/4205 | 63/8465 | 2.01e-09 | 2.17e-08 | 1.11e-08 | 54 |
| hsa052028 | Esophagus | ESCC | Transcriptional misregulation in cancer | 116/4205 | 193/8465 | 2.08e-03 | 5.95e-03 | 3.05e-03 | 116 |
| hsa0325014 | Esophagus | ESCC | Viral life cycle - HIV-1 | 54/4205 | 63/8465 | 2.01e-09 | 2.17e-08 | 1.11e-08 | 54 |
| hsa0520213 | Esophagus | ESCC | Transcriptional misregulation in cancer | 116/4205 | 193/8465 | 2.08e-03 | 5.95e-03 | 3.05e-03 | 116 |
| hsa032502 | Liver | HCC | Viral life cycle - HIV-1 | 46/4020 | 63/8465 | 3.25e-05 | 1.88e-04 | 1.04e-04 | 46 |
| hsa0325011 | Liver | HCC | Viral life cycle - HIV-1 | 46/4020 | 63/8465 | 3.25e-05 | 1.88e-04 | 1.04e-04 | 46 |
| Page: 1 |
Top |
Cell-cell communication analysis |
| Identification of potential cell-cell interactions between two cell types and their ligand-receptor pairs for different disease states |
| Ligand | Receptor | LRpair | Pathway | Tissue | Disease Stage |
| Page: 1 |
Top |
Single-cell gene regulatory network inference analysis |
| Find out the significant the regulons (TFs) and the target genes of each regulon across cell types for different disease states |
| TF | Cell Type | Tissue | Disease Stage | Target Gene | RSS | Regulon Activity |
| CCNT2 | LYMEND | Colorectum | FAP | RBM45,EXPH5,STON2, etc. | 7.15e-02 |  |
| CCNT2 | SURF | Endometrium | Healthy | FBXO4,MCM4,HDAC6, etc. | 4.34e-01 |  |
| CCNT2 | LC | Lung | Healthy | SGK1,UAP1,G3BP1, etc. | 1.48e-03 |  |
| CCNT2 | MEN | Skin | Healthy | F13A1,TAOK1,ARRB2, etc. | 2.00e-02 |  |
| ∗The dot plots of a searched regulon are shown for all cell subpopulations in each disease state of each tissue based on the regulon specific score inferred using pySCENIC and by calculating the average expression. |
| Page: 1 |
Top |
Somatic mutation of malignant transformation related genes |
| Annotation of somatic variants for genes involved in malignant transformation |
| Hugo Symbol | Variant Class | Variant Classification | dbSNP RS | HGVSc | HGVSp | HGVSp Short | SWISSPROT | BIOTYPE | SIFT | PolyPhen | Tumor Sample Barcode | Tissue | Histology | Sex | Age | Stage | Therapy Types | Drugs | Outcome |
| CCNT2 | SNV | Missense_Mutation | c.646N>A | p.Asp216Asn | p.D216N | O60583 | protein_coding | deleterious(0.03) | benign(0.083) | TCGA-AC-A23H-01 | Breast | breast invasive carcinoma | Female | >=65 | I/II | Unknown | Unknown | PD | |
| CCNT2 | SNV | Missense_Mutation | c.2140N>C | p.Asp714His | p.D714H | O60583 | protein_coding | deleterious(0) | possibly_damaging(0.887) | TCGA-AC-A23H-01 | Breast | breast invasive carcinoma | Female | >=65 | I/II | Unknown | Unknown | PD | |
| CCNT2 | SNV | Missense_Mutation | rs374605031 | c.1777G>A | p.Gly593Arg | p.G593R | O60583 | protein_coding | deleterious(0) | probably_damaging(0.999) | TCGA-D8-A3Z5-01 | Breast | breast invasive carcinoma | Female | <65 | III/IV | Unknown | Unknown | SD |
| CCNT2 | SNV | Missense_Mutation | novel | c.893A>T | p.Asn298Ile | p.N298I | O60583 | protein_coding | tolerated(0.06) | benign(0.05) | TCGA-E9-A2JS-01 | Breast | breast invasive carcinoma | Female | >=65 | I/II | Chemotherapy | cyclophosphamide | PD |
| CCNT2 | insertion | Nonsense_Mutation | novel | c.317_318insCTGTCTTTACTAAAAATACAAAAATTAGCC | p.Val106_Ala107insCysLeuTyrTerLysTyrLysAsnTerPro | p.V106_A107insCLY*KYKN*P | O60583 | protein_coding | TCGA-A7-A0CJ-01 | Breast | breast invasive carcinoma | Female | <65 | I/II | Chemotherapy | cytoxan | SD | ||
| CCNT2 | deletion | Frame_Shift_Del | novel | c.59delA | p.Asn20ThrfsTer39 | p.N20Tfs*39 | O60583 | protein_coding | TCGA-D8-A27V-01 | Breast | breast invasive carcinoma | Female | <65 | I/II | Hormone Therapy | tamoxiphen | SD | ||
| CCNT2 | SNV | Missense_Mutation | c.1850N>T | p.Ser617Leu | p.S617L | O60583 | protein_coding | deleterious(0) | benign(0.024) | TCGA-JW-A5VJ-01 | Cervix | cervical & endocervical cancer | Female | <65 | I/II | Unknown | Unknown | PD | |
| CCNT2 | SNV | Missense_Mutation | novel | c.923N>G | p.Ala308Gly | p.A308G | O60583 | protein_coding | tolerated(0.1) | benign(0.036) | TCGA-JW-A5VL-01 | Cervix | cervical & endocervical cancer | Female | <65 | I/II | Unknown | Unknown | SD |
| CCNT2 | SNV | Missense_Mutation | novel | c.419N>C | p.Leu140Pro | p.L140P | O60583 | protein_coding | deleterious(0) | probably_damaging(1) | TCGA-VS-A9UB-01 | Cervix | cervical & endocervical cancer | Female | <65 | I/II | Chemotherapy | cisplatin | CR |
| CCNT2 | SNV | Missense_Mutation | c.398N>A | p.Val133Asp | p.V133D | O60583 | protein_coding | deleterious(0) | probably_damaging(0.928) | TCGA-A6-A565-01 | Colorectum | colon adenocarcinoma | Female | <65 | III/IV | Unspecific | 5FU | PD |
| Page: 1 2 3 4 5 6 7 |
Top |
Related drugs of malignant transformation related genes |
| Identification of chemicals and drugs interact with genes involved in malignant transfromation |
| (DGIdb 4.0) |
| Entrez ID | Symbol | Category | Interaction Types | Drug Claim Name | Drug Name | PMIDs |
| Page: 1 |

Copyright 2023-Present -The University of Texas Health Science Center at Houston |