
|
|||||
|
 | |
| |
| |
| |
| |
| |
|
Gene: CCL28 |
Gene summary for CCL28 |
| Gene information | Species | Human | Gene symbol | CCL28 | Gene ID | 56477 |
| Gene name | C-C motif chemokine ligand 28 | |
| Gene Alias | CCK1 | |
| Cytomap | 5p12 | |
| Gene Type | protein-coding | GO ID | GO:0001952 | UniProtAcc | A0N0Q3 |
Top |
Malignant transformation analysis |
| Identification of the aberrant gene expression in precancerous and cancerous lesions by comparing the gene expression of stem-like cells in diseased tissues with normal stem cells |
| Entrez ID | Symbol | Replicates | Species | Organ | Tissue | Adj P-value | Log2FC | Malignancy |
| 56477 | CCL28 | GSM4909281 | Human | Breast | IDC | 3.04e-23 | -5.78e-01 | 0.21 |
| 56477 | CCL28 | GSM4909282 | Human | Breast | IDC | 3.72e-21 | -5.89e-01 | -0.0288 |
| 56477 | CCL28 | GSM4909285 | Human | Breast | IDC | 8.59e-20 | -5.22e-01 | 0.21 |
| 56477 | CCL28 | GSM4909286 | Human | Breast | IDC | 1.81e-25 | -6.04e-01 | 0.1081 |
| 56477 | CCL28 | GSM4909287 | Human | Breast | IDC | 4.41e-12 | -4.87e-01 | 0.2057 |
| 56477 | CCL28 | GSM4909290 | Human | Breast | IDC | 3.85e-07 | -4.83e-01 | 0.2096 |
| 56477 | CCL28 | GSM4909291 | Human | Breast | IDC | 4.28e-11 | -5.72e-01 | 0.1753 |
| 56477 | CCL28 | GSM4909293 | Human | Breast | IDC | 2.64e-06 | -4.16e-01 | 0.1581 |
| 56477 | CCL28 | GSM4909294 | Human | Breast | IDC | 2.15e-20 | -5.37e-01 | 0.2022 |
| 56477 | CCL28 | GSM4909296 | Human | Breast | IDC | 7.68e-18 | -5.58e-01 | 0.1524 |
| 56477 | CCL28 | GSM4909297 | Human | Breast | IDC | 7.09e-26 | -5.67e-01 | 0.1517 |
| 56477 | CCL28 | GSM4909298 | Human | Breast | IDC | 9.59e-11 | -4.31e-01 | 0.1551 |
| 56477 | CCL28 | GSM4909300 | Human | Breast | IDC | 1.63e-09 | 6.58e-01 | 0.0334 |
| 56477 | CCL28 | GSM4909301 | Human | Breast | IDC | 4.93e-22 | -5.63e-01 | 0.1577 |
| 56477 | CCL28 | GSM4909302 | Human | Breast | IDC | 2.33e-11 | -4.67e-01 | 0.1545 |
| 56477 | CCL28 | GSM4909304 | Human | Breast | IDC | 2.35e-28 | -6.14e-01 | 0.1636 |
| 56477 | CCL28 | GSM4909306 | Human | Breast | IDC | 7.87e-09 | -3.71e-01 | 0.1564 |
| 56477 | CCL28 | GSM4909307 | Human | Breast | IDC | 1.72e-09 | -1.38e-01 | 0.1569 |
| 56477 | CCL28 | GSM4909308 | Human | Breast | IDC | 5.02e-23 | -6.13e-01 | 0.158 |
| 56477 | CCL28 | GSM4909311 | Human | Breast | IDC | 1.60e-22 | -3.48e-01 | 0.1534 |
| Page: 1 2 3 4 5 6 |
| Tissue | Expression Dynamics | Abbreviation |
| Breast | 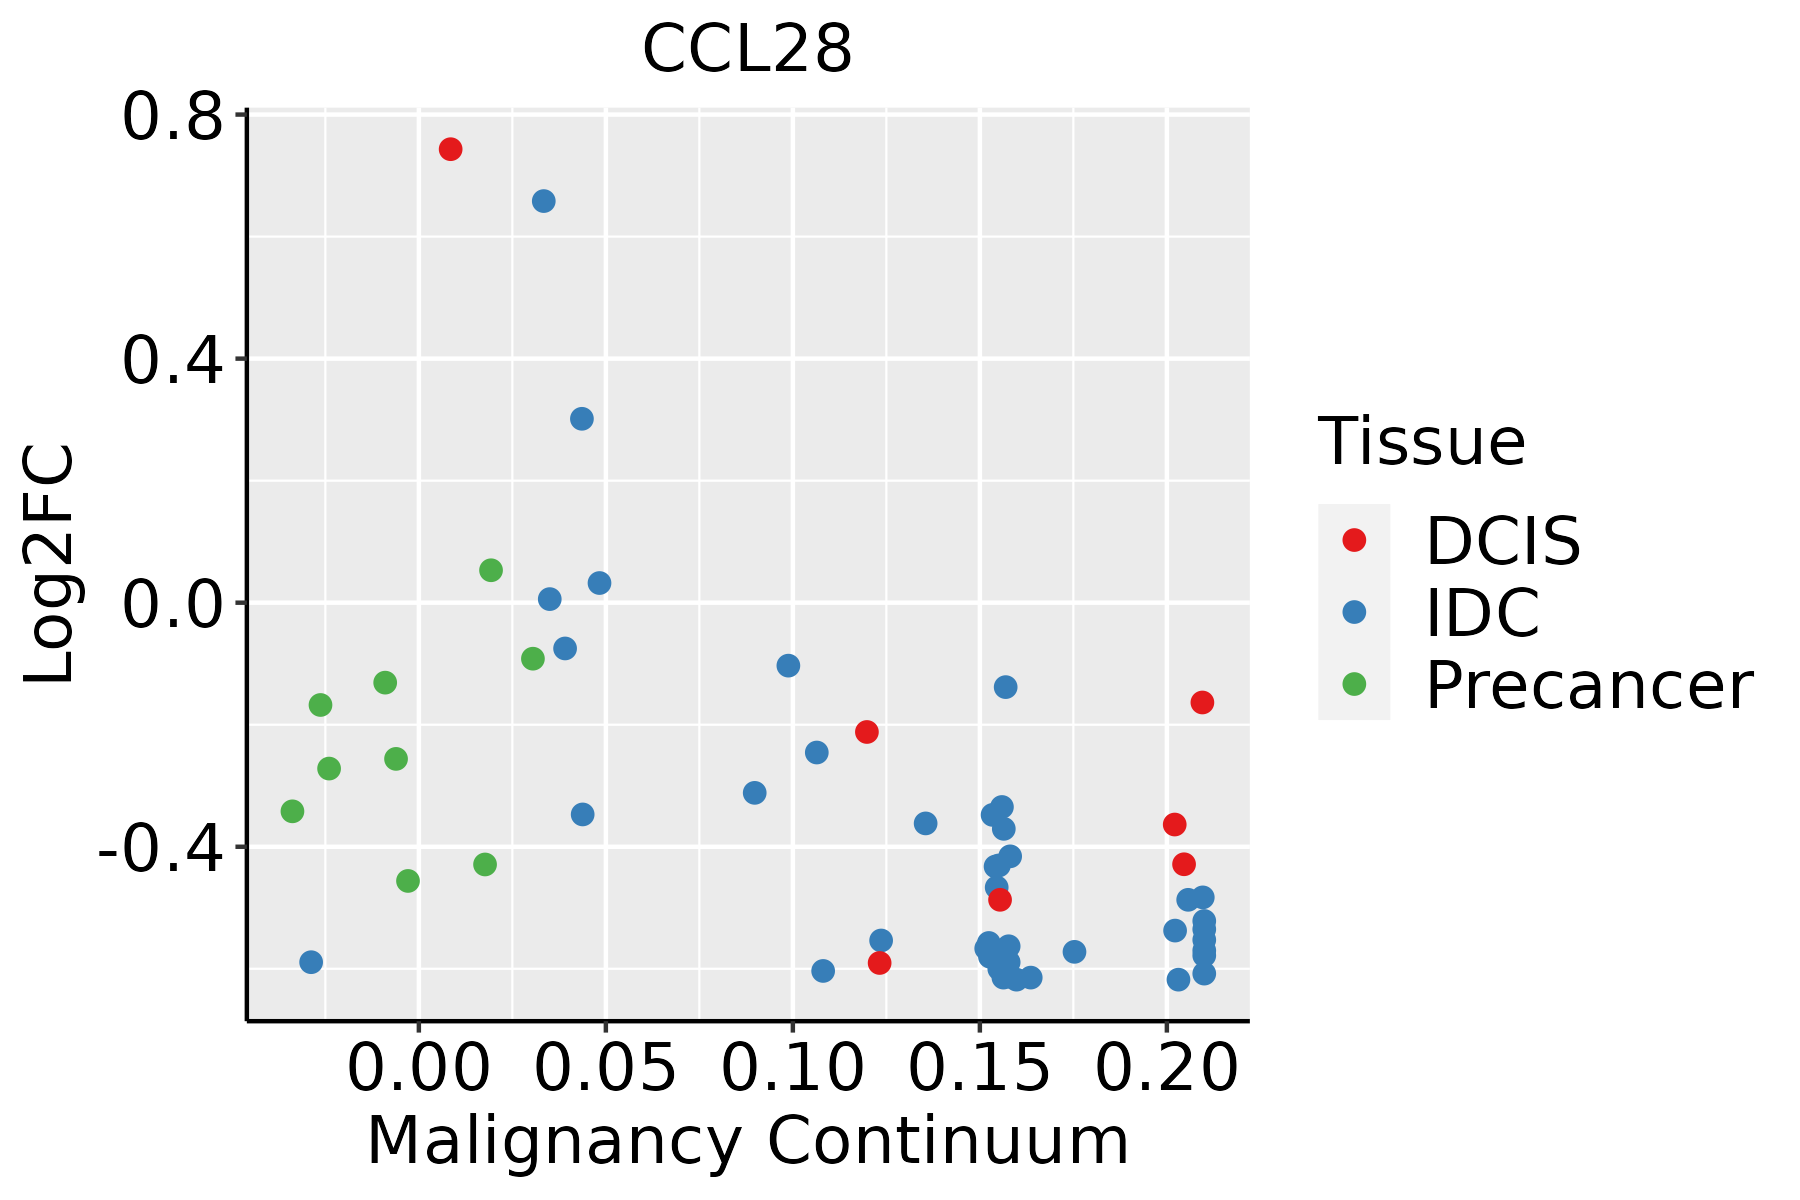 | IDC: Invasive ductal carcinoma |
| DCIS: Ductal carcinoma in situ | ||
| Precancer(BRCA1-mut): Precancerous lesion from BRCA1 mutation carriers | ||
| Colorectum (GSE201348) |  | FAP: Familial adenomatous polyposis |
| CRC: Colorectal cancer | ||
| Colorectum (HTA11) |  | AD: Adenomas |
| SER: Sessile serrated lesions | ||
| MSI-H: Microsatellite-high colorectal cancer | ||
| MSS: Microsatellite stable colorectal cancer | ||
| Esophagus | 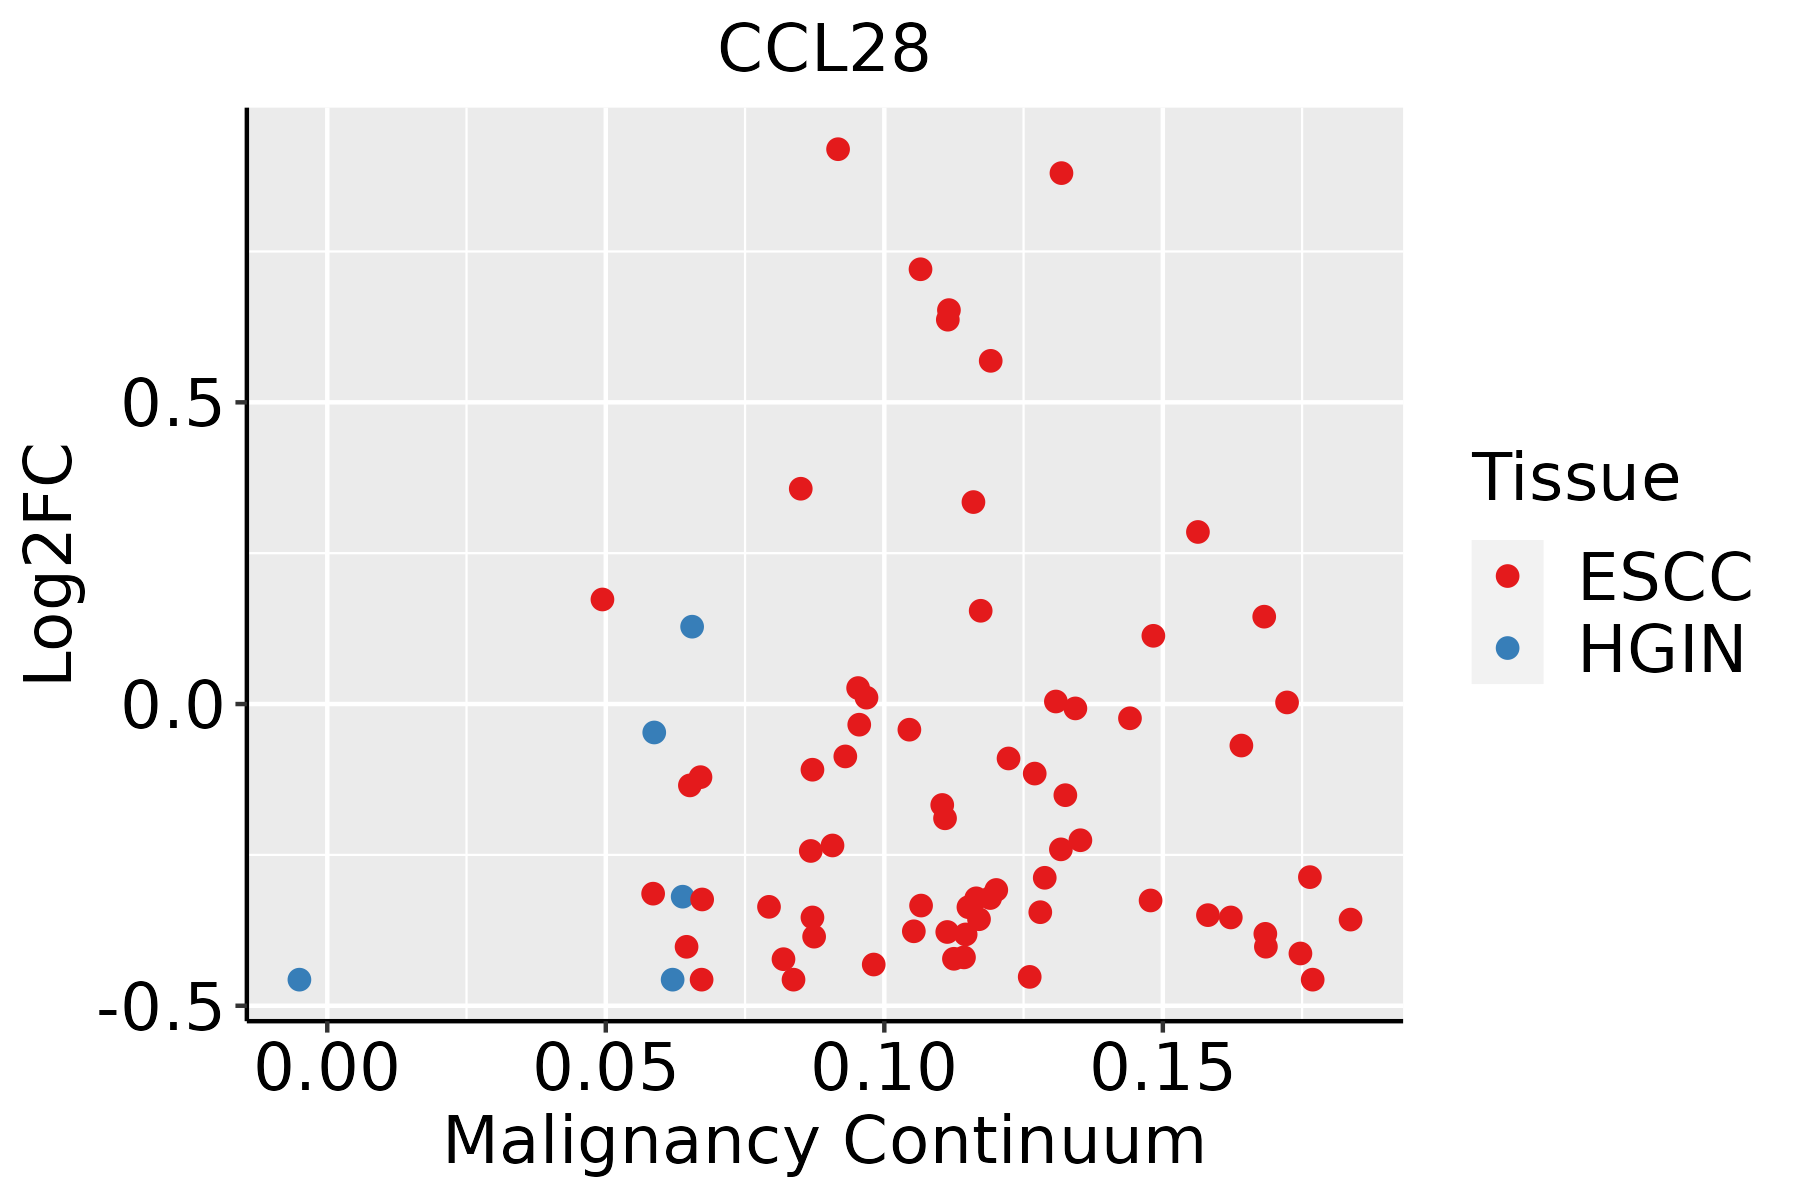 | ESCC: Esophageal squamous cell carcinoma |
| HGIN: High-grade intraepithelial neoplasias | ||
| LGIN: Low-grade intraepithelial neoplasias |
| ∗log2FC in expression of this searched gene in stem-like cells from each diseased tissue sample relative to stem-like cells in normal samples in each tissue plotted against the malignancy continuum. Samples are colored based on if they are from different disease stage. |
Top |
Malignant transformation related pathway analysis |
| Find out the enriched GO biological processes and KEGG pathways involved in transition from healthy to precancer to cancer |
| Tissue | Disease Stage | Enriched GO biological Processes |
| Colorectum | AD |  |
| Colorectum | SER |  |
| Colorectum | MSS |  |
| Colorectum | MSI-H |  |
| Colorectum | FAP |  |
| ∗Top 15 enriched GO BP terms are showed in the bar plot of each disease state in each tissue. Each row represents a significant GO biological process which is colored according to the -log10(p.adjust). |
| Page: 1 2 3 4 5 6 7 8 9 |
| GO ID | Tissue | Disease Stage | Description | Gene Ratio | Bg Ratio | pvalue | p.adjust | Count |
| GO:000268311 | Breast | IDC | negative regulation of immune system process | 55/1434 | 434/18723 | 1.53e-04 | 2.67e-03 | 55 |
| GO:190303711 | Breast | IDC | regulation of leukocyte cell-cell adhesion | 45/1434 | 336/18723 | 1.72e-04 | 2.92e-03 | 45 |
| GO:00512712 | Breast | IDC | negative regulation of cellular component movement | 48/1434 | 367/18723 | 1.88e-04 | 3.12e-03 | 48 |
| GO:002240712 | Breast | IDC | regulation of cell-cell adhesion | 55/1434 | 448/18723 | 3.43e-04 | 5.07e-03 | 55 |
| GO:20001462 | Breast | IDC | negative regulation of cell motility | 46/1434 | 359/18723 | 4.01e-04 | 5.60e-03 | 46 |
| GO:00303362 | Breast | IDC | negative regulation of cell migration | 43/1434 | 344/18723 | 1.01e-03 | 1.13e-02 | 43 |
| GO:001081114 | Breast | IDC | positive regulation of cell-substrate adhesion | 20/1434 | 123/18723 | 1.05e-03 | 1.16e-02 | 20 |
| GO:00400132 | Breast | IDC | negative regulation of locomotion | 47/1434 | 391/18723 | 1.39e-03 | 1.43e-02 | 47 |
| GO:00071625 | Breast | IDC | negative regulation of cell adhesion | 37/1434 | 303/18723 | 3.27e-03 | 2.75e-02 | 37 |
| GO:00108109 | Breast | IDC | regulation of cell-substrate adhesion | 28/1434 | 221/18723 | 5.88e-03 | 4.24e-02 | 28 |
| GO:005090021 | Breast | DCIS | leukocyte migration | 54/1390 | 369/18723 | 1.22e-06 | 4.78e-05 | 54 |
| GO:004578524 | Breast | DCIS | positive regulation of cell adhesion | 60/1390 | 437/18723 | 2.69e-06 | 9.24e-05 | 60 |
| GO:006032621 | Breast | DCIS | cell chemotaxis | 46/1390 | 310/18723 | 5.05e-06 | 1.48e-04 | 46 |
| GO:000268321 | Breast | DCIS | negative regulation of immune system process | 57/1390 | 434/18723 | 1.81e-05 | 4.35e-04 | 57 |
| GO:000715921 | Breast | DCIS | leukocyte cell-cell adhesion | 50/1390 | 371/18723 | 2.95e-05 | 6.55e-04 | 50 |
| GO:190303721 | Breast | DCIS | regulation of leukocyte cell-cell adhesion | 46/1390 | 336/18723 | 4.11e-05 | 8.74e-04 | 46 |
| GO:000268521 | Breast | DCIS | regulation of leukocyte migration | 32/1390 | 210/18723 | 7.94e-05 | 1.52e-03 | 32 |
| GO:002240722 | Breast | DCIS | regulation of cell-cell adhesion | 56/1390 | 448/18723 | 8.53e-05 | 1.61e-03 | 56 |
| GO:005127111 | Breast | DCIS | negative regulation of cellular component movement | 48/1390 | 367/18723 | 8.97e-05 | 1.69e-03 | 48 |
| GO:003166723 | Breast | DCIS | response to nutrient levels | 58/1390 | 474/18723 | 1.16e-04 | 2.03e-03 | 58 |
| Page: 1 2 3 4 5 6 |
| Pathway ID | Tissue | Disease Stage | Description | Gene Ratio | Bg Ratio | pvalue | p.adjust | qvalue | Count |
| Page: 1 |
Top |
Cell-cell communication analysis |
| Identification of potential cell-cell interactions between two cell types and their ligand-receptor pairs for different disease states |
| Ligand | Receptor | LRpair | Pathway | Tissue | Disease Stage |
| CCL28 | CCR10 | CCL28_CCR10 | CCL | Breast | DCIS |
| CCL28 | CCR10 | CCL28_CCR10 | CCL | Breast | Healthy |
| CCL28 | CCR10 | CCL28_CCR10 | CCL | CRC | AD |
| CCL28 | CCR10 | CCL28_CCR10 | CCL | CRC | MSI-H |
| CCL28 | CCR10 | CCL28_CCR10 | CCL | CRC | SER |
| Page: 1 |
Top |
Single-cell gene regulatory network inference analysis |
| Find out the significant the regulons (TFs) and the target genes of each regulon across cell types for different disease states |
| TF | Cell Type | Tissue | Disease Stage | Target Gene | RSS | Regulon Activity |
| ∗The dot plots of a searched regulon are shown for all cell subpopulations in each disease state of each tissue based on the regulon specific score inferred using pySCENIC and by calculating the average expression. |
| Page: 1 |
Top |
Somatic mutation of malignant transformation related genes |
| Annotation of somatic variants for genes involved in malignant transformation |
| Hugo Symbol | Variant Class | Variant Classification | dbSNP RS | HGVSc | HGVSp | HGVSp Short | SWISSPROT | BIOTYPE | SIFT | PolyPhen | Tumor Sample Barcode | Tissue | Histology | Sex | Age | Stage | Therapy Types | Drugs | Outcome |
| CCL28 | SNV | Missense_Mutation | c.265G>A | p.Ala89Thr | p.A89T | Q9NRJ3 | protein_coding | tolerated(0.37) | benign(0.012) | TCGA-D8-A1JJ-01 | Breast | breast invasive carcinoma | Female | <65 | I/II | Chemotherapy | doxorubicine | SD | |
| CCL28 | SNV | Missense_Mutation | novel | c.371N>C | p.Lys124Thr | p.K124T | Q9NRJ3 | protein_coding | tolerated(0.11) | benign(0.282) | TCGA-CA-6717-01 | Colorectum | colon adenocarcinoma | Male | <65 | I/II | Chemotherapy | oxaliplatin | CR |
| CCL28 | SNV | Missense_Mutation | rs775586405 | c.149N>A | p.Arg50His | p.R50H | Q9NRJ3 | protein_coding | tolerated(0.38) | benign(0.007) | TCGA-D5-6530-01 | Colorectum | colon adenocarcinoma | Male | <65 | I/II | Unknown | Unknown | SD |
| CCL28 | SNV | Missense_Mutation | rs775586405 | c.149N>A | p.Arg50His | p.R50H | Q9NRJ3 | protein_coding | tolerated(0.38) | benign(0.007) | TCGA-AX-A0J1-01 | Endometrium | uterine corpus endometrioid carcinoma | Female | >=65 | I/II | Unknown | Unknown | SD |
| CCL28 | SNV | Missense_Mutation | c.70C>T | p.Leu24Phe | p.L24F | Q9NRJ3 | protein_coding | tolerated(0.44) | probably_damaging(0.996) | TCGA-D1-A103-01 | Endometrium | uterine corpus endometrioid carcinoma | Female | >=65 | I/II | Unknown | Unknown | SD | |
| CCL28 | SNV | Missense_Mutation | novel | c.212N>T | p.Arg71Ile | p.R71I | Q9NRJ3 | protein_coding | deleterious(0) | probably_damaging(0.986) | TCGA-EO-A22X-01 | Endometrium | uterine corpus endometrioid carcinoma | Female | <65 | III/IV | Unspecific | Carboplatin | Complete Response |
| CCL28 | deletion | Frame_Shift_Del | novel | c.351delN | p.Lys117AsnfsTer37 | p.K117Nfs*37 | Q9NRJ3 | protein_coding | TCGA-D1-A2G5-01 | Endometrium | uterine corpus endometrioid carcinoma | Female | <65 | I/II | Unknown | Unknown | PD | ||
| CCL28 | SNV | Missense_Mutation | novel | c.368N>T | p.His123Leu | p.H123L | Q9NRJ3 | protein_coding | deleterious(0.04) | benign(0) | TCGA-53-A4EZ-01 | Lung | lung adenocarcinoma | Male | <65 | I/II | Chemotherapy | cisplatin | CR |
| CCL28 | SNV | Missense_Mutation | novel | c.281N>T | p.Gly94Val | p.G94V | Q9NRJ3 | protein_coding | tolerated(0.05) | benign(0.005) | TCGA-73-4666-01 | Lung | lung adenocarcinoma | Female | <65 | III/IV | Chemotherapy | carboplatin | SD |
| CCL28 | SNV | Missense_Mutation | c.364G>T | p.Gly122Cys | p.G122C | Q9NRJ3 | protein_coding | tolerated(0.1) | possibly_damaging(0.902) | TCGA-95-7043-01 | Lung | lung adenocarcinoma | Female | <65 | I/II | Unknown | Unknown | PD |
| Page: 1 2 |
Top |
Related drugs of malignant transformation related genes |
| Identification of chemicals and drugs interact with genes involved in malignant transfromation |
| (DGIdb 4.0) |
| Entrez ID | Symbol | Category | Interaction Types | Drug Claim Name | Drug Name | PMIDs |
| 56477 | CCL28 | DRUGGABLE GENOME | ANTISERUM | 15681819 |
| Page: 1 |

Copyright 2023-Present -The University of Texas Health Science Center at Houston |