Schematic overview of the cellular and molecular mechanisms involved in the cancer progression, including the proposed cellular and molecular mechanisms in cancer cells trajectory. AT1: alveolar type 1 cells; AT2: alveolar type 2 cells; AAH: atypical adenomatous hyperplasia; AIS: adenocarcinoma in situ; MIA: minimally invasive adenocarcinoma; IA: invasive adenocarcinoma; EMT: epithelial-mesenchymal transition

Home

Download

Statistics

Help

Contact

Center for Computational Systems Medicine
leaf

Gene summary

leaf

Malignant transformation analysis

leaf

Malignant transformation related pathway analysis

leaf

Cell-cell communication analysis

leaf

Single-cell gene regulatory network inference analysis

leaf

Somatic mutation of malignant transformation related genes

leaf

Related drugs of malignant transformation related genes

Gene: CAMTA1

Gene summary for CAMTA1

check button Gene summary.

Gene informationSpeciesHuman
Gene symbol

CAMTA1

Gene ID

23261

Gene namecalmodulin binding transcription activator 1
Gene AliasCANPMR
Cytomap1p36.31-p36.23
Gene Typeprotein-coding
GO ID

GO:0006139

UniProtAcc

Q9Y6Y1


Top

Malignant transformation analysis

check button Identification of the aberrant gene expression in precancerous and cancerous lesions by comparing the gene expression of stem-like cells in diseased tissues with normal stem cells
check button Malignant transformation involving gene list.
Entrez IDSymbolReplicatesSpeciesOrganTissueAdj P-valueLog2FCMalignancy
23261CAMTA1GSM4909281HumanBreastIDC1.31e-124.23e-010.21
23261CAMTA1GSM4909288HumanBreastIDC1.13e-03-2.89e-010.0988
23261CAMTA1GSM4909293HumanBreastIDC3.63e-03-1.55e-010.1581
23261CAMTA1GSM4909294HumanBreastIDC3.53e-02-4.70e-020.2022
23261CAMTA1GSM4909296HumanBreastIDC1.17e-07-2.65e-010.1524
23261CAMTA1GSM4909297HumanBreastIDC1.03e-18-2.52e-010.1517
23261CAMTA1GSM4909298HumanBreastIDC5.38e-05-2.64e-010.1551
23261CAMTA1GSM4909304HumanBreastIDC2.32e-02-2.50e-010.1636
23261CAMTA1GSM4909311HumanBreastIDC1.10e-38-6.28e-010.1534
23261CAMTA1GSM4909312HumanBreastIDC1.15e-20-5.37e-010.1552
23261CAMTA1GSM4909313HumanBreastIDC7.34e-04-1.27e-010.0391
23261CAMTA1GSM4909319HumanBreastIDC1.03e-47-5.39e-010.1563
23261CAMTA1GSM4909320HumanBreastIDC1.41e-09-4.93e-010.1575
23261CAMTA1GSM4909321HumanBreastIDC4.01e-30-5.84e-010.1559
23261CAMTA1brca3HumanBreastPrecancer2.80e-038.12e-02-0.0263
23261CAMTA1M1HumanBreastIDC3.57e-06-4.46e-010.1577
23261CAMTA1NCCBC14HumanBreastDCIS2.90e-16-3.45e-010.2021
23261CAMTA1NCCBC2HumanBreastDCIS1.65e-06-5.97e-010.1554
23261CAMTA1NCCBC3HumanBreastDCIS4.78e-03-3.06e-010.1198
23261CAMTA1NCCBC5HumanBreastDCIS2.81e-17-4.20e-010.2046
Page: 1 2 3 4 5 6 7 8 9 10 11 12 

check button Transcriptomic changes along malignancy continuum.
TissueExpression DynamicsAbbreviation
BreastThe image shows the transcriptomic changes along malignancy continuum.log2FC in expression of this searched gene in stem-like cells from each diseased tissue sample relative to stem-like cells in normal samples in each tissue plotted against the malignancy continuum. Samples are colored based on if they are from different disease stage.
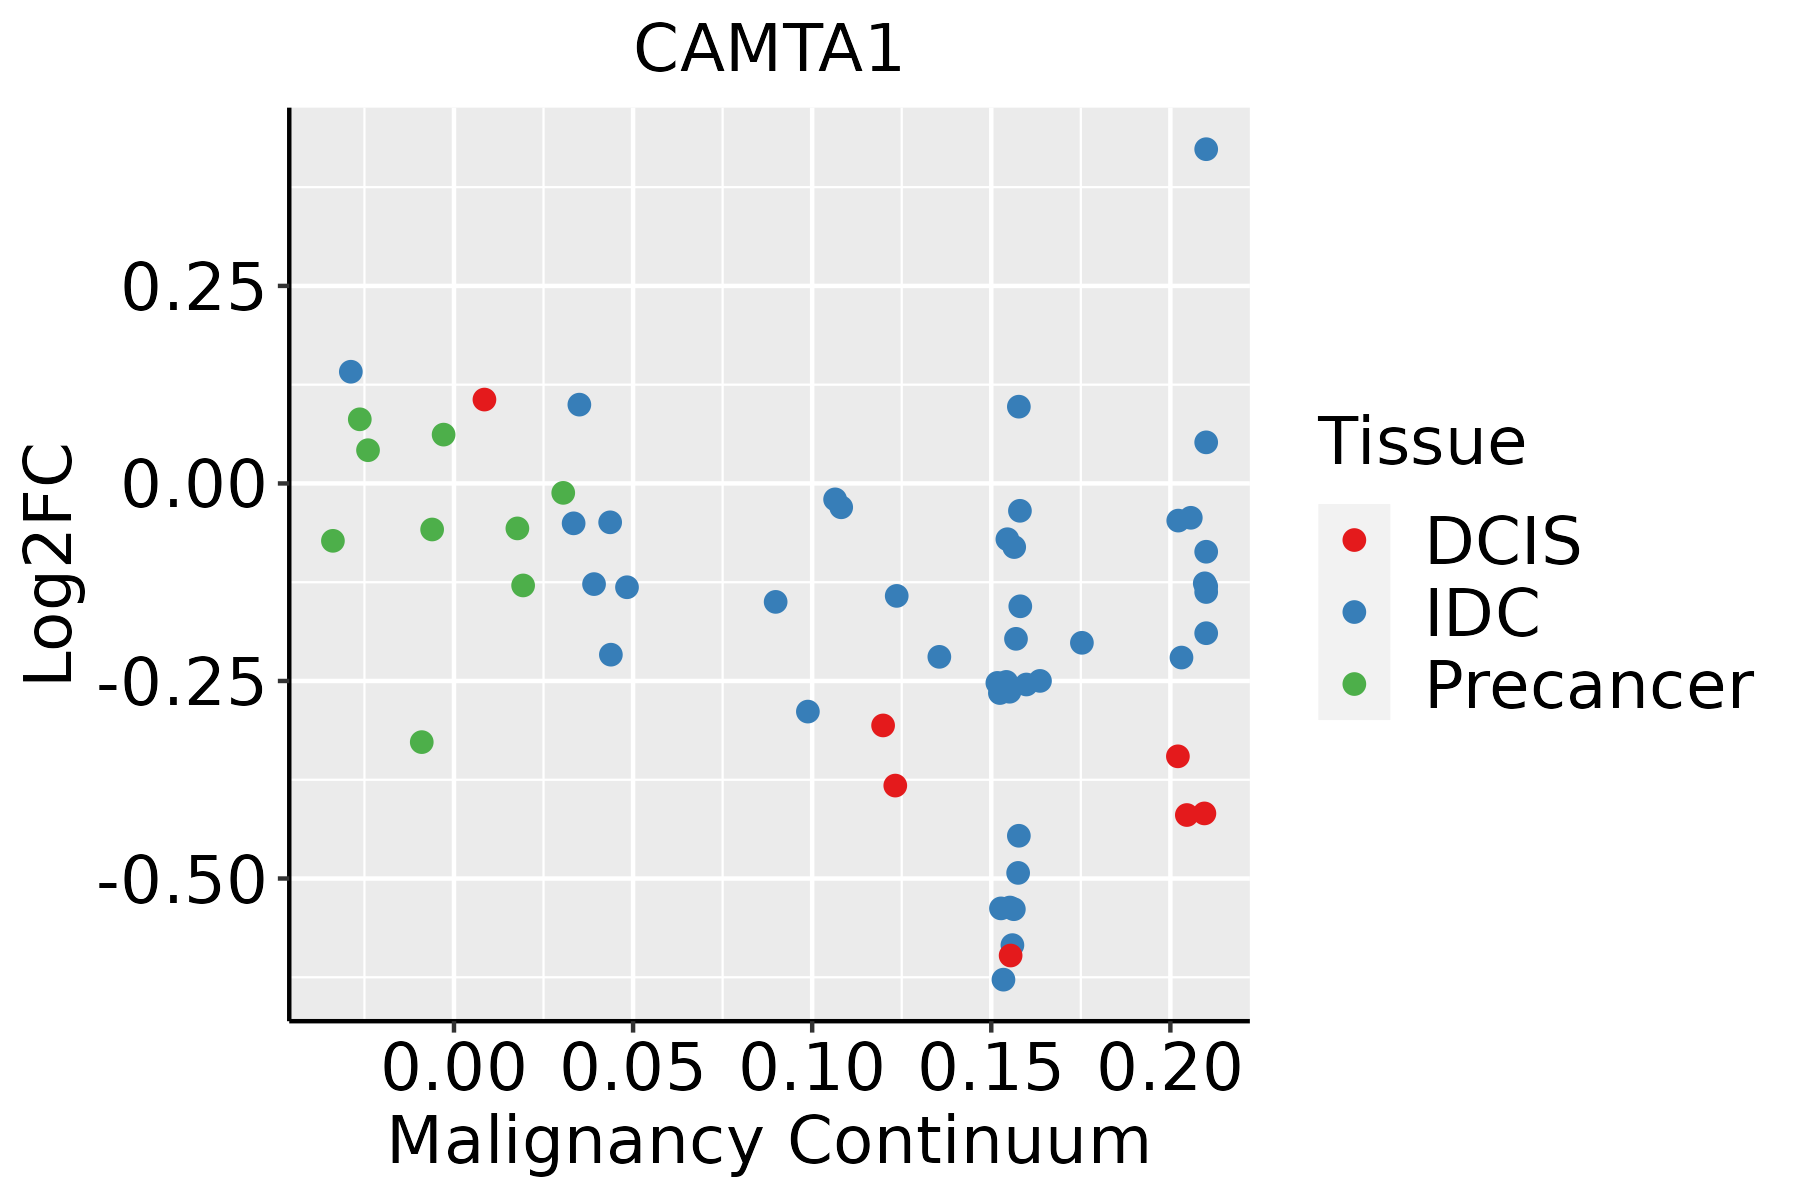
IDC: Invasive ductal carcinoma
DCIS: Ductal carcinoma in situ
Precancer(BRCA1-mut): Precancerous lesion from BRCA1 mutation carriers
Colorectum (GSE201348)The image shows the transcriptomic changes along malignancy continuum.log2FC in expression of this searched gene in stem-like cells from each diseased tissue sample relative to stem-like cells in normal samples in each tissue plotted against the malignancy continuum. Samples are colored based on if they are from different disease stage.FAP: Familial adenomatous polyposis
CRC: Colorectal cancer
Colorectum (HTA11)The image shows the transcriptomic changes along malignancy continuum.log2FC in expression of this searched gene in stem-like cells from each diseased tissue sample relative to stem-like cells in normal samples in each tissue plotted against the malignancy continuum. Samples are colored based on if they are from different disease stage.AD: Adenomas
SER: Sessile serrated lesions
MSI-H: Microsatellite-high colorectal cancer
MSS: Microsatellite stable colorectal cancer
EsophagusThe image shows the transcriptomic changes along malignancy continuum.log2FC in expression of this searched gene in stem-like cells from each diseased tissue sample relative to stem-like cells in normal samples in each tissue plotted against the malignancy continuum. Samples are colored based on if they are from different disease stage.
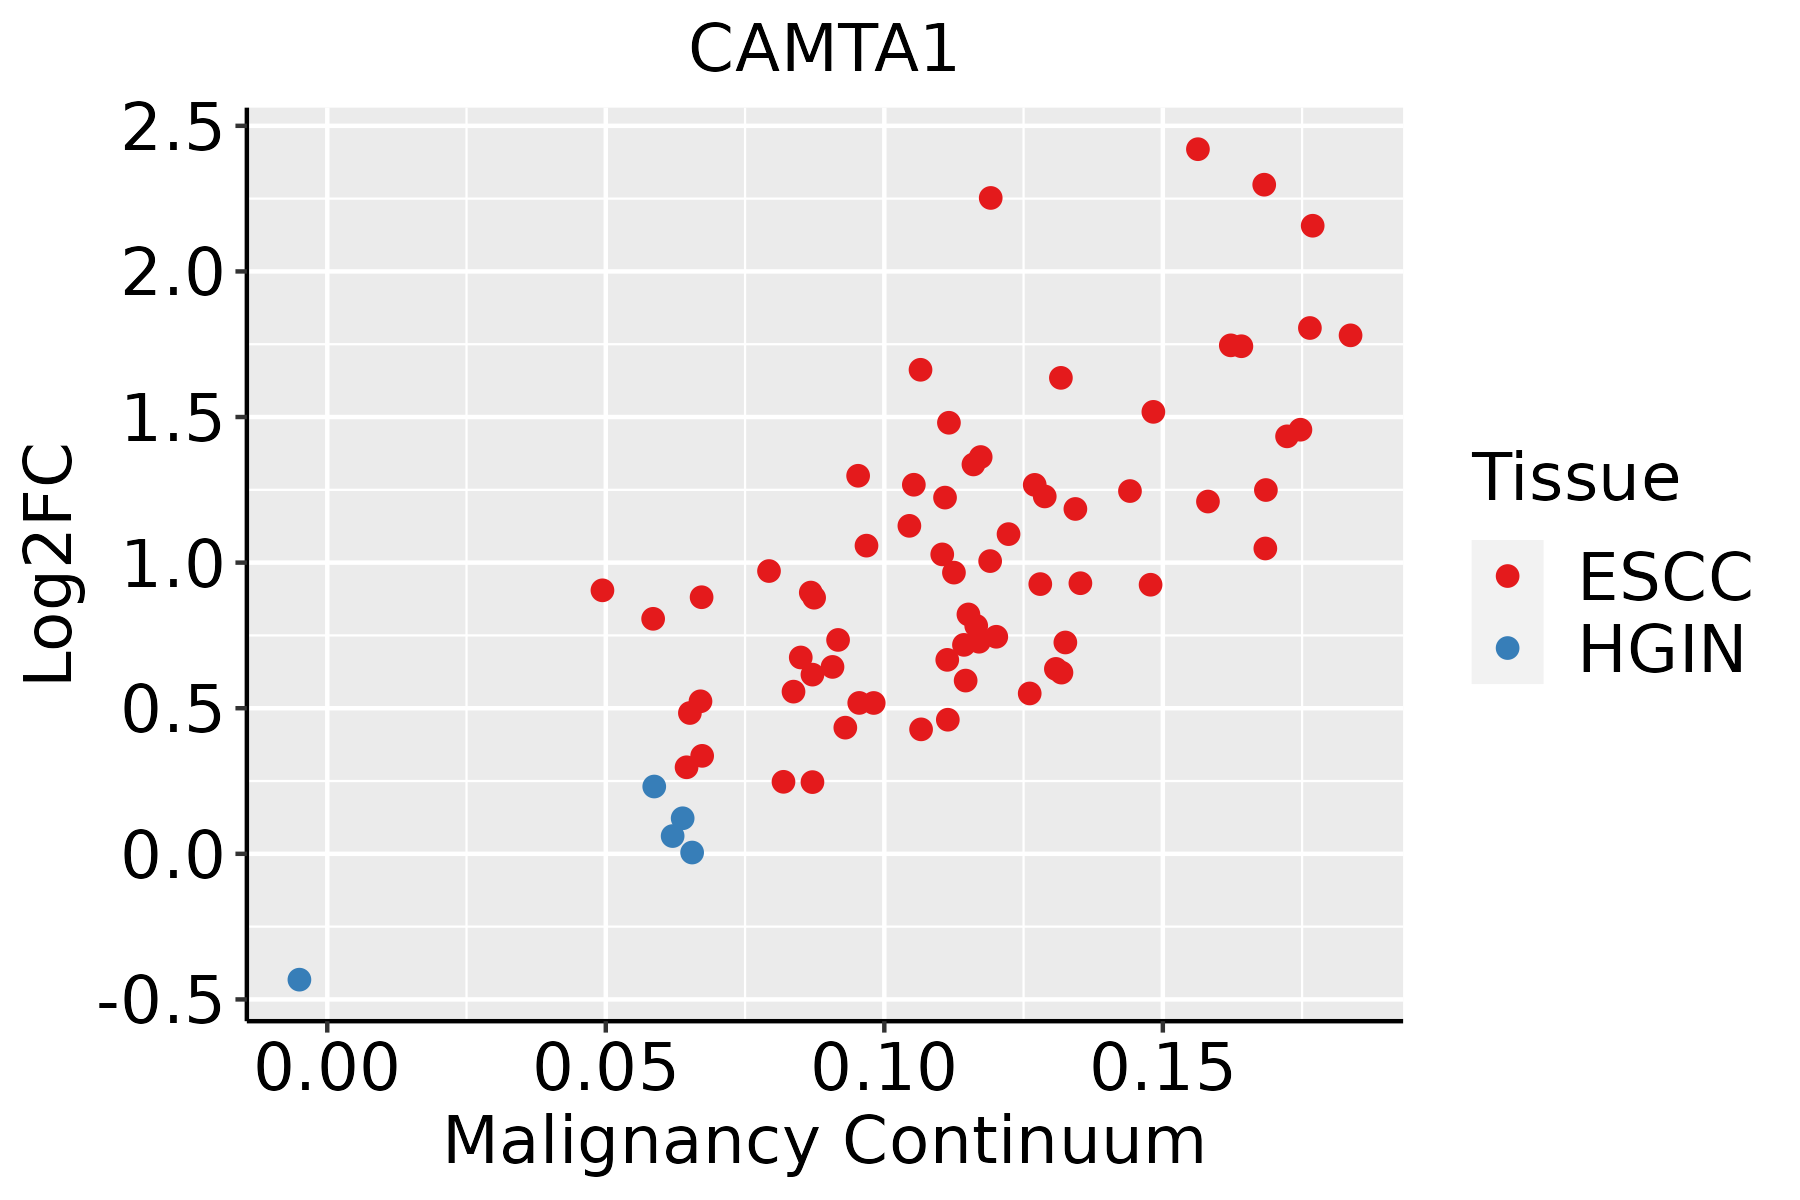
ESCC: Esophageal squamous cell carcinoma
HGIN: High-grade intraepithelial neoplasias
LGIN: Low-grade intraepithelial neoplasias
LiverThe image shows the transcriptomic changes along malignancy continuum.log2FC in expression of this searched gene in stem-like cells from each diseased tissue sample relative to stem-like cells in normal samples in each tissue plotted against the malignancy continuum. Samples are colored based on if they are from different disease stage.
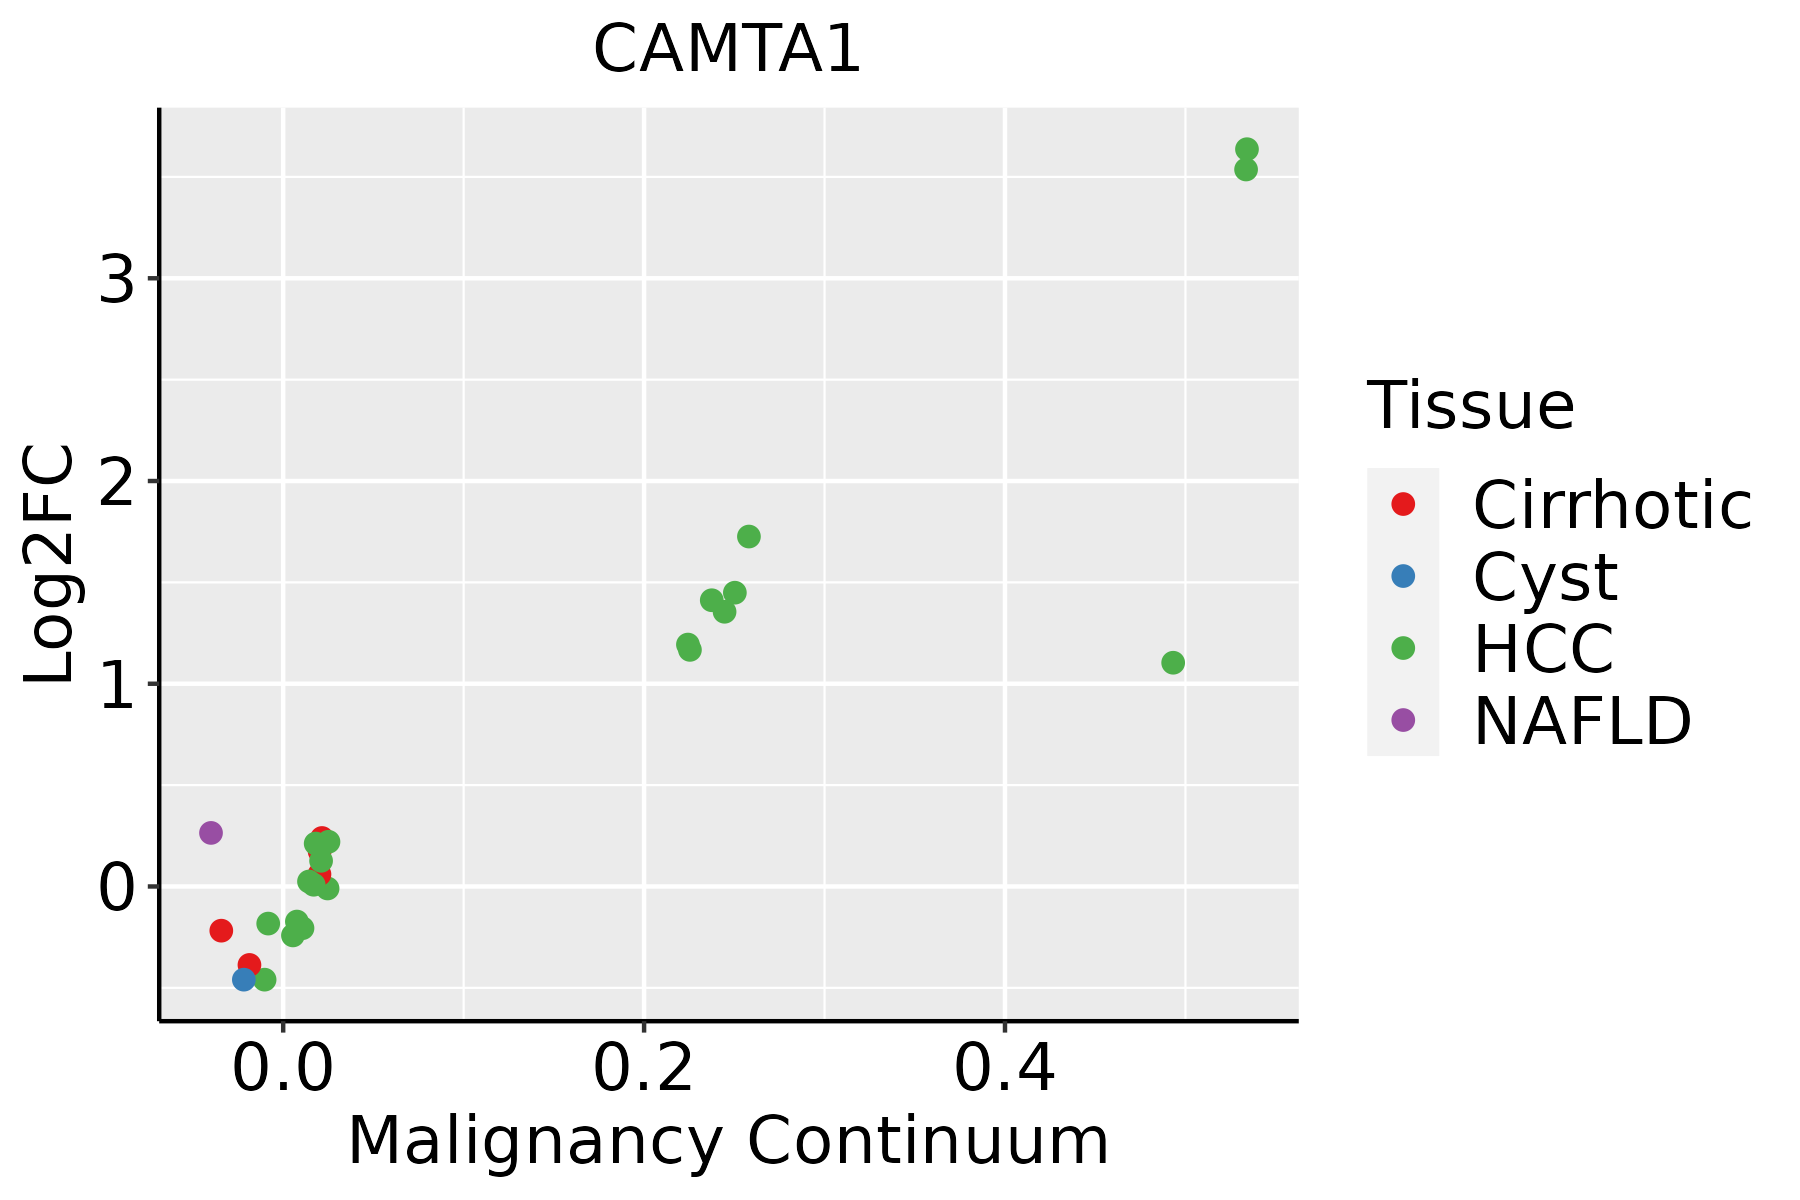
HCC: Hepatocellular carcinoma
NAFLD: Non-alcoholic fatty liver disease
LungThe image shows the transcriptomic changes along malignancy continuum.log2FC in expression of this searched gene in stem-like cells from each diseased tissue sample relative to stem-like cells in normal samples in each tissue plotted against the malignancy continuum. Samples are colored based on if they are from different disease stage.AAH: Atypical adenomatous hyperplasia
AIS: Adenocarcinoma in situ
IAC: Invasive lung adenocarcinoma
MIA: Minimally invasive adenocarcinoma
Oral CavityThe image shows the transcriptomic changes along malignancy continuum.log2FC in expression of this searched gene in stem-like cells from each diseased tissue sample relative to stem-like cells in normal samples in each tissue plotted against the malignancy continuum. Samples are colored based on if they are from different disease stage.EOLP: Erosive Oral lichen planus
LP: leukoplakia
NEOLP: Non-erosive oral lichen planus
OSCC: Oral squamous cell carcinoma
ProstateThe image shows the transcriptomic changes along malignancy continuum.log2FC in expression of this searched gene in stem-like cells from each diseased tissue sample relative to stem-like cells in normal samples in each tissue plotted against the malignancy continuum. Samples are colored based on if they are from different disease stage.
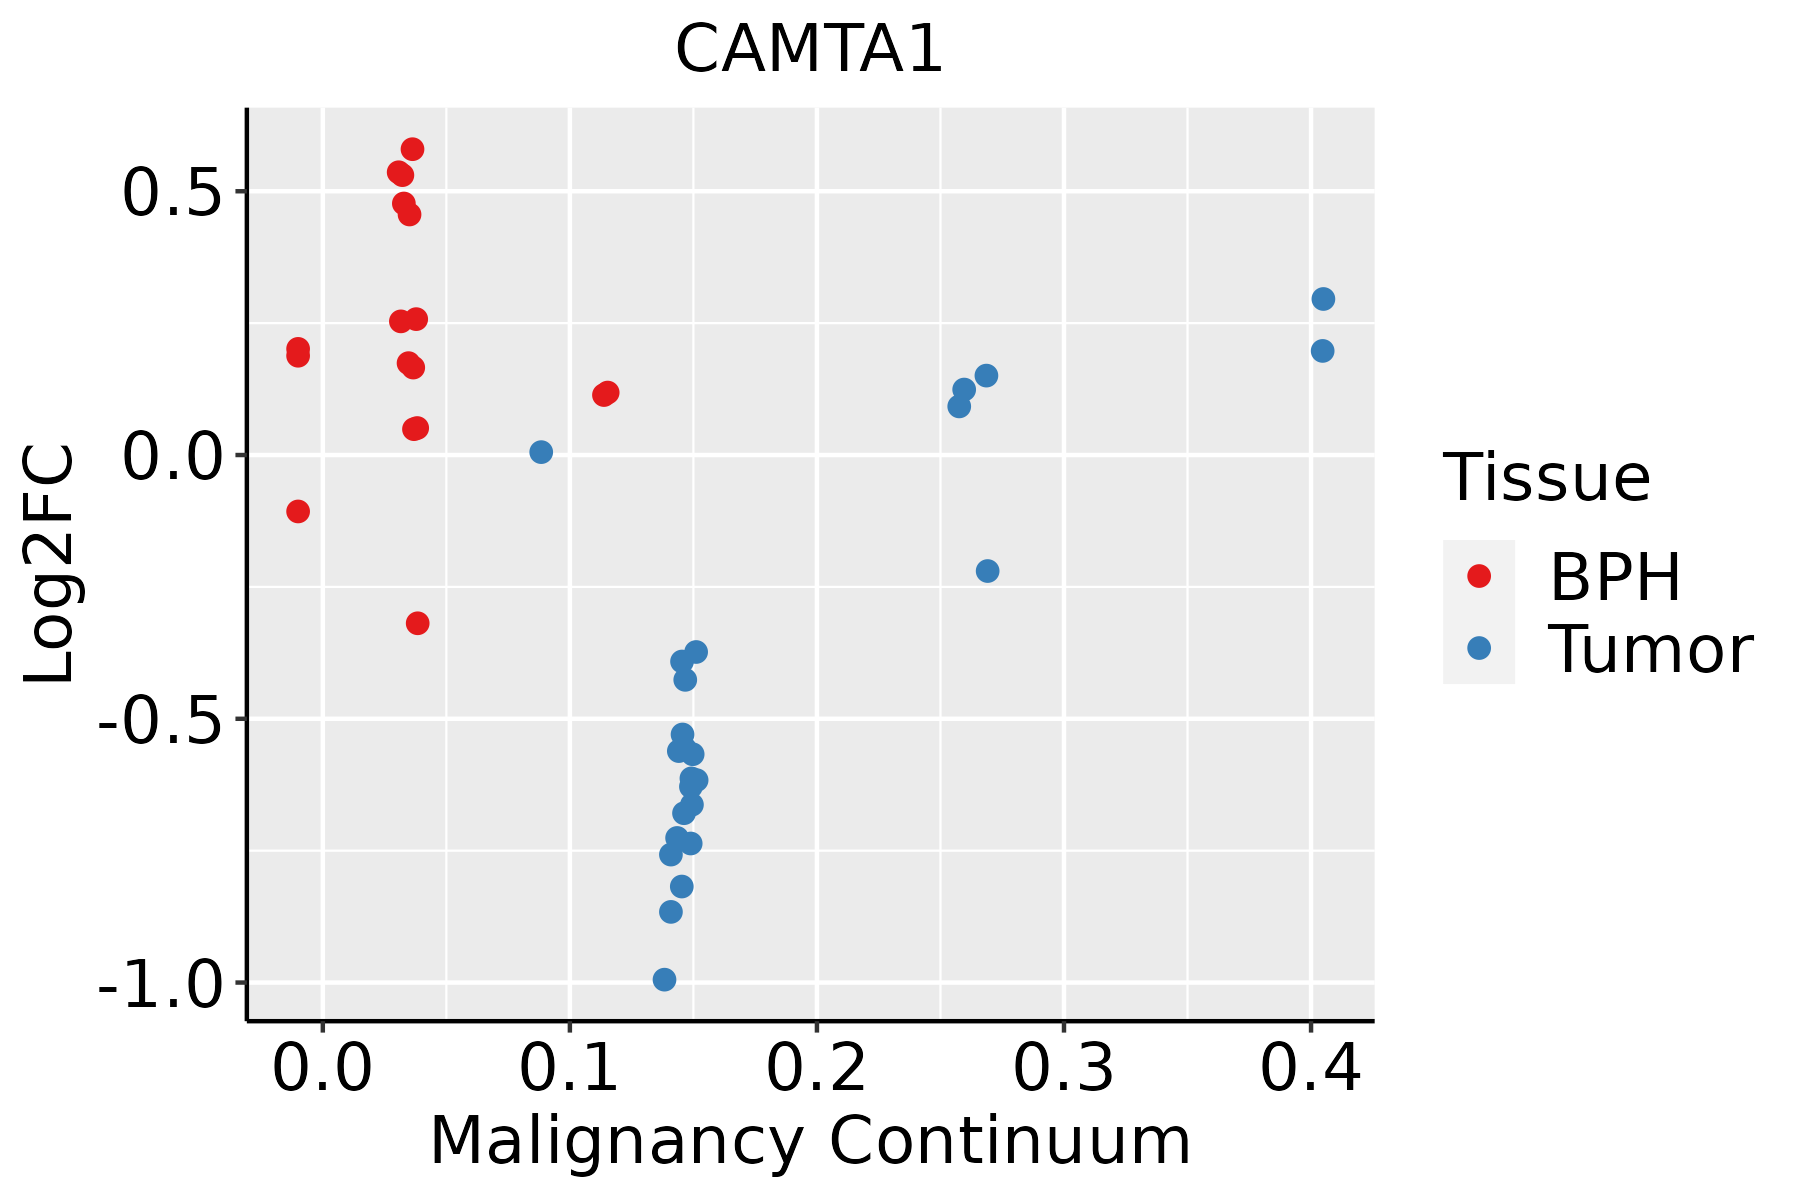
BPH: Benign Prostatic Hyperplasia
SkinThe image shows the transcriptomic changes along malignancy continuum.log2FC in expression of this searched gene in stem-like cells from each diseased tissue sample relative to stem-like cells in normal samples in each tissue plotted against the malignancy continuum. Samples are colored based on if they are from different disease stage.
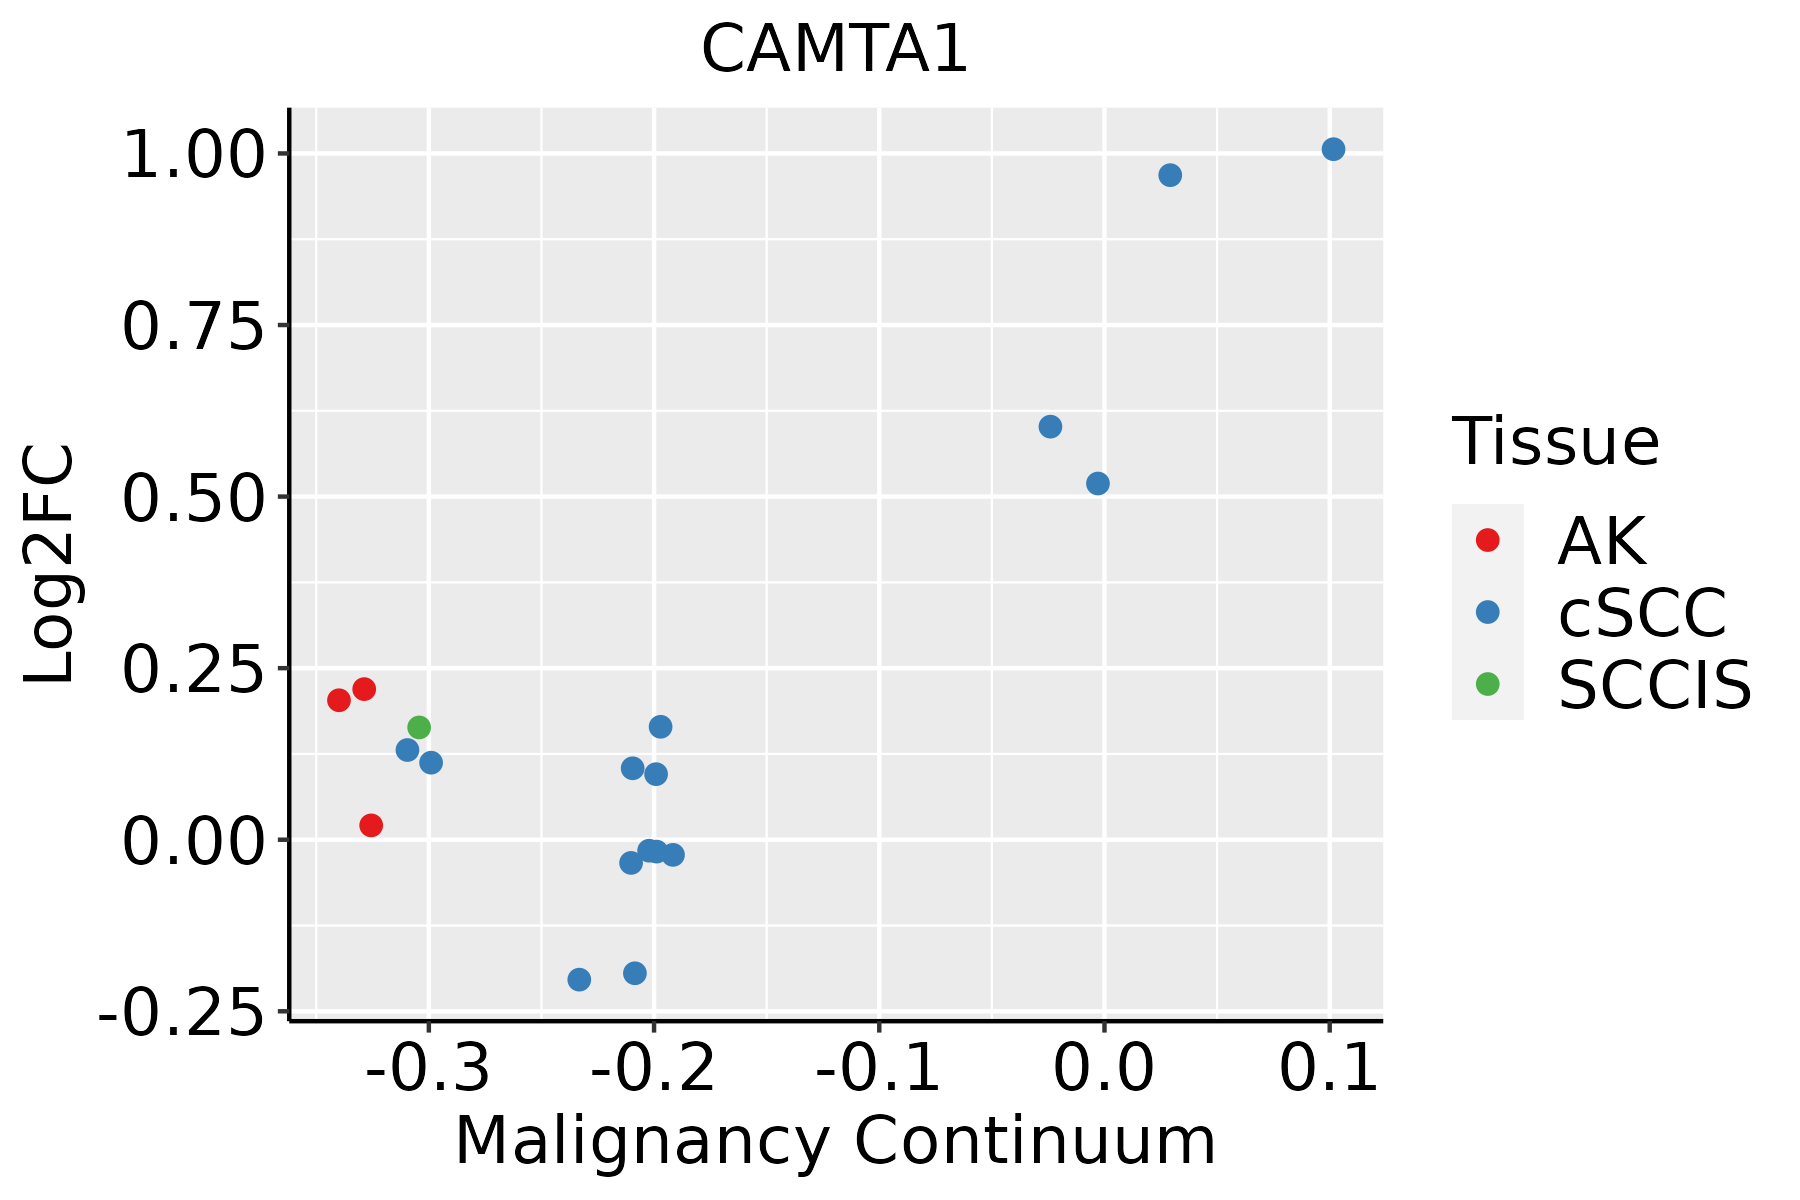
AK: Actinic keratosis
cSCC: Cutaneous squamous cell carcinoma
SCCIS:squamous cell carcinoma in situ
ThyroidThe image shows the transcriptomic changes along malignancy continuum.log2FC in expression of this searched gene in stem-like cells from each diseased tissue sample relative to stem-like cells in normal samples in each tissue plotted against the malignancy continuum. Samples are colored based on if they are from different disease stage.
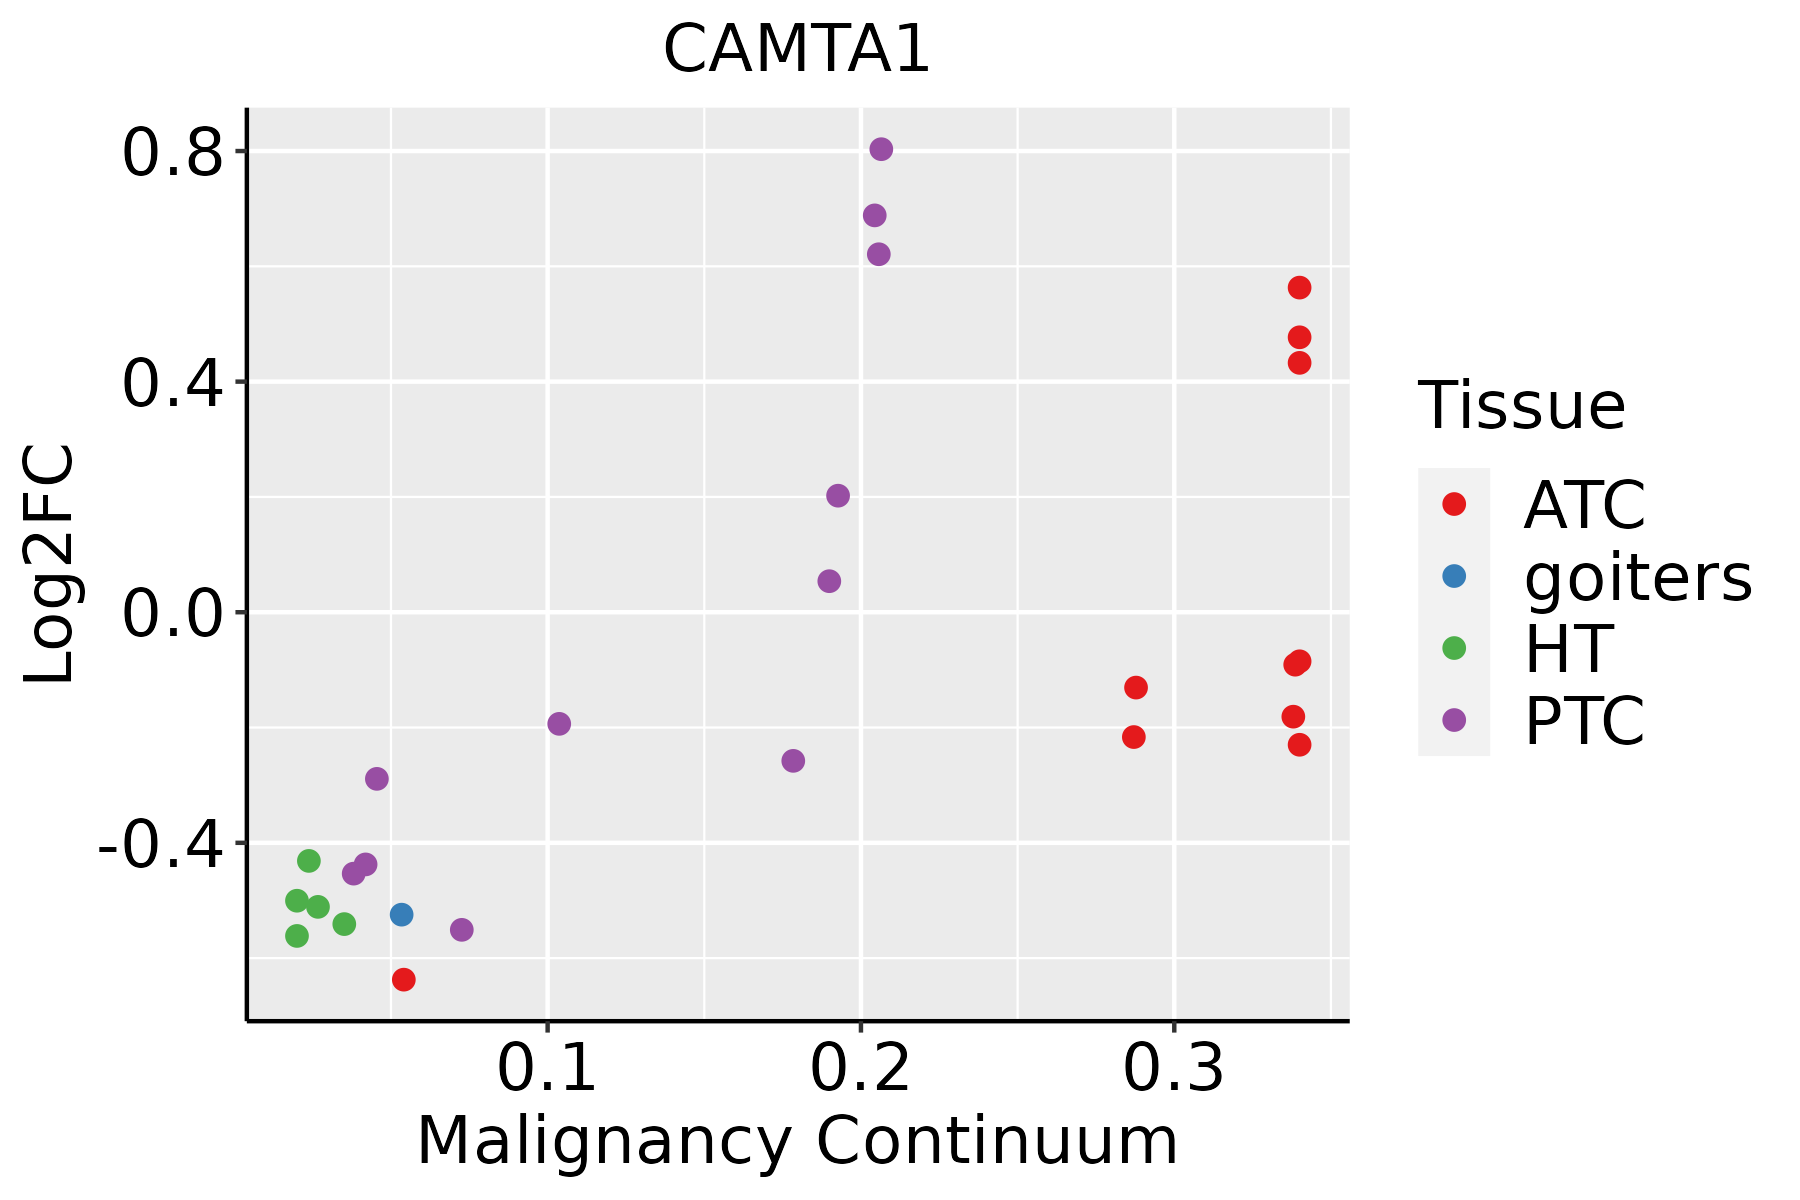
ATC: Anaplastic thyroid cancer
HT: Hashimoto's thyroiditis
PTC: Papillary thyroid cancer
∗log2FC in expression of this searched gene in stem-like cells from each diseased tissue sample relative to stem-like cells in normal samples in each tissue plotted against the malignancy continuum. Samples are colored based on if they are from different disease stage.

Top

Malignant transformation related pathway analysis

check buttonFind out the enriched GO biological processes and KEGG pathways involved in transition from healthy to precancer to cancer
check button Figure of enriched GO biological processes.
TissueDisease StageEnriched GO biological Processes
ColorectumADGO analysis - Figure of enriched GO biological processes: Top 15 enriched GO BP terms are showed in the bar plot of each disease state in each tissue. Each row represents a significant GO biological process which is colored according to the -log10(p.adjust).
ColorectumSERGO analysis - Figure of enriched GO biological processes: Top 15 enriched GO BP terms are showed in the bar plot of each disease state in each tissue. Each row represents a significant GO biological process which is colored according to the -log10(p.adjust).
ColorectumMSSGO analysis - Figure of enriched GO biological processes: Top 15 enriched GO BP terms are showed in the bar plot of each disease state in each tissue. Each row represents a significant GO biological process which is colored according to the -log10(p.adjust).
ColorectumMSI-HGO analysis - Figure of enriched GO biological processes: Top 15 enriched GO BP terms are showed in the bar plot of each disease state in each tissue. Each row represents a significant GO biological process which is colored according to the -log10(p.adjust).
ColorectumFAPGO analysis - Figure of enriched GO biological processes: Top 15 enriched GO BP terms are showed in the bar plot of each disease state in each tissue. Each row represents a significant GO biological process which is colored according to the -log10(p.adjust).
∗Top 15 enriched GO BP terms are showed in the bar plot of each disease state in each tissue. Each row represents a significant GO biological process which is colored according to the -log10(p.adjust).
Page: 1 2 3 4 5 6 7 8 9 

check button Enriched GO biological processes.
GO IDTissueDisease StageDescriptionGene RatioBg Ratiopvaluep.adjustCount
GO:00163114ColorectumCRCdephosphorylation79/2078417/187231.27e-067.21e-0579
GO:00064705ColorectumCRCprotein dephosphorylation57/2078281/187234.49e-061.87e-0457
GO:00353035ColorectumCRCregulation of dephosphorylation30/2078128/187235.27e-051.20e-0330
GO:0097720ColorectumCRCcalcineurin-mediated signaling13/207848/187231.72e-031.77e-0213
GO:00353045ColorectumCRCregulation of protein dephosphorylation20/207890/187231.77e-031.82e-0220
GO:0033173ColorectumCRCcalcineurin-NFAT signaling cascade12/207843/187231.93e-031.96e-0212
GO:00480161ColorectumCRCinositol phosphate-mediated signaling14/207855/187232.21e-032.15e-0214
GO:0070884ColorectumCRCregulation of calcineurin-NFAT signaling cascade10/207834/187232.96e-032.66e-0210
GO:0106056ColorectumCRCregulation of calcineurin-mediated signaling10/207835/187233.74e-033.14e-0210
GO:00353062ColorectumCRCpositive regulation of dephosphorylation14/207859/187234.42e-033.47e-0214
GO:000647017EsophagusHGINprotein dephosphorylation61/2587281/187231.86e-043.51e-0361
GO:003530425EsophagusHGINregulation of protein dephosphorylation24/258790/187239.27e-041.17e-0224
GO:003530320EsophagusHGINregulation of dephosphorylation29/2587128/187234.41e-033.87e-0229
GO:001631110EsophagusESCCdephosphorylation251/8552417/187231.26e-092.99e-08251
GO:000647018EsophagusESCCprotein dephosphorylation177/8552281/187233.13e-096.72e-08177
GO:0035304111EsophagusESCCregulation of protein dephosphorylation66/855290/187238.82e-081.48e-0666
GO:0035303111EsophagusESCCregulation of dephosphorylation88/8552128/187231.04e-071.71e-0688
GO:00353074EsophagusESCCpositive regulation of protein dephosphorylation31/855245/187231.40e-036.62e-0331
GO:00353066EsophagusESCCpositive regulation of dephosphorylation38/855259/187232.86e-031.21e-0238
GO:00353047LiverCirrhoticregulation of protein dephosphorylation39/463490/187238.57e-059.25e-0439
Page: 1 2 3 4 5 6 

check button Enriched KEGG pathways.
Pathway IDTissueDisease StageDescriptionGene RatioBg Ratiopvaluep.adjustqvalueCount
Page: 1 

Top

Cell-cell communication analysis

check buttonIdentification of potential cell-cell interactions between two cell types and their ligand-receptor pairs for different disease states
LigandReceptorLRpairPathwayTissueDisease Stage
Page: 1 

Top

Single-cell gene regulatory network inference analysis

check buttonFind out the significant the regulons (TFs) and the target genes of each regulon across cell types for different disease states
TFCell TypeTissueDisease StageTarget GeneRSSRegulon Activity
∗The dot plots of a searched regulon are shown for all cell subpopulations in each disease state of each tissue based on the regulon specific score inferred using pySCENIC and by calculating the average expression.
Page: 1 

Top

Somatic mutation of malignant transformation related genes

check buttonAnnotation of somatic variants for genes involved in malignant transformation
Hugo SymbolVariant ClassVariant ClassificationdbSNP RSHGVScHGVSpHGVSp ShortSWISSPROTBIOTYPESIFTPolyPhenTumor Sample BarcodeTissueHistologySexAgeStageTherapy TypesDrugsOutcome
CAMTA1SNVMissense_Mutationc.4546N>Gp.Leu1516Valp.L1516VQ9Y6Y1protein_codingdeleterious(0)probably_damaging(0.984)TCGA-5L-AAT1-01Breastbreast invasive carcinomaFemale<65III/IVHormone TherapyletrozolSD
CAMTA1SNVMissense_Mutationc.2635N>Cp.Glu879Glnp.E879QQ9Y6Y1protein_codingdeleterious(0)probably_damaging(0.996)TCGA-A8-A0A7-01Breastbreast invasive carcinomaFemale<65I/IIUnknownUnknownSD
CAMTA1SNVMissense_Mutationnovelc.148A>Cp.Lys50Glnp.K50QQ9Y6Y1protein_codingdeleterious(0)probably_damaging(0.915)TCGA-AN-A046-01Breastbreast invasive carcinomaFemale>=65I/IIUnknownUnknownSD
CAMTA1SNVMissense_Mutationnovelc.1369N>Tp.Pro457Serp.P457SQ9Y6Y1protein_codingtolerated_low_confidence(0.35)benign(0.003)TCGA-B6-A3ZX-01Breastbreast invasive carcinomaFemale<65III/IVChemotherapycyclophosphamidePD
CAMTA1SNVMissense_Mutationc.860C>Gp.Ser287Trpp.S287WQ9Y6Y1protein_codingdeleterious(0)probably_damaging(0.996)TCGA-BH-A0HK-01Breastbreast invasive carcinomaFemale>=65I/IIHormone TherapyarimidexSD
CAMTA1SNVMissense_Mutationnovelc.4383C>Gp.Asn1461Lysp.N1461KQ9Y6Y1protein_codingtolerated(0.05)benign(0.025)TCGA-BH-A18V-01Breastbreast invasive carcinomaFemale<65I/IIUnknownUnknownSD
CAMTA1SNVMissense_Mutationc.3028N>Ap.Gly1010Serp.G1010SQ9Y6Y1protein_codingtolerated(0.4)benign(0.014)TCGA-C8-A12V-01Breastbreast invasive carcinomaFemale<65I/IIUnknownUnknownSD
CAMTA1SNVMissense_Mutationc.403G>Cp.Glu135Glnp.E135QQ9Y6Y1protein_codingdeleterious(0)probably_damaging(0.996)TCGA-C8-A26Y-01Breastbreast invasive carcinomaFemale>=65I/IIUnknownUnknownSD
CAMTA1SNVMissense_Mutationrs771378439c.1246G>Ap.Ala416Thrp.A416TQ9Y6Y1protein_codingtolerated_low_confidence(0.13)benign(0.001)TCGA-LL-A7T0-01Breastbreast invasive carcinomaFemale>=65I/IIUnknownUnknownSD
CAMTA1insertionFrame_Shift_Insnovelc.1291_1292insAGAAAAGAAAAACCATCAGAGTTATAATp.Leu431GlnfsTer17p.L431Qfs*17Q9Y6Y1protein_codingTCGA-A2-A0EQ-01Breastbreast invasive carcinomaFemale<65I/IIChemotherapyadriamycinSD
Page: 1 2 3 4 5 6 7 8 9 10 11 12 13 14 15 16 17 18 19 20 21 22 23 

Top

Related drugs of malignant transformation related genes

check buttonIdentification of chemicals and drugs interact with genes involved in malignant transfromation
(DGIdb 4.0)
Entrez IDSymbolCategoryInteraction TypesDrug Claim NameDrug NamePMIDs
Page: 1