
|
|||||
|
 | |
| |
| |
| |
| |
| |
|
Gene: BCOR |
Gene summary for BCOR |
| Gene information | Species | Human | Gene symbol | BCOR | Gene ID | 54880 |
| Gene name | BCL6 corepressor | |
| Gene Alias | ANOP2 | |
| Cytomap | Xp11.4 | |
| Gene Type | protein-coding | GO ID | GO:0000122 | UniProtAcc | Q6W2J9 |
Top |
Malignant transformation analysis |
| Identification of the aberrant gene expression in precancerous and cancerous lesions by comparing the gene expression of stem-like cells in diseased tissues with normal stem cells |
| Entrez ID | Symbol | Replicates | Species | Organ | Tissue | Adj P-value | Log2FC | Malignancy |
| 54880 | BCOR | HTA11_347_2000001011 | Human | Colorectum | AD | 8.61e-03 | 1.04e-01 | -0.1954 |
| 54880 | BCOR | HTA11_99999965104_69814 | Human | Colorectum | MSS | 2.75e-02 | 1.74e-01 | 0.281 |
| 54880 | BCOR | A002-C-116 | Human | Colorectum | FAP | 3.14e-03 | 1.71e-01 | -0.0452 |
| 54880 | BCOR | NAFLD1 | Human | Liver | NAFLD | 3.58e-05 | 3.78e-01 | -0.04 |
| 54880 | BCOR | HCC1_Meng | Human | Liver | HCC | 5.65e-20 | -4.97e-03 | 0.0246 |
| 54880 | BCOR | HCC2_Meng | Human | Liver | HCC | 6.28e-09 | 3.83e-02 | 0.0107 |
| 54880 | BCOR | HCC2 | Human | Liver | HCC | 2.22e-02 | 1.94e+00 | 0.5341 |
| 54880 | BCOR | S014 | Human | Liver | HCC | 1.61e-08 | 3.92e-01 | 0.2254 |
| 54880 | BCOR | S015 | Human | Liver | HCC | 1.72e-04 | 2.59e-01 | 0.2375 |
| 54880 | BCOR | S016 | Human | Liver | HCC | 7.10e-11 | 3.24e-01 | 0.2243 |
| 54880 | BCOR | S027 | Human | Liver | HCC | 8.76e-06 | 3.95e-01 | 0.2446 |
| 54880 | BCOR | S028 | Human | Liver | HCC | 5.34e-06 | 3.97e-01 | 0.2503 |
| 54880 | BCOR | S029 | Human | Liver | HCC | 2.25e-12 | 5.53e-01 | 0.2581 |
| Page: 1 |
| Tissue | Expression Dynamics | Abbreviation |
| Colorectum (GSE201348) |  | FAP: Familial adenomatous polyposis |
| CRC: Colorectal cancer | ||
| Colorectum (HTA11) | 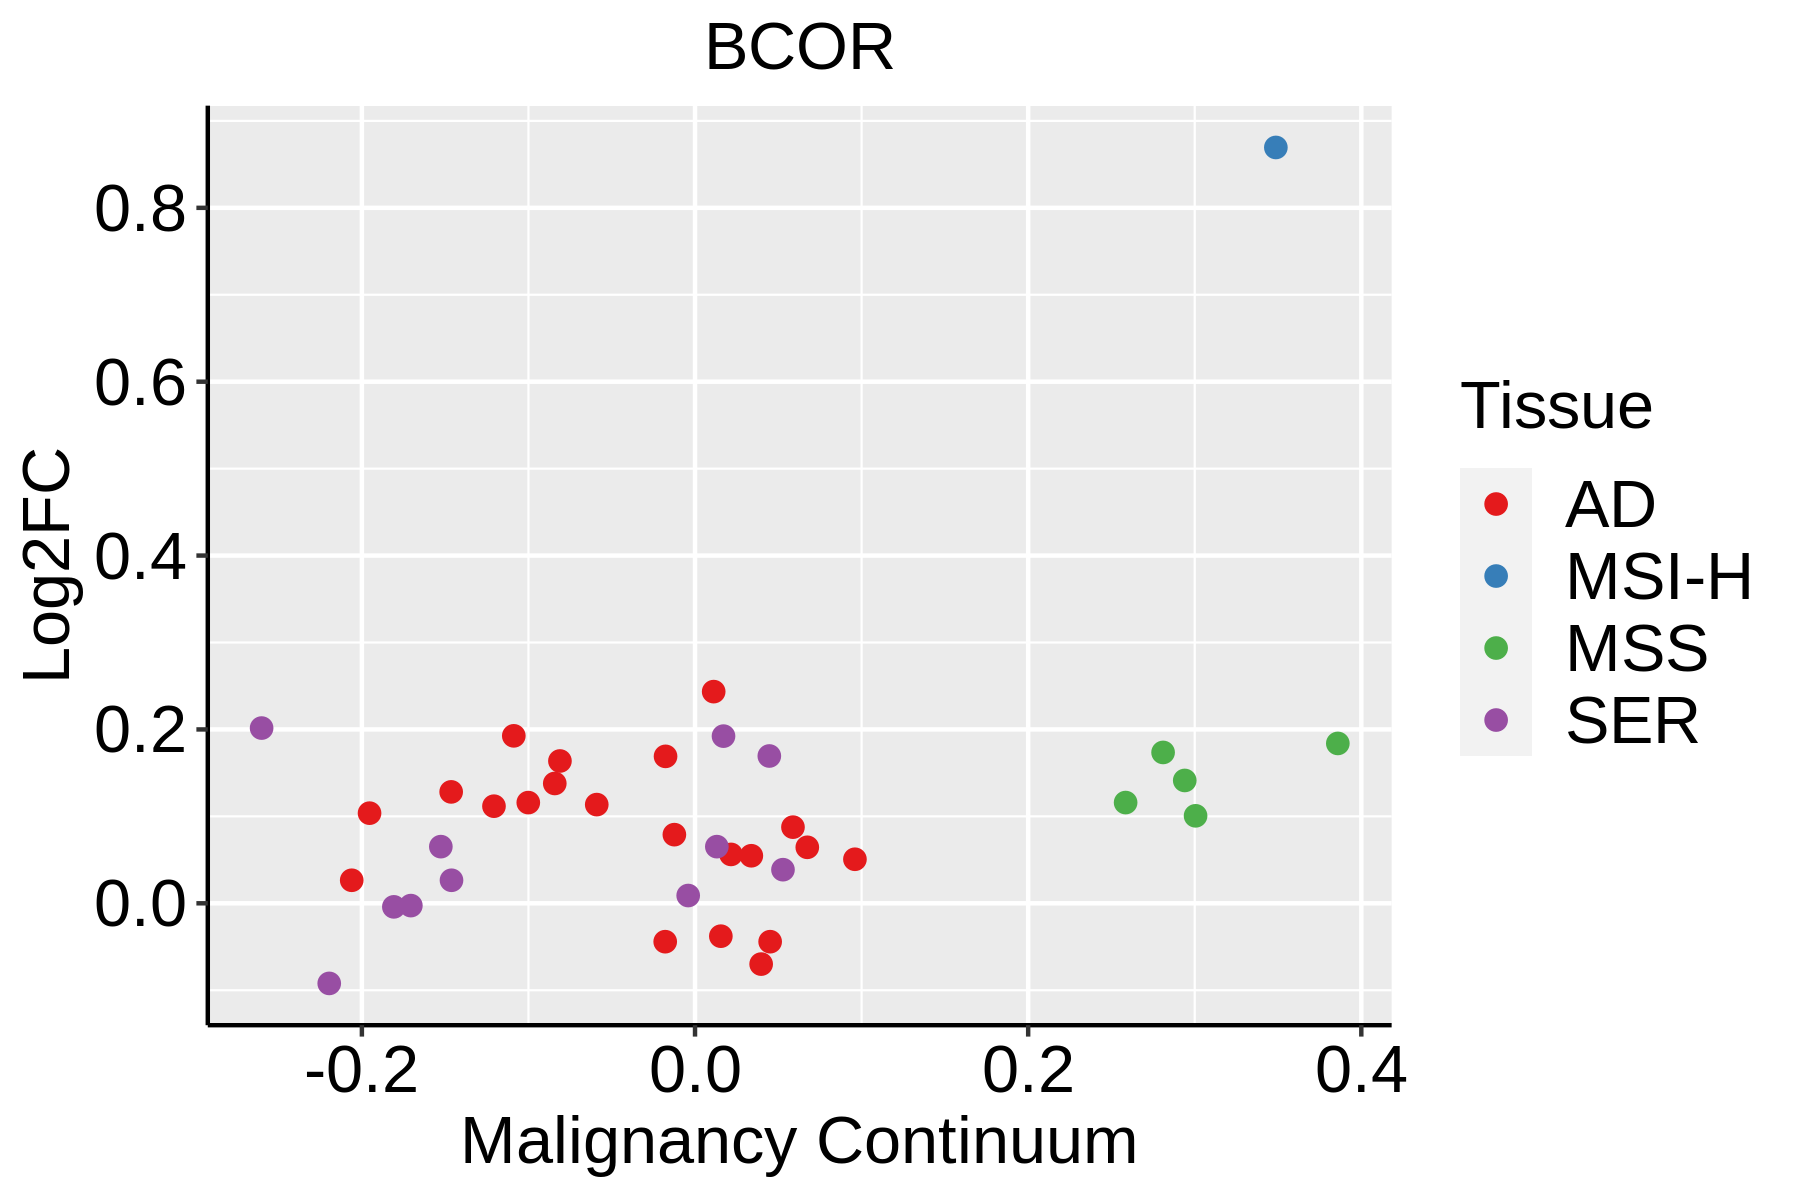 | AD: Adenomas |
| SER: Sessile serrated lesions | ||
| MSI-H: Microsatellite-high colorectal cancer | ||
| MSS: Microsatellite stable colorectal cancer | ||
| Liver | 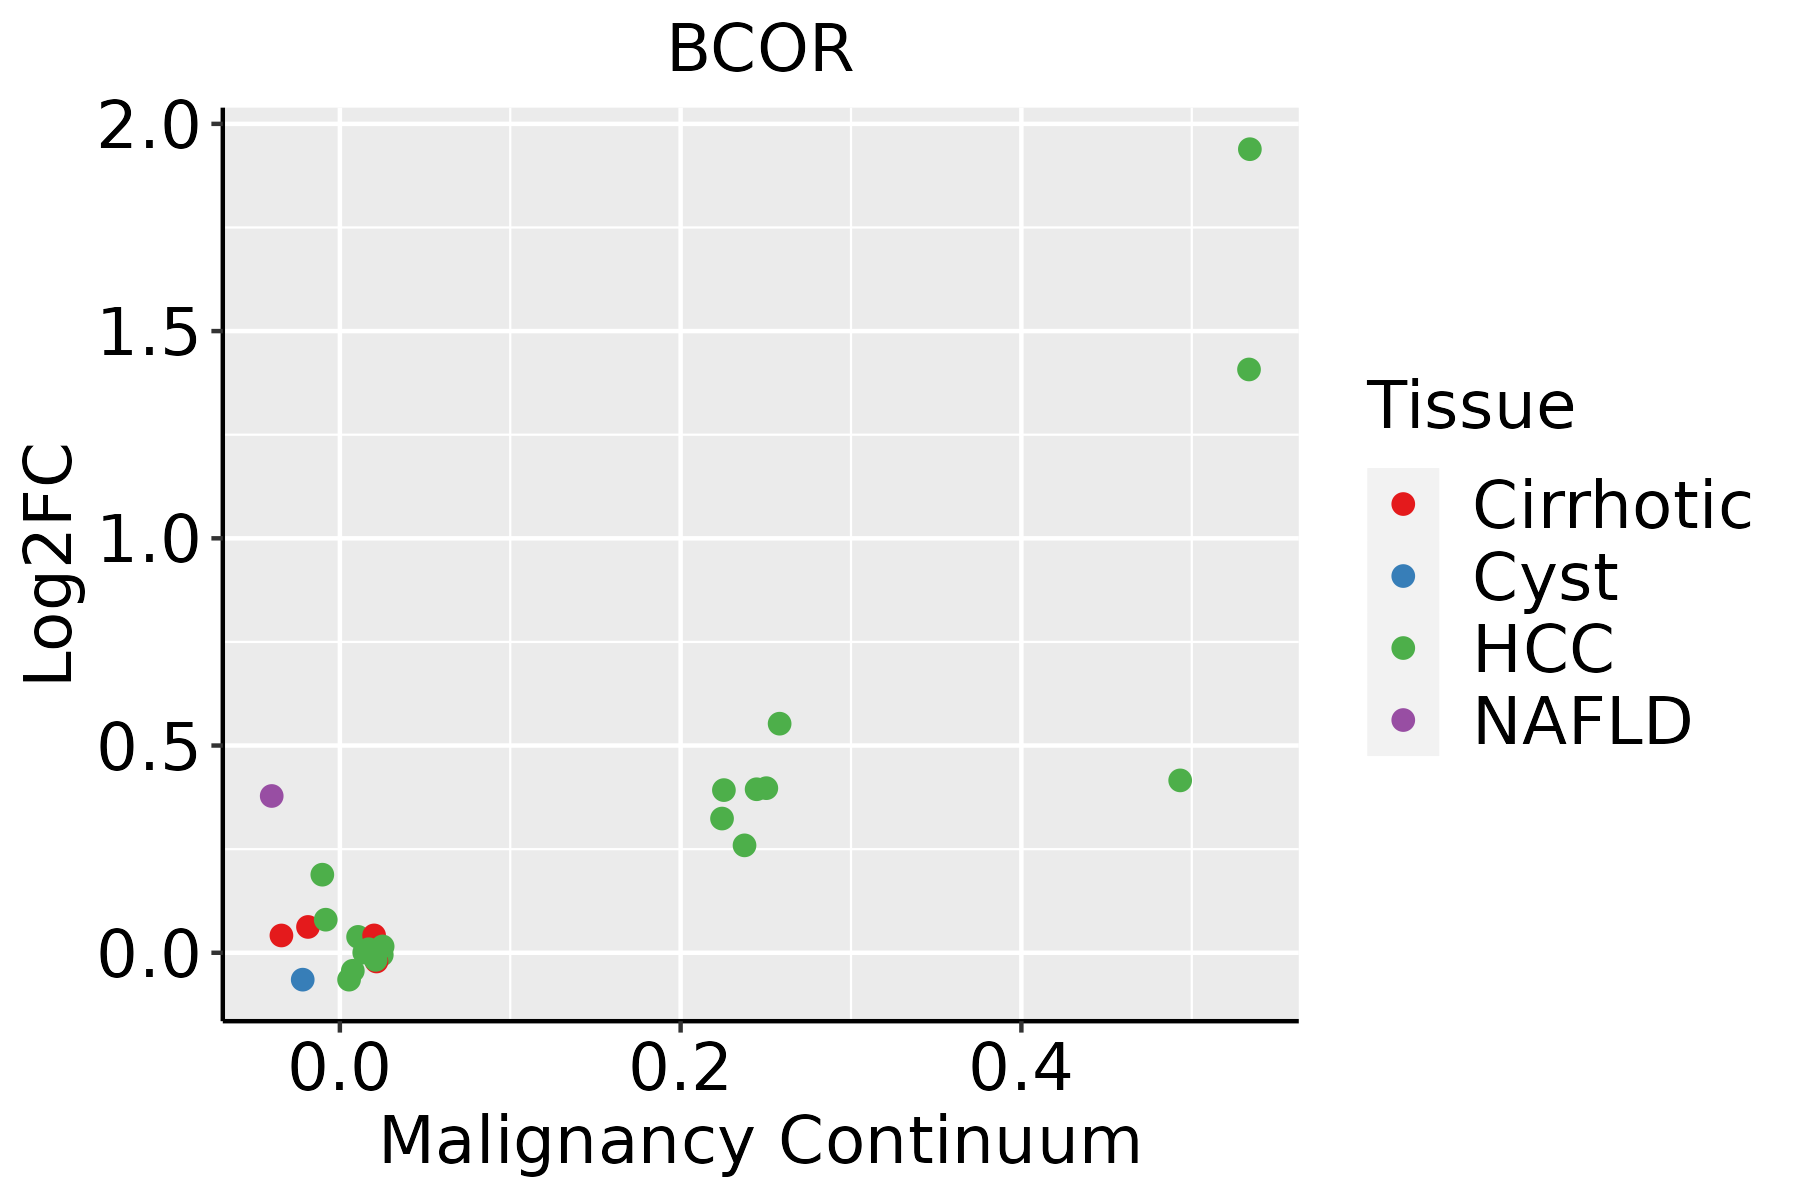 | HCC: Hepatocellular carcinoma |
| NAFLD: Non-alcoholic fatty liver disease |
| ∗log2FC in expression of this searched gene in stem-like cells from each diseased tissue sample relative to stem-like cells in normal samples in each tissue plotted against the malignancy continuum. Samples are colored based on if they are from different disease stage. |
Top |
Malignant transformation related pathway analysis |
| Find out the enriched GO biological processes and KEGG pathways involved in transition from healthy to precancer to cancer |
| Tissue | Disease Stage | Enriched GO biological Processes |
| Colorectum | AD |  |
| Colorectum | SER |  |
| Colorectum | MSS |  |
| Colorectum | MSI-H |  |
| Colorectum | FAP |  |
| ∗Top 15 enriched GO BP terms are showed in the bar plot of each disease state in each tissue. Each row represents a significant GO biological process which is colored according to the -log10(p.adjust). |
| Page: 1 2 3 4 5 6 7 8 9 |
| GO ID | Tissue | Disease Stage | Description | Gene Ratio | Bg Ratio | pvalue | p.adjust | Count |
| GO:00165741 | Colorectum | FAP | histone ubiquitination | 14/2622 | 47/18723 | 3.95e-03 | 2.75e-02 | 14 |
| GO:00065132 | Colorectum | FAP | protein monoubiquitination | 18/2622 | 67/18723 | 4.08e-03 | 2.81e-02 | 18 |
| GO:0030278 | Colorectum | FAP | regulation of ossification | 27/2622 | 115/18723 | 4.23e-03 | 2.90e-02 | 27 |
| GO:0034968 | Colorectum | FAP | histone lysine methylation | 27/2622 | 115/18723 | 4.23e-03 | 2.90e-02 | 27 |
| GO:0016571 | Colorectum | FAP | histone methylation | 31/2622 | 141/18723 | 6.47e-03 | 4.03e-02 | 31 |
| GO:00165703 | Liver | NAFLD | histone modification | 90/1882 | 463/18723 | 5.74e-10 | 1.28e-07 | 90 |
| GO:00104523 | Liver | NAFLD | histone H3-K36 methylation | 9/1882 | 15/18723 | 2.93e-06 | 1.21e-04 | 9 |
| GO:0018205 | Liver | NAFLD | peptidyl-lysine modification | 65/1882 | 376/18723 | 9.42e-06 | 3.02e-04 | 65 |
| GO:00165713 | Liver | NAFLD | histone methylation | 29/1882 | 141/18723 | 1.40e-04 | 2.63e-03 | 29 |
| GO:00349682 | Liver | NAFLD | histone lysine methylation | 24/1882 | 115/18723 | 4.06e-04 | 6.02e-03 | 24 |
| GO:00310563 | Liver | NAFLD | regulation of histone modification | 29/1882 | 152/18723 | 5.30e-04 | 7.31e-03 | 29 |
| GO:00064793 | Liver | NAFLD | protein methylation | 33/1882 | 181/18723 | 5.36e-04 | 7.35e-03 | 33 |
| GO:00082133 | Liver | NAFLD | protein alkylation | 33/1882 | 181/18723 | 5.36e-04 | 7.35e-03 | 33 |
| GO:0018022 | Liver | NAFLD | peptidyl-lysine methylation | 24/1882 | 131/18723 | 2.70e-03 | 2.47e-02 | 24 |
| GO:0043414 | Liver | NAFLD | macromolecule methylation | 47/1882 | 316/18723 | 4.08e-03 | 3.41e-02 | 47 |
| GO:00165743 | Liver | NAFLD | histone ubiquitination | 11/1882 | 47/18723 | 5.92e-03 | 4.47e-02 | 11 |
| GO:001657021 | Liver | HCC | histone modification | 283/7958 | 463/18723 | 2.68e-16 | 2.33e-14 | 283 |
| GO:00182052 | Liver | HCC | peptidyl-lysine modification | 230/7958 | 376/18723 | 1.51e-13 | 8.32e-12 | 230 |
| GO:003105621 | Liver | HCC | regulation of histone modification | 99/7958 | 152/18723 | 1.40e-08 | 3.40e-07 | 99 |
| GO:00434141 | Liver | HCC | macromolecule methylation | 183/7958 | 316/18723 | 2.00e-08 | 4.72e-07 | 183 |
| Page: 1 2 3 |
| Pathway ID | Tissue | Disease Stage | Description | Gene Ratio | Bg Ratio | pvalue | p.adjust | qvalue | Count |
| Page: 1 |
Top |
Cell-cell communication analysis |
| Identification of potential cell-cell interactions between two cell types and their ligand-receptor pairs for different disease states |
| Ligand | Receptor | LRpair | Pathway | Tissue | Disease Stage |
| Page: 1 |
Top |
Single-cell gene regulatory network inference analysis |
| Find out the significant the regulons (TFs) and the target genes of each regulon across cell types for different disease states |
| TF | Cell Type | Tissue | Disease Stage | Target Gene | RSS | Regulon Activity |
| ∗The dot plots of a searched regulon are shown for all cell subpopulations in each disease state of each tissue based on the regulon specific score inferred using pySCENIC and by calculating the average expression. |
| Page: 1 |
Top |
Somatic mutation of malignant transformation related genes |
| Annotation of somatic variants for genes involved in malignant transformation |
| Hugo Symbol | Variant Class | Variant Classification | dbSNP RS | HGVSc | HGVSp | HGVSp Short | SWISSPROT | BIOTYPE | SIFT | PolyPhen | Tumor Sample Barcode | Tissue | Histology | Sex | Age | Stage | Therapy Types | Drugs | Outcome |
| BCOR | SNV | Missense_Mutation | novel | c.976N>A | p.Pro326Thr | p.P326T | Q6W2J9 | protein_coding | tolerated(0.12) | possibly_damaging(0.873) | TCGA-A2-A25A-01 | Breast | breast invasive carcinoma | Female | <65 | I/II | Unspecific | Cytoxan | SD |
| BCOR | SNV | Missense_Mutation | rs775994643 | c.347C>T | p.Ser116Leu | p.S116L | Q6W2J9 | protein_coding | tolerated(0.07) | benign(0.054) | TCGA-AN-A046-01 | Breast | breast invasive carcinoma | Female | >=65 | I/II | Unknown | Unknown | SD |
| BCOR | SNV | Missense_Mutation | c.3362N>T | p.Ala1121Val | p.A1121V | Q6W2J9 | protein_coding | tolerated(0.34) | benign(0.001) | TCGA-AN-A0AK-01 | Breast | breast invasive carcinoma | Female | >=65 | I/II | Unknown | Unknown | SD | |
| BCOR | SNV | Missense_Mutation | c.1071N>A | p.Phe357Leu | p.F357L | Q6W2J9 | protein_coding | tolerated(0.11) | probably_damaging(0.977) | TCGA-AO-A0JD-01 | Breast | breast invasive carcinoma | Female | <65 | III/IV | Chemotherapy | cyclophosphamide | SD | |
| BCOR | SNV | Missense_Mutation | c.4880N>G | p.Asp1627Gly | p.D1627G | Q6W2J9 | protein_coding | deleterious(0.05) | benign(0.093) | TCGA-BH-A18G-01 | Breast | breast invasive carcinoma | Female | >=65 | I/II | Unknown | Unknown | SD | |
| BCOR | SNV | Missense_Mutation | c.3668N>T | p.Ser1223Leu | p.S1223L | Q6W2J9 | protein_coding | deleterious(0.04) | benign(0.356) | TCGA-E2-A15H-01 | Breast | breast invasive carcinoma | Female | <65 | I/II | Chemotherapy | herceptin | SD | |
| BCOR | SNV | Missense_Mutation | c.61C>T | p.Arg21Cys | p.R21C | Q6W2J9 | protein_coding | deleterious_low_confidence(0) | possibly_damaging(0.891) | TCGA-E2-A15S-01 | Breast | breast invasive carcinoma | Female | <65 | I/II | Chemotherapy | doxorubicin | SD | |
| BCOR | SNV | Missense_Mutation | c.3754N>G | p.Ile1252Val | p.I1252V | Q6W2J9 | protein_coding | tolerated(0.77) | benign(0.005) | TCGA-E2-A1BC-01 | Breast | breast invasive carcinoma | Female | <65 | I/II | Hormone Therapy | arimidex | SD | |
| BCOR | SNV | Missense_Mutation | novel | c.1374N>C | p.Met458Ile | p.M458I | Q6W2J9 | protein_coding | tolerated(0.6) | benign(0) | TCGA-E2-A1LE-01 | Breast | breast invasive carcinoma | Female | >=65 | III/IV | Chemotherapy | herceptin | PD |
| BCOR | SNV | Missense_Mutation | novel | c.401N>A | p.Ala134Asp | p.A134D | Q6W2J9 | protein_coding | tolerated(0.64) | benign(0.075) | TCGA-E9-A295-01 | Breast | breast invasive carcinoma | Female | >=65 | I/II | Hormone Therapy | tamoxiphen | SD |
| Page: 1 2 3 4 5 6 7 8 9 10 11 12 13 14 15 16 17 18 19 20 21 22 23 24 25 |
Top |
Related drugs of malignant transformation related genes |
| Identification of chemicals and drugs interact with genes involved in malignant transfromation |
| (DGIdb 4.0) |
| Entrez ID | Symbol | Category | Interaction Types | Drug Claim Name | Drug Name | PMIDs |
| 54880 | BCOR | CLINICALLY ACTIONABLE | N/A | 26150234,26098867,26573325,26516930 | ||
| 54880 | BCOR | CLINICALLY ACTIONABLE | Tretinoin | TRETINOIN | 25790901 |
| Page: 1 |

Copyright 2023-Present -The University of Texas Health Science Center at Houston |