| Tissue | Expression Dynamics | Abbreviation |
| Esophagus | 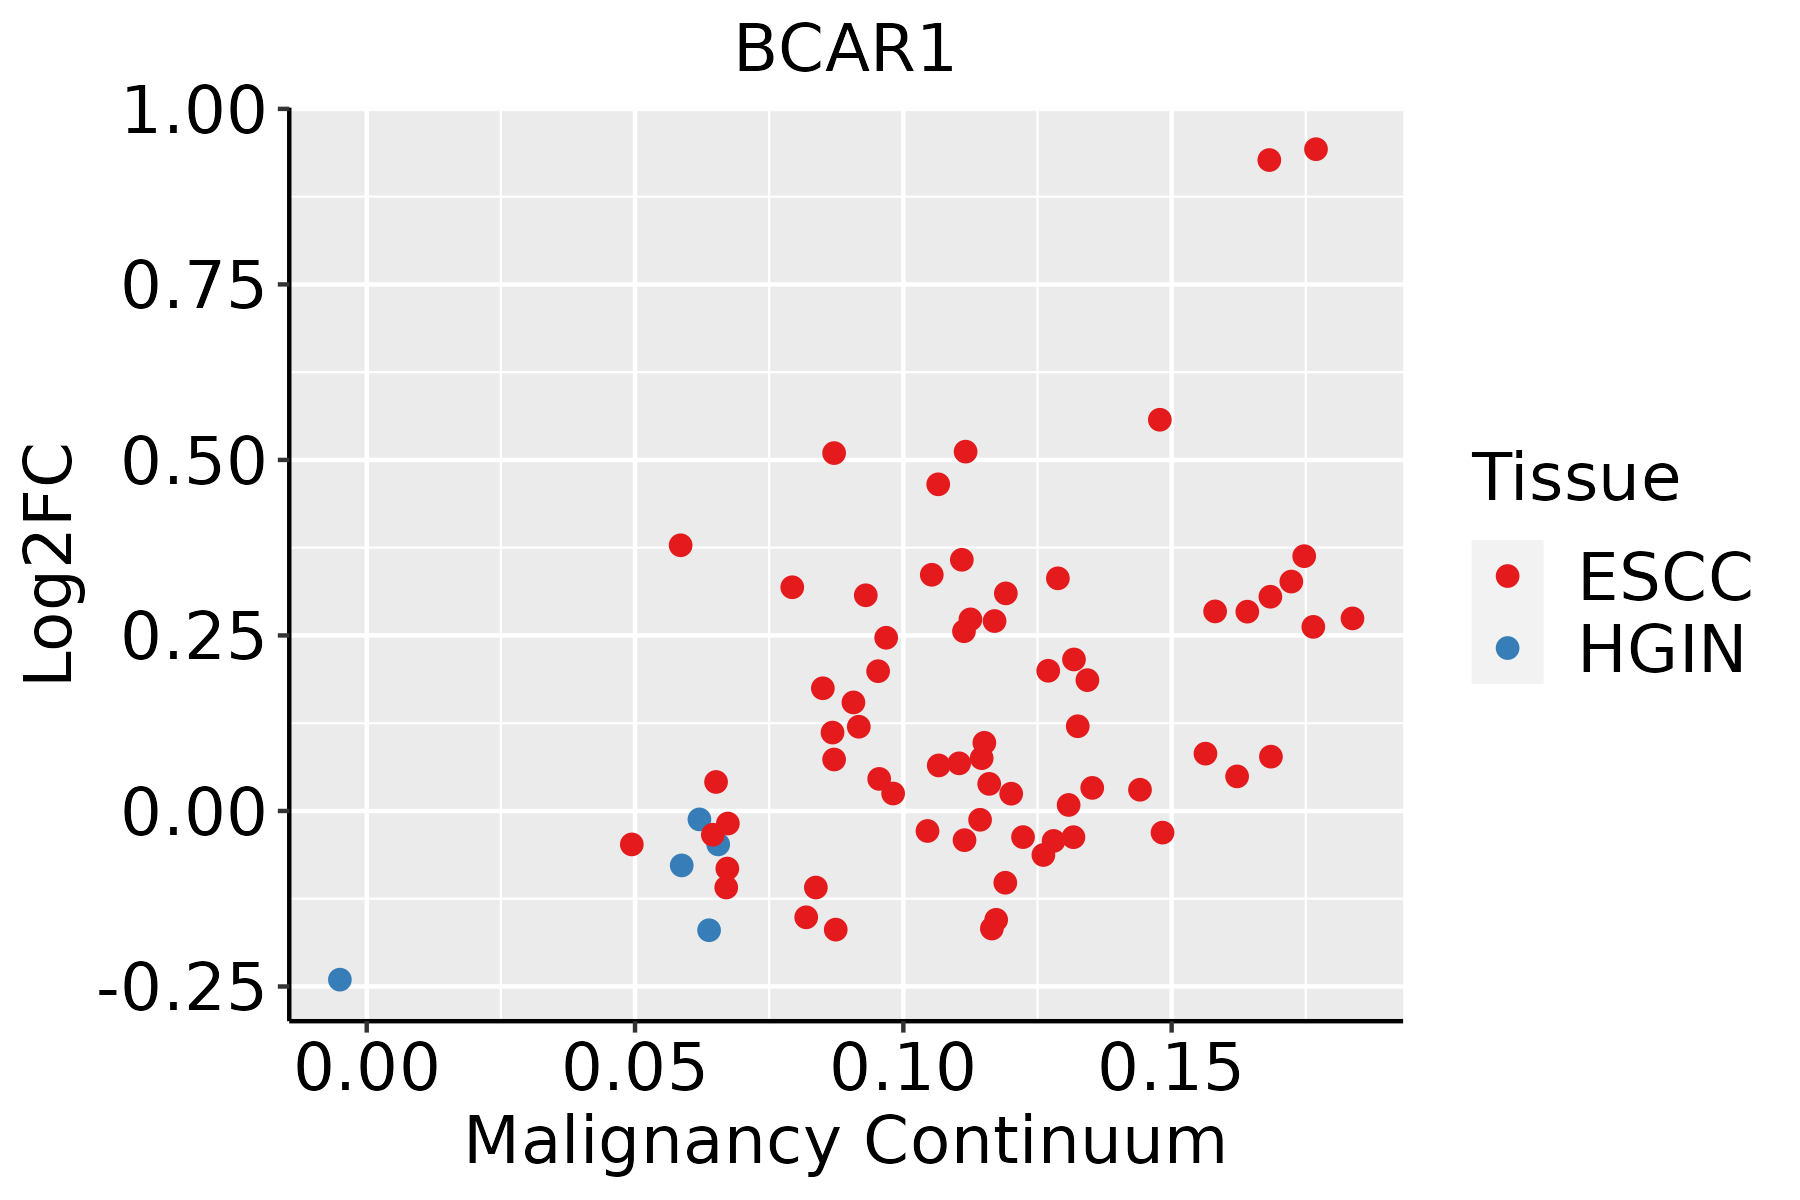 | ESCC: Esophageal squamous cell carcinoma |
| HGIN: High-grade intraepithelial neoplasias |
| LGIN: Low-grade intraepithelial neoplasias |
| Liver | 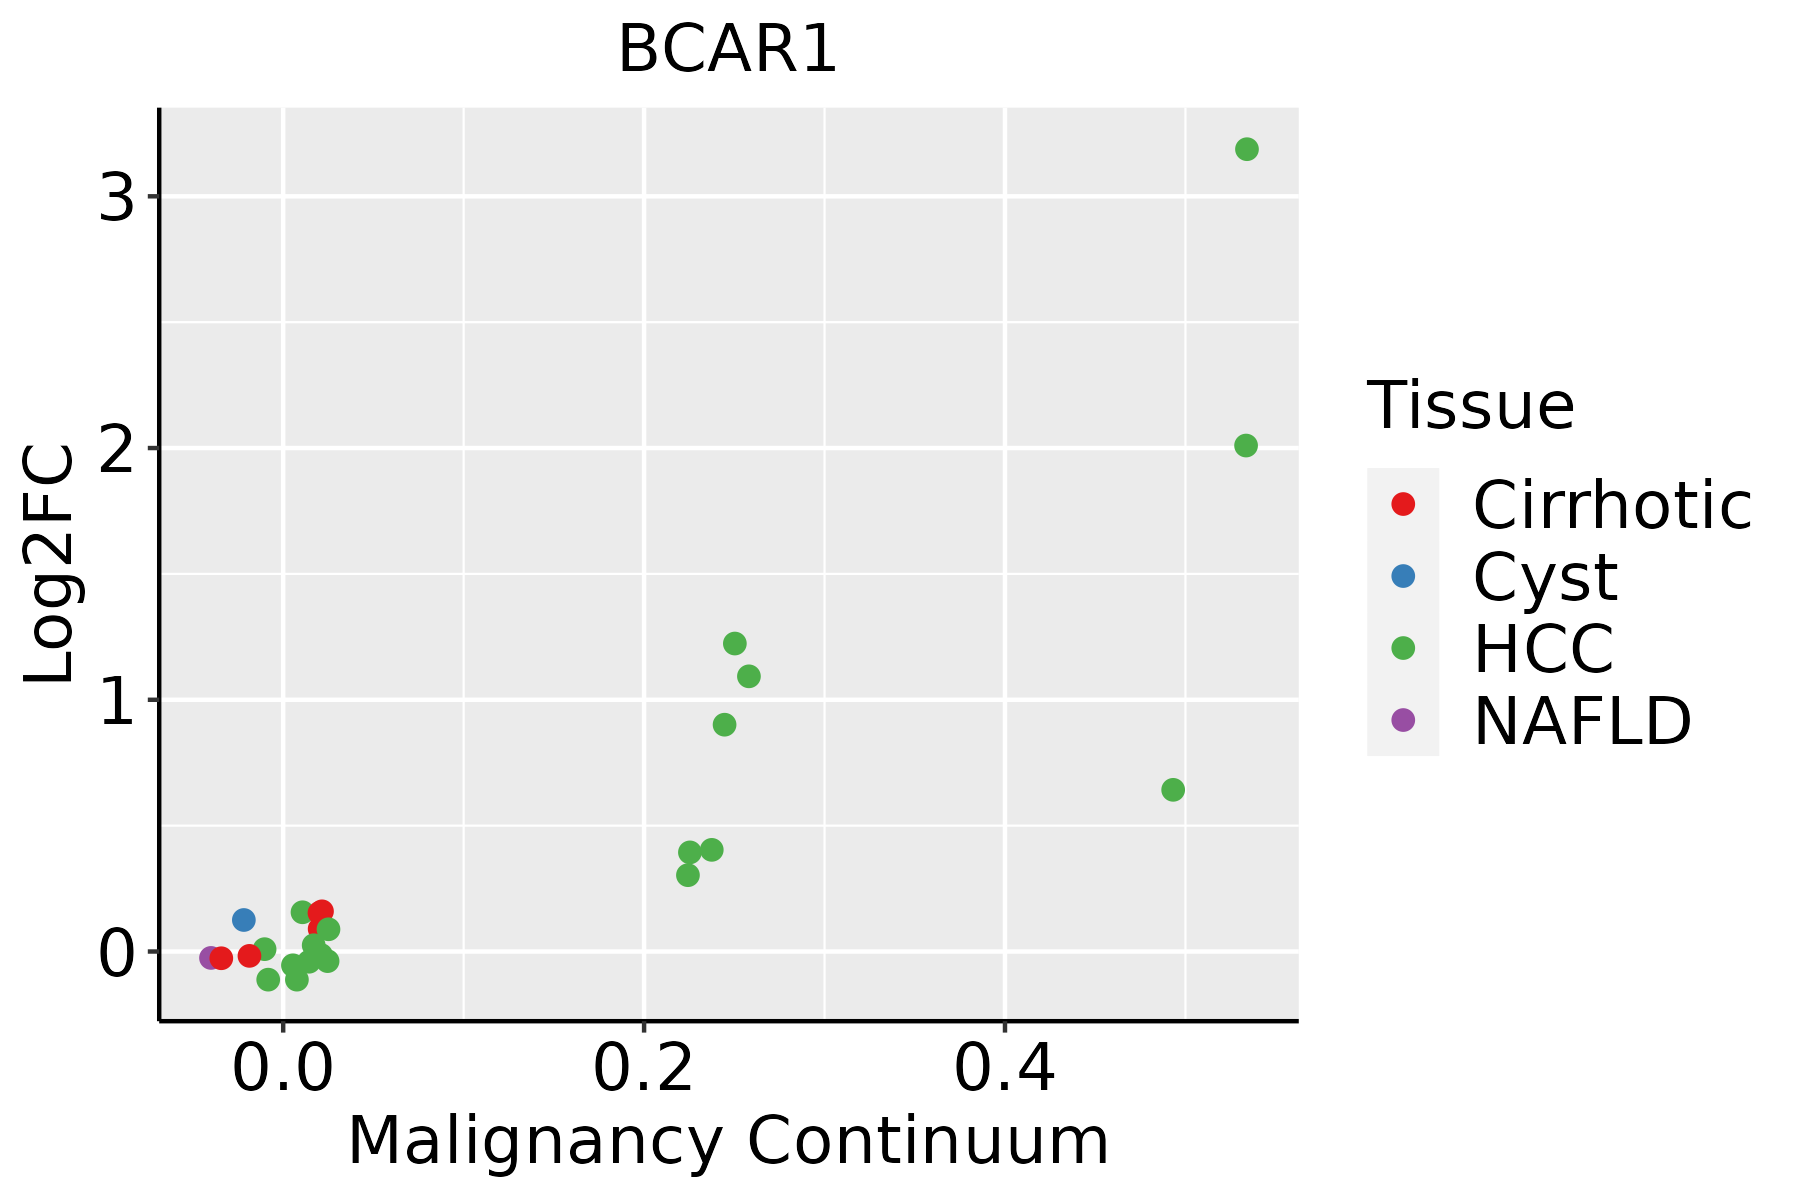 | HCC: Hepatocellular carcinoma |
| NAFLD: Non-alcoholic fatty liver disease |
| Oral Cavity | 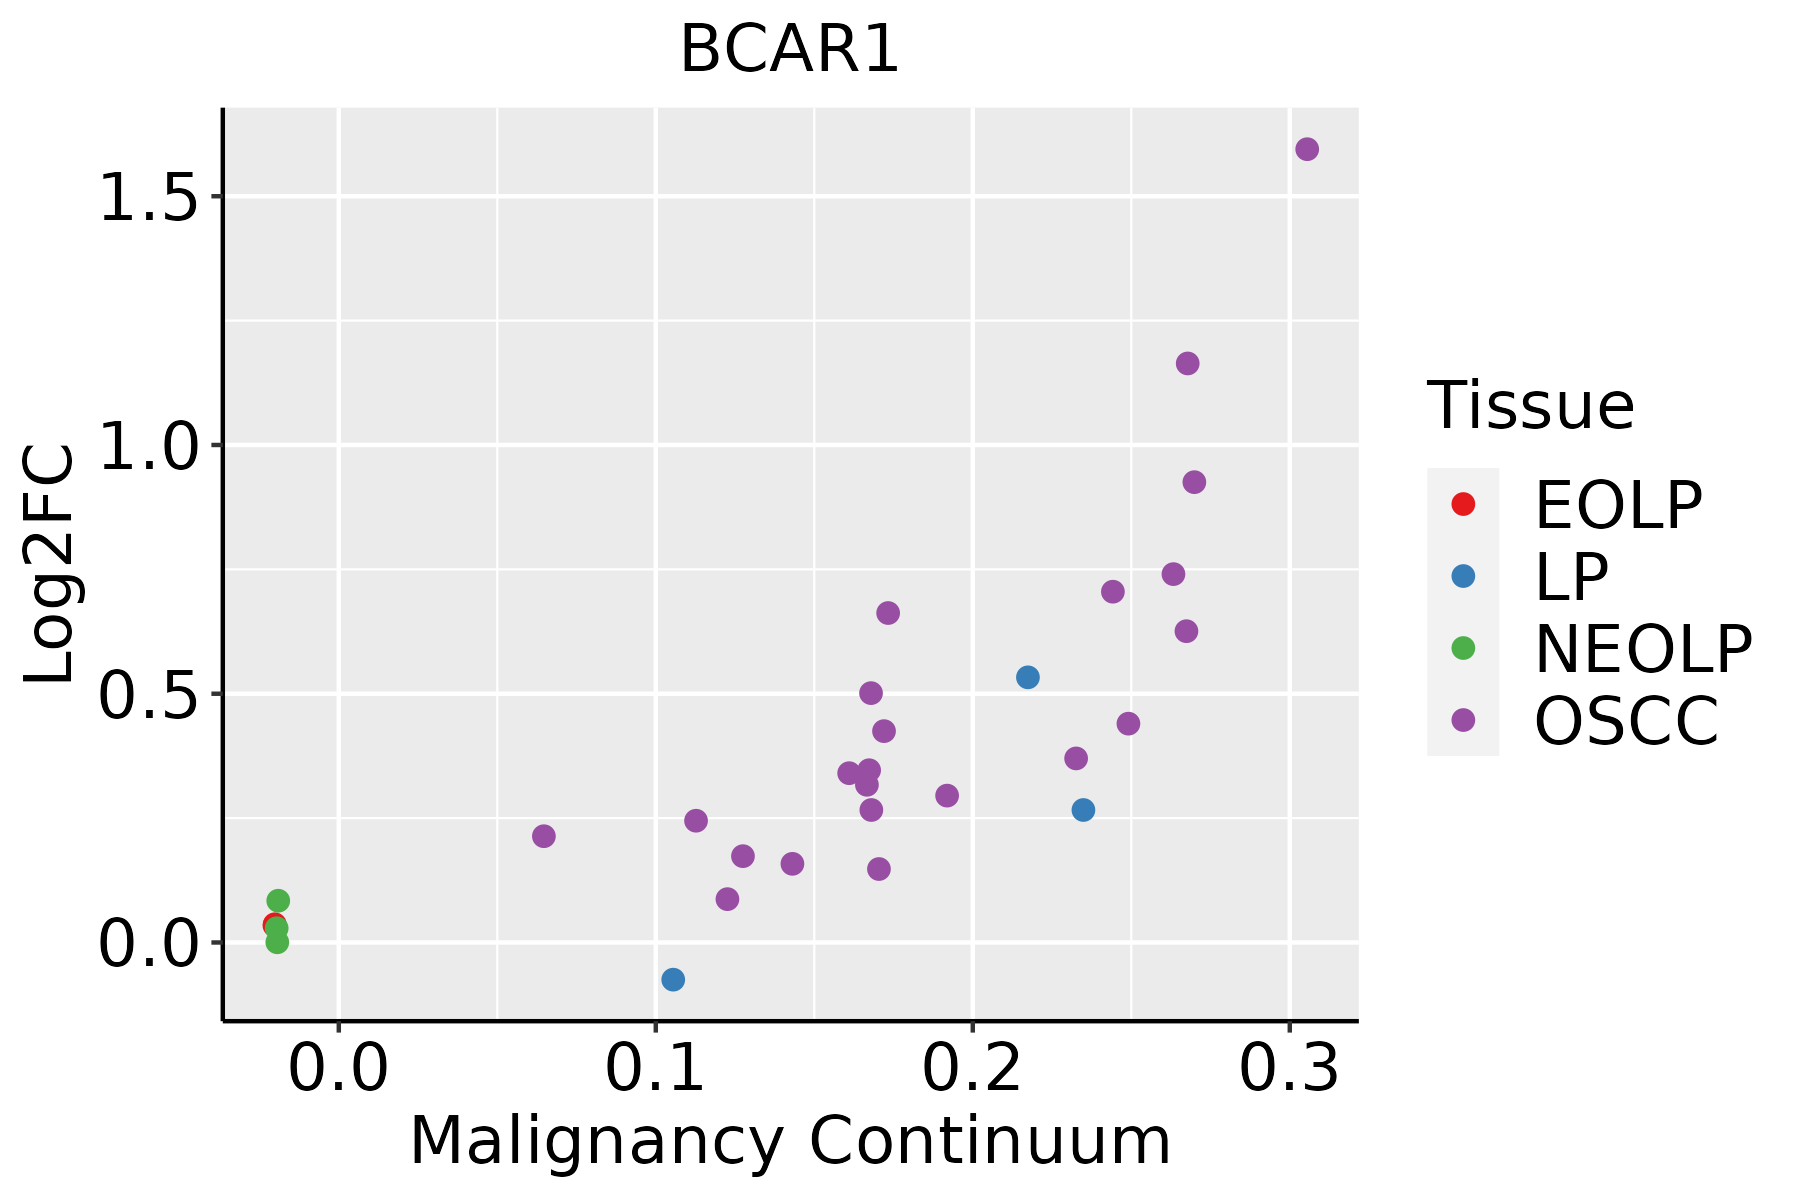 | EOLP: Erosive Oral lichen planus |
| LP: leukoplakia |
| NEOLP: Non-erosive oral lichen planus |
| OSCC: Oral squamous cell carcinoma |
| Skin | 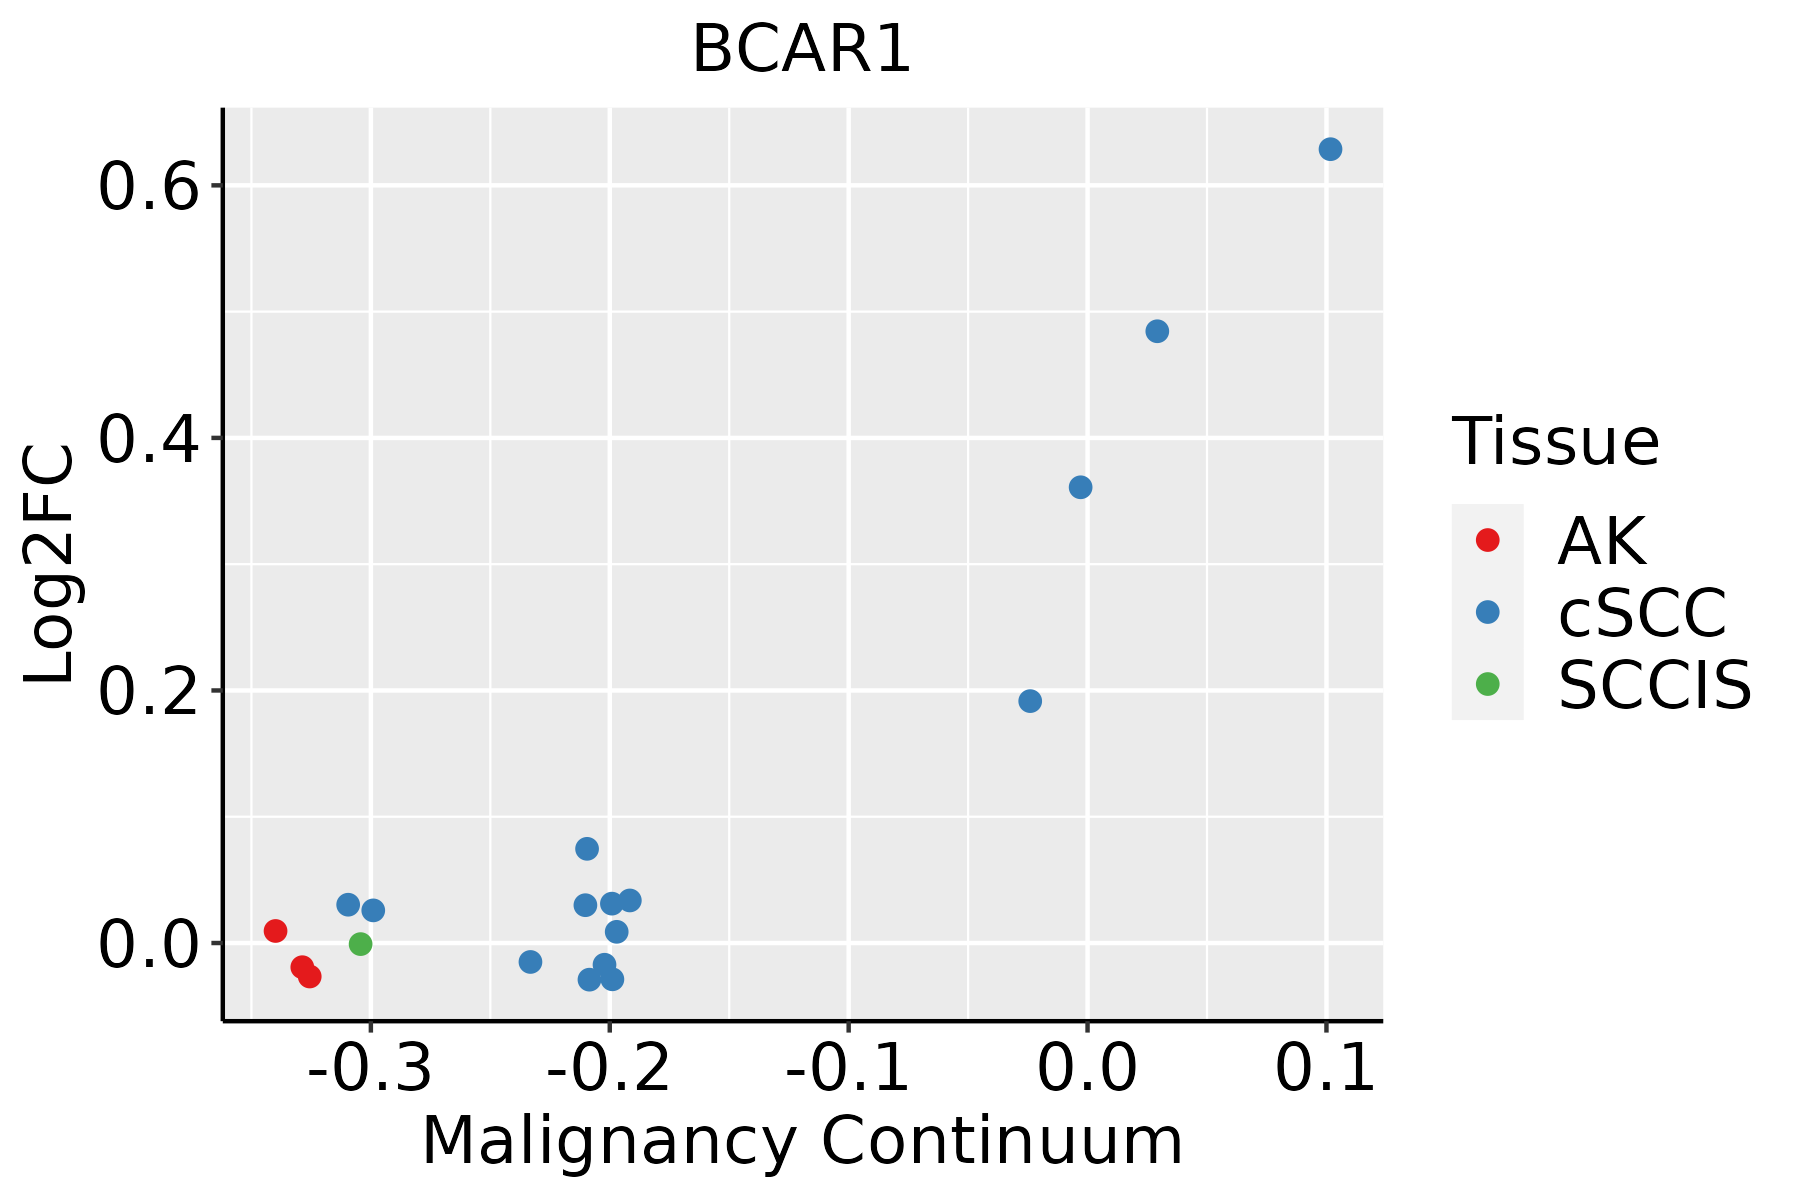 | AK: Actinic keratosis |
| cSCC: Cutaneous squamous cell carcinoma |
| SCCIS:squamous cell carcinoma in situ |
| Thyroid |  | ATC: Anaplastic thyroid cancer |
| HT: Hashimoto's thyroiditis |
| PTC: Papillary thyroid cancer |
| GO ID | Tissue | Disease Stage | Description | Gene Ratio | Bg Ratio | pvalue | p.adjust | Count |
| GO:000701512 | Liver | Cirrhotic | actin filament organization | 171/4634 | 442/18723 | 3.93e-11 | 2.30e-09 | 171 |
| GO:004343412 | Liver | Cirrhotic | response to peptide hormone | 149/4634 | 414/18723 | 1.70e-07 | 4.49e-06 | 149 |
| GO:007137511 | Liver | Cirrhotic | cellular response to peptide hormone stimulus | 110/4634 | 290/18723 | 3.73e-07 | 8.82e-06 | 110 |
| GO:190165311 | Liver | Cirrhotic | cellular response to peptide | 129/4634 | 359/18723 | 1.23e-06 | 2.49e-05 | 129 |
| GO:003286911 | Liver | Cirrhotic | cellular response to insulin stimulus | 80/4634 | 203/18723 | 2.55e-06 | 4.63e-05 | 80 |
| GO:001604911 | Liver | Cirrhotic | cell growth | 160/4634 | 482/18723 | 1.50e-05 | 2.07e-04 | 160 |
| GO:000722911 | Liver | Cirrhotic | integrin-mediated signaling pathway | 46/4634 | 107/18723 | 2.66e-05 | 3.42e-04 | 46 |
| GO:003286811 | Liver | Cirrhotic | response to insulin | 95/4634 | 264/18723 | 2.77e-05 | 3.54e-04 | 95 |
| GO:000155811 | Liver | Cirrhotic | regulation of cell growth | 132/4634 | 414/18723 | 5.53e-04 | 4.36e-03 | 132 |
| GO:00315326 | Liver | Cirrhotic | actin cytoskeleton reorganization | 42/4634 | 107/18723 | 6.28e-04 | 4.81e-03 | 42 |
| GO:003812711 | Liver | Cirrhotic | ERBB signaling pathway | 46/4634 | 121/18723 | 8.08e-04 | 5.93e-03 | 46 |
| GO:000828611 | Liver | Cirrhotic | insulin receptor signaling pathway | 44/4634 | 116/18723 | 1.09e-03 | 7.59e-03 | 44 |
| GO:000166712 | Liver | Cirrhotic | ameboidal-type cell migration | 145/4634 | 475/18723 | 2.23e-03 | 1.36e-02 | 145 |
| GO:00106327 | Liver | Cirrhotic | regulation of epithelial cell migration | 93/4634 | 292/18723 | 3.46e-03 | 1.92e-02 | 93 |
| GO:00106317 | Liver | Cirrhotic | epithelial cell migration | 110/4634 | 357/18723 | 5.14e-03 | 2.65e-02 | 110 |
| GO:000717311 | Liver | Cirrhotic | epidermal growth factor receptor signaling pathway | 39/4634 | 108/18723 | 5.49e-03 | 2.79e-02 | 39 |
| GO:00901327 | Liver | Cirrhotic | epithelium migration | 110/4634 | 360/18723 | 6.79e-03 | 3.35e-02 | 110 |
| GO:00901307 | Liver | Cirrhotic | tissue migration | 111/4634 | 365/18723 | 7.66e-03 | 3.61e-02 | 111 |
| GO:00106346 | Liver | Cirrhotic | positive regulation of epithelial cell migration | 58/4634 | 176/18723 | 8.54e-03 | 3.96e-02 | 58 |
| GO:003286821 | Liver | HCC | response to insulin | 172/7958 | 264/18723 | 7.14e-14 | 4.23e-12 | 172 |
| Pathway ID | Tissue | Disease Stage | Description | Gene Ratio | Bg Ratio | pvalue | p.adjust | qvalue | Count |
| hsa05131211 | Esophagus | ESCC | Shigellosis | 176/4205 | 247/8465 | 2.27e-12 | 4.01e-11 | 2.05e-11 | 176 |
| hsa0513526 | Esophagus | ESCC | Yersinia infection | 100/4205 | 137/8465 | 1.80e-08 | 1.59e-07 | 8.12e-08 | 100 |
| hsa05163210 | Esophagus | ESCC | Human cytomegalovirus infection | 148/4205 | 225/8465 | 5.73e-07 | 4.00e-06 | 2.05e-06 | 148 |
| hsa05100211 | Esophagus | ESCC | Bacterial invasion of epithelial cells | 59/4205 | 77/8465 | 1.05e-06 | 6.76e-06 | 3.46e-06 | 59 |
| hsa0451020 | Esophagus | ESCC | Focal adhesion | 127/4205 | 203/8465 | 1.25e-04 | 4.99e-04 | 2.56e-04 | 127 |
| hsa0481028 | Esophagus | ESCC | Regulation of actin cytoskeleton | 133/4205 | 229/8465 | 5.94e-03 | 1.48e-02 | 7.56e-03 | 133 |
| hsa05131310 | Esophagus | ESCC | Shigellosis | 176/4205 | 247/8465 | 2.27e-12 | 4.01e-11 | 2.05e-11 | 176 |
| hsa05135111 | Esophagus | ESCC | Yersinia infection | 100/4205 | 137/8465 | 1.80e-08 | 1.59e-07 | 8.12e-08 | 100 |
| hsa0516338 | Esophagus | ESCC | Human cytomegalovirus infection | 148/4205 | 225/8465 | 5.73e-07 | 4.00e-06 | 2.05e-06 | 148 |
| hsa05100310 | Esophagus | ESCC | Bacterial invasion of epithelial cells | 59/4205 | 77/8465 | 1.05e-06 | 6.76e-06 | 3.46e-06 | 59 |
| hsa04510111 | Esophagus | ESCC | Focal adhesion | 127/4205 | 203/8465 | 1.25e-04 | 4.99e-04 | 2.56e-04 | 127 |
| hsa04810112 | Esophagus | ESCC | Regulation of actin cytoskeleton | 133/4205 | 229/8465 | 5.94e-03 | 1.48e-02 | 7.56e-03 | 133 |
| hsa0451021 | Liver | Cirrhotic | Focal adhesion | 93/2530 | 203/8465 | 9.27e-07 | 1.10e-05 | 6.80e-06 | 93 |
| hsa0481021 | Liver | Cirrhotic | Regulation of actin cytoskeleton | 100/2530 | 229/8465 | 5.28e-06 | 5.50e-05 | 3.39e-05 | 100 |
| hsa0513122 | Liver | Cirrhotic | Shigellosis | 105/2530 | 247/8465 | 1.31e-05 | 1.21e-04 | 7.48e-05 | 105 |
| hsa0510014 | Liver | Cirrhotic | Bacterial invasion of epithelial cells | 40/2530 | 77/8465 | 3.92e-05 | 2.84e-04 | 1.75e-04 | 40 |
| hsa0467022 | Liver | Cirrhotic | Leukocyte transendothelial migration | 49/2530 | 114/8465 | 1.92e-03 | 8.55e-03 | 5.27e-03 | 49 |
| hsa0513522 | Liver | Cirrhotic | Yersinia infection | 57/2530 | 137/8465 | 2.16e-03 | 9.41e-03 | 5.80e-03 | 57 |
| hsa0516312 | Liver | Cirrhotic | Human cytomegalovirus infection | 87/2530 | 225/8465 | 2.67e-03 | 1.10e-02 | 6.76e-03 | 87 |
| hsa0451031 | Liver | Cirrhotic | Focal adhesion | 93/2530 | 203/8465 | 9.27e-07 | 1.10e-05 | 6.80e-06 | 93 |
| Hugo Symbol | Variant Class | Variant Classification | dbSNP RS | HGVSc | HGVSp | HGVSp Short | SWISSPROT | BIOTYPE | SIFT | PolyPhen | Tumor Sample Barcode | Tissue | Histology | Sex | Age | Stage | Therapy Types | Drugs | Outcome |
| BCAR1 | SNV | Missense_Mutation | novel | c.2377N>C | p.Tyr793His | p.Y793H | P56945 | protein_coding | deleterious(0) | probably_damaging(0.998) | TCGA-A2-A3Y0-01 | Breast | breast invasive carcinoma | Female | <65 | I/II | Chemotherapy | adriamycin | CR |
| BCAR1 | SNV | Missense_Mutation | | c.998N>G | p.Tyr333Cys | p.Y333C | P56945 | protein_coding | deleterious(0) | probably_damaging(0.993) | TCGA-AO-A128-01 | Breast | breast invasive carcinoma | Female | <65 | I/II | Chemotherapy | doxorubicin | SD |
| BCAR1 | SNV | Missense_Mutation | rs773405077 | c.848C>T | p.Pro283Leu | p.P283L | P56945 | protein_coding | deleterious(0) | probably_damaging(0.992) | TCGA-BH-A18G-01 | Breast | breast invasive carcinoma | Female | >=65 | I/II | Unknown | Unknown | SD |
| BCAR1 | SNV | Missense_Mutation | | c.2200N>G | p.Ile734Val | p.I734V | P56945 | protein_coding | deleterious(0) | possibly_damaging(0.881) | TCGA-E9-A1RF-01 | Breast | breast invasive carcinoma | Female | >=65 | III/IV | Hormone Therapy | tamoxiphen | SD |
| BCAR1 | insertion | Nonsense_Mutation | novel | c.1280_1281insCTCACAGCTGCCATAGGCTCAG | p.Gly428SerfsTer5 | p.G428Sfs*5 | P56945 | protein_coding | | | TCGA-A2-A0CU-01 | Breast | breast invasive carcinoma | Female | >=65 | I/II | Hormone Therapy | tamoxiphen | SD |
| BCAR1 | insertion | Frame_Shift_Ins | novel | c.2395_2396insGGCTTGGAGAAGACCCTTGCCCTGGGCAAGTGTGTCC | p.Ala799GlyfsTer67 | p.A799Gfs*67 | P56945 | protein_coding | | | TCGA-BH-A0B1-01 | Breast | breast invasive carcinoma | Female | >=65 | I/II | Chemotherapy | adriamycin | SD |
| BCAR1 | SNV | Missense_Mutation | rs763926002 | c.620C>T | p.Ala207Val | p.A207V | P56945 | protein_coding | tolerated(0.15) | benign(0.097) | TCGA-2W-A8YY-01 | Cervix | cervical & endocervical cancer | Female | <65 | I/II | Chemotherapy | cisplatin | CR |
| BCAR1 | SNV | Missense_Mutation | | c.1028N>G | p.Leu343Arg | p.L343R | P56945 | protein_coding | tolerated(0.09) | probably_damaging(0.991) | TCGA-A6-5665-01 | Colorectum | colon adenocarcinoma | Female | >=65 | I/II | Unknown | Unknown | PD |
| BCAR1 | SNV | Missense_Mutation | | c.314N>A | p.Arg105His | p.R105H | P56945 | protein_coding | deleterious(0) | probably_damaging(0.989) | TCGA-A6-5665-01 | Colorectum | colon adenocarcinoma | Female | >=65 | I/II | Unknown | Unknown | PD |
| BCAR1 | SNV | Missense_Mutation | novel | c.2433N>A | p.Phe811Leu | p.F811L | P56945 | protein_coding | tolerated(0.24) | probably_damaging(0.972) | TCGA-AA-A010-01 | Colorectum | colon adenocarcinoma | Female | <65 | I/II | Chemotherapy | folinic | CR |


