
|
|||||
|
 | |
| |
| |
| |
| |
| |
|
Gene: BANF1 |
Gene summary for BANF1 |
| Gene information | Species | Human | Gene symbol | BANF1 | Gene ID | 8815 |
| Gene name | BAF nuclear assembly factor 1 | |
| Gene Alias | BAF | |
| Cytomap | 11q13.1 | |
| Gene Type | protein-coding | GO ID | GO:0006323 | UniProtAcc | A0A024R5H0 |
Top |
Malignant transformation analysis |
| Identification of the aberrant gene expression in precancerous and cancerous lesions by comparing the gene expression of stem-like cells in diseased tissues with normal stem cells |
| Entrez ID | Symbol | Replicates | Species | Organ | Tissue | Adj P-value | Log2FC | Malignancy |
| 8815 | BANF1 | CA_HPV_1 | Human | Cervix | CC | 3.24e-04 | -1.11e-01 | 0.0264 |
| 8815 | BANF1 | CA_HPV_3 | Human | Cervix | CC | 7.75e-05 | 1.93e-01 | 0.0414 |
| 8815 | BANF1 | CCI_1 | Human | Cervix | CC | 1.10e-03 | -5.08e-01 | 0.528 |
| 8815 | BANF1 | CCI_3 | Human | Cervix | CC | 2.22e-06 | -5.22e-01 | 0.516 |
| 8815 | BANF1 | CCII_1 | Human | Cervix | CC | 1.00e-11 | -5.46e-01 | 0.3249 |
| 8815 | BANF1 | L1 | Human | Cervix | CC | 2.89e-06 | 1.73e-02 | 0.0802 |
| 8815 | BANF1 | T3 | Human | Cervix | CC | 7.60e-03 | 1.51e-01 | 0.1389 |
| 8815 | BANF1 | HTA11_3410_2000001011 | Human | Colorectum | AD | 6.70e-19 | 4.06e-01 | 0.0155 |
| 8815 | BANF1 | HTA11_2487_2000001011 | Human | Colorectum | SER | 4.45e-16 | 4.86e-01 | -0.1808 |
| 8815 | BANF1 | HTA11_2951_2000001011 | Human | Colorectum | AD | 1.20e-03 | 4.07e-01 | 0.0216 |
| 8815 | BANF1 | HTA11_1938_2000001011 | Human | Colorectum | AD | 3.37e-20 | 6.74e-01 | -0.0811 |
| 8815 | BANF1 | HTA11_78_2000001011 | Human | Colorectum | AD | 8.11e-06 | 2.50e-01 | -0.1088 |
| 8815 | BANF1 | HTA11_347_2000001011 | Human | Colorectum | AD | 2.89e-19 | 4.52e-01 | -0.1954 |
| 8815 | BANF1 | HTA11_411_2000001011 | Human | Colorectum | SER | 3.59e-05 | 5.67e-01 | -0.2602 |
| 8815 | BANF1 | HTA11_2112_2000001011 | Human | Colorectum | SER | 2.32e-02 | 3.03e-01 | -0.2196 |
| 8815 | BANF1 | HTA11_3361_2000001011 | Human | Colorectum | AD | 7.70e-13 | 4.95e-01 | -0.1207 |
| 8815 | BANF1 | HTA11_83_2000001011 | Human | Colorectum | SER | 2.78e-11 | 5.19e-01 | -0.1526 |
| 8815 | BANF1 | HTA11_696_2000001011 | Human | Colorectum | AD | 3.69e-24 | 5.20e-01 | -0.1464 |
| 8815 | BANF1 | HTA11_866_2000001011 | Human | Colorectum | AD | 6.55e-09 | 3.53e-01 | -0.1001 |
| 8815 | BANF1 | HTA11_1391_2000001011 | Human | Colorectum | AD | 5.94e-30 | 7.75e-01 | -0.059 |
| Page: 1 2 3 4 5 6 7 8 9 10 11 |
| Tissue | Expression Dynamics | Abbreviation |
| Cervix | 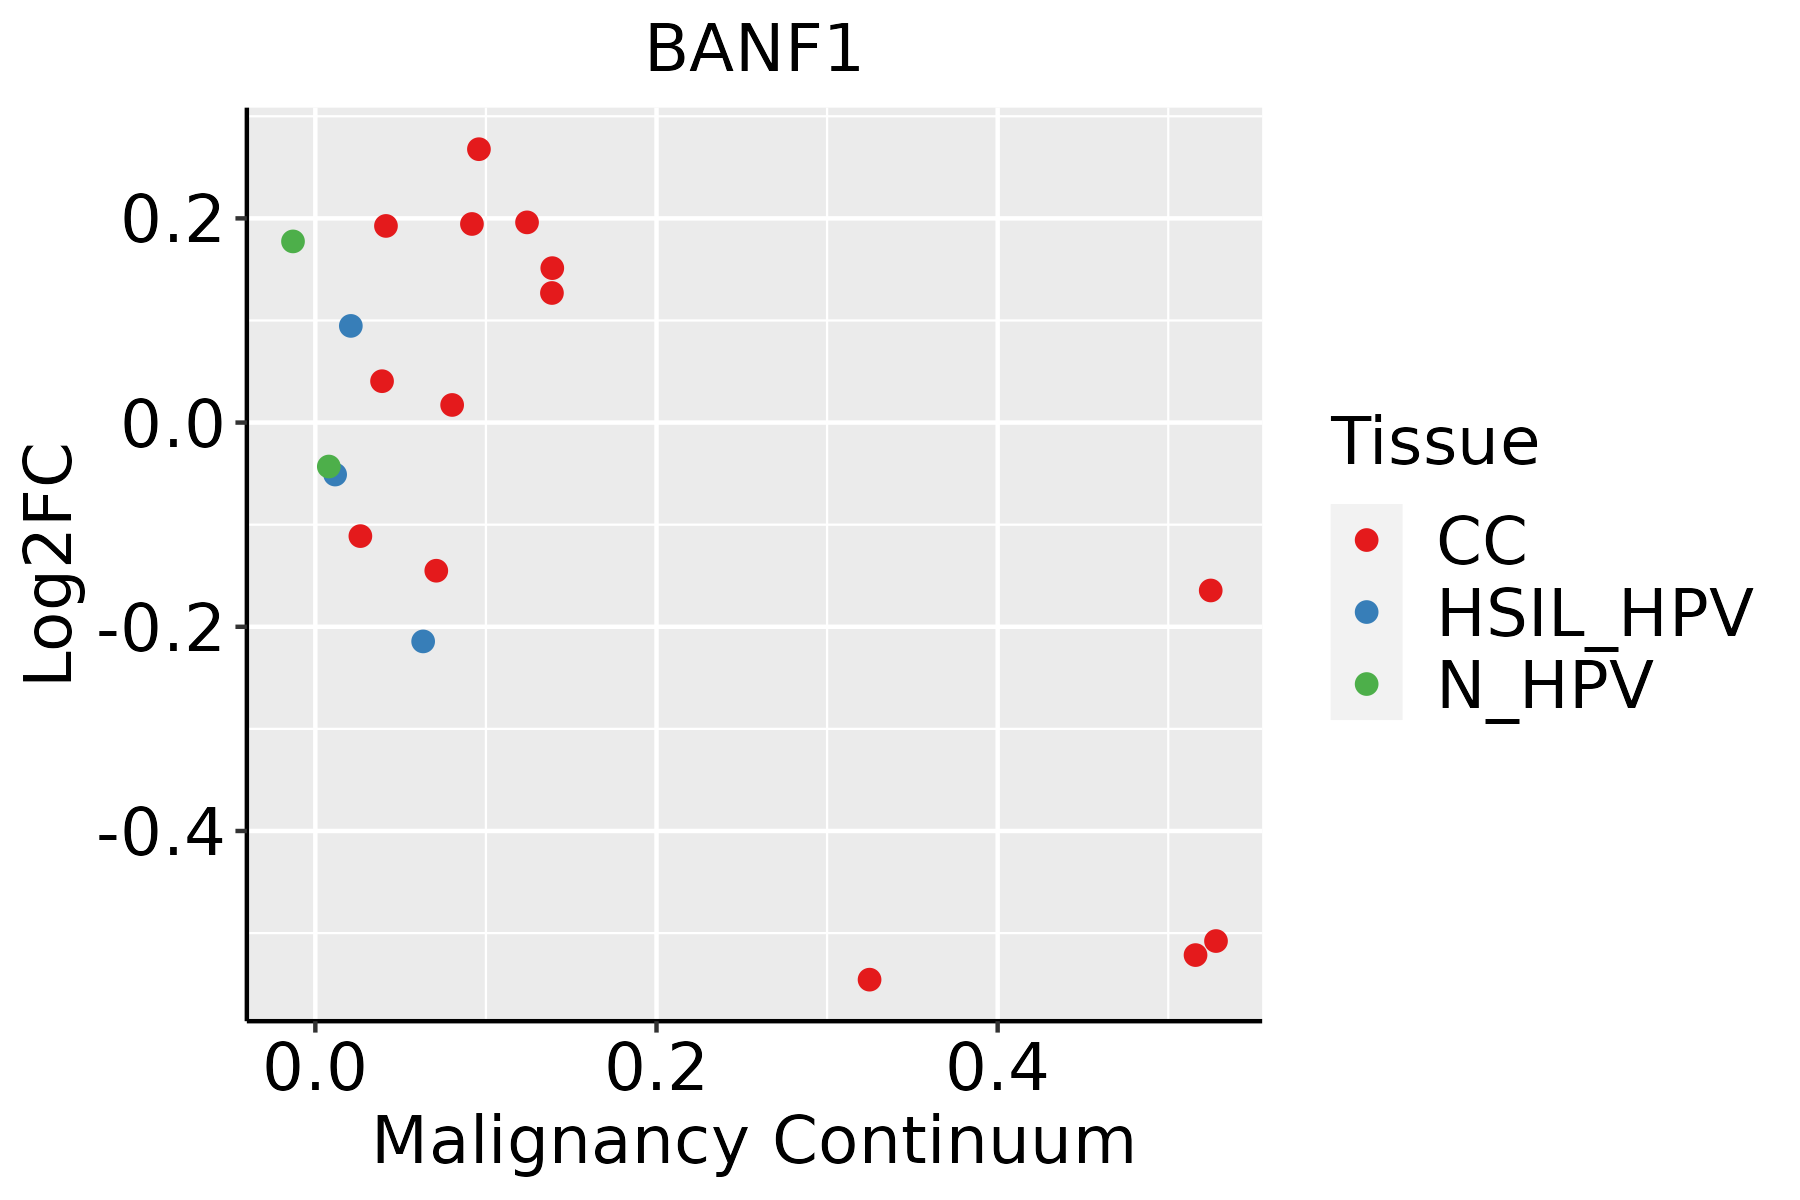 | CC: Cervix cancer |
| HSIL_HPV: HPV-infected high-grade squamous intraepithelial lesions | ||
| N_HPV: HPV-infected normal cervix | ||
| Colorectum (GSE201348) |  | FAP: Familial adenomatous polyposis |
| CRC: Colorectal cancer | ||
| Colorectum (HTA11) | 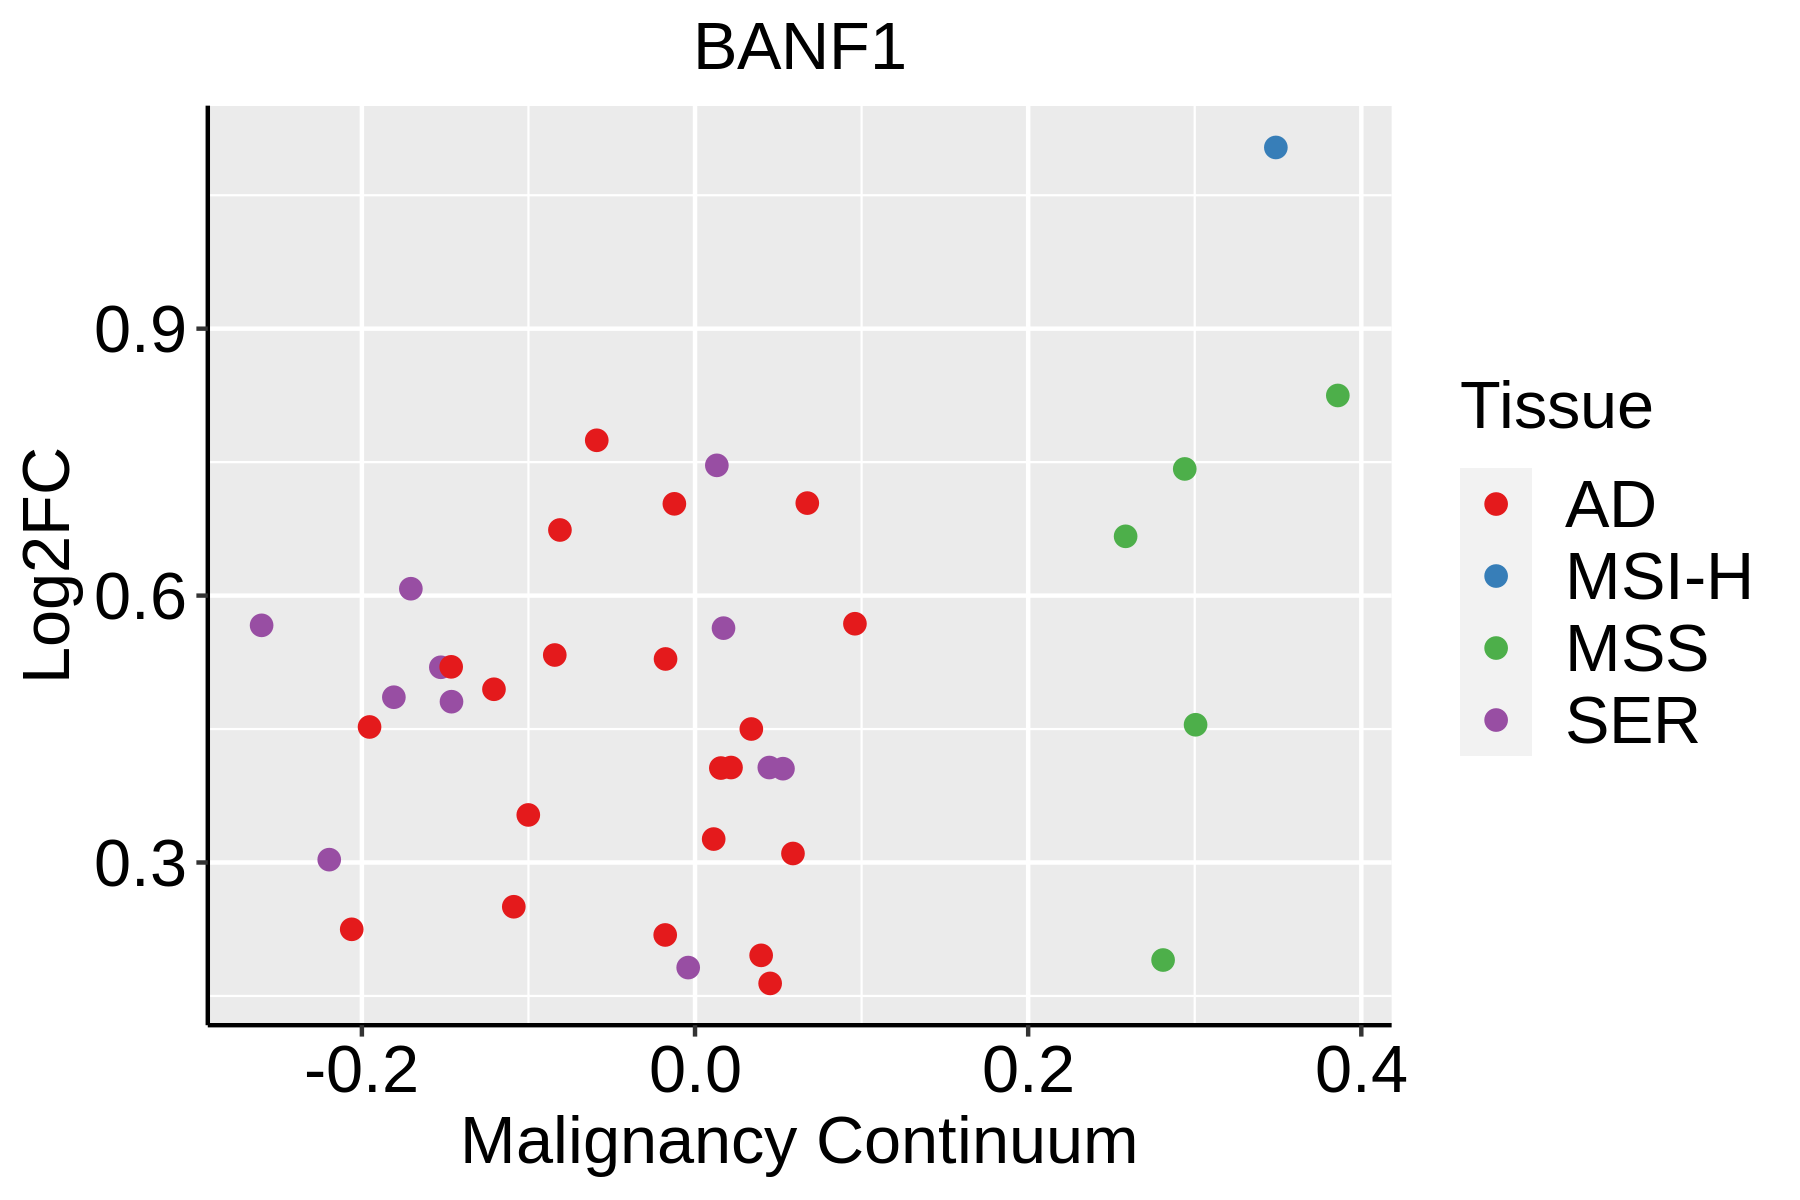 | AD: Adenomas |
| SER: Sessile serrated lesions | ||
| MSI-H: Microsatellite-high colorectal cancer | ||
| MSS: Microsatellite stable colorectal cancer | ||
| Endometrium | 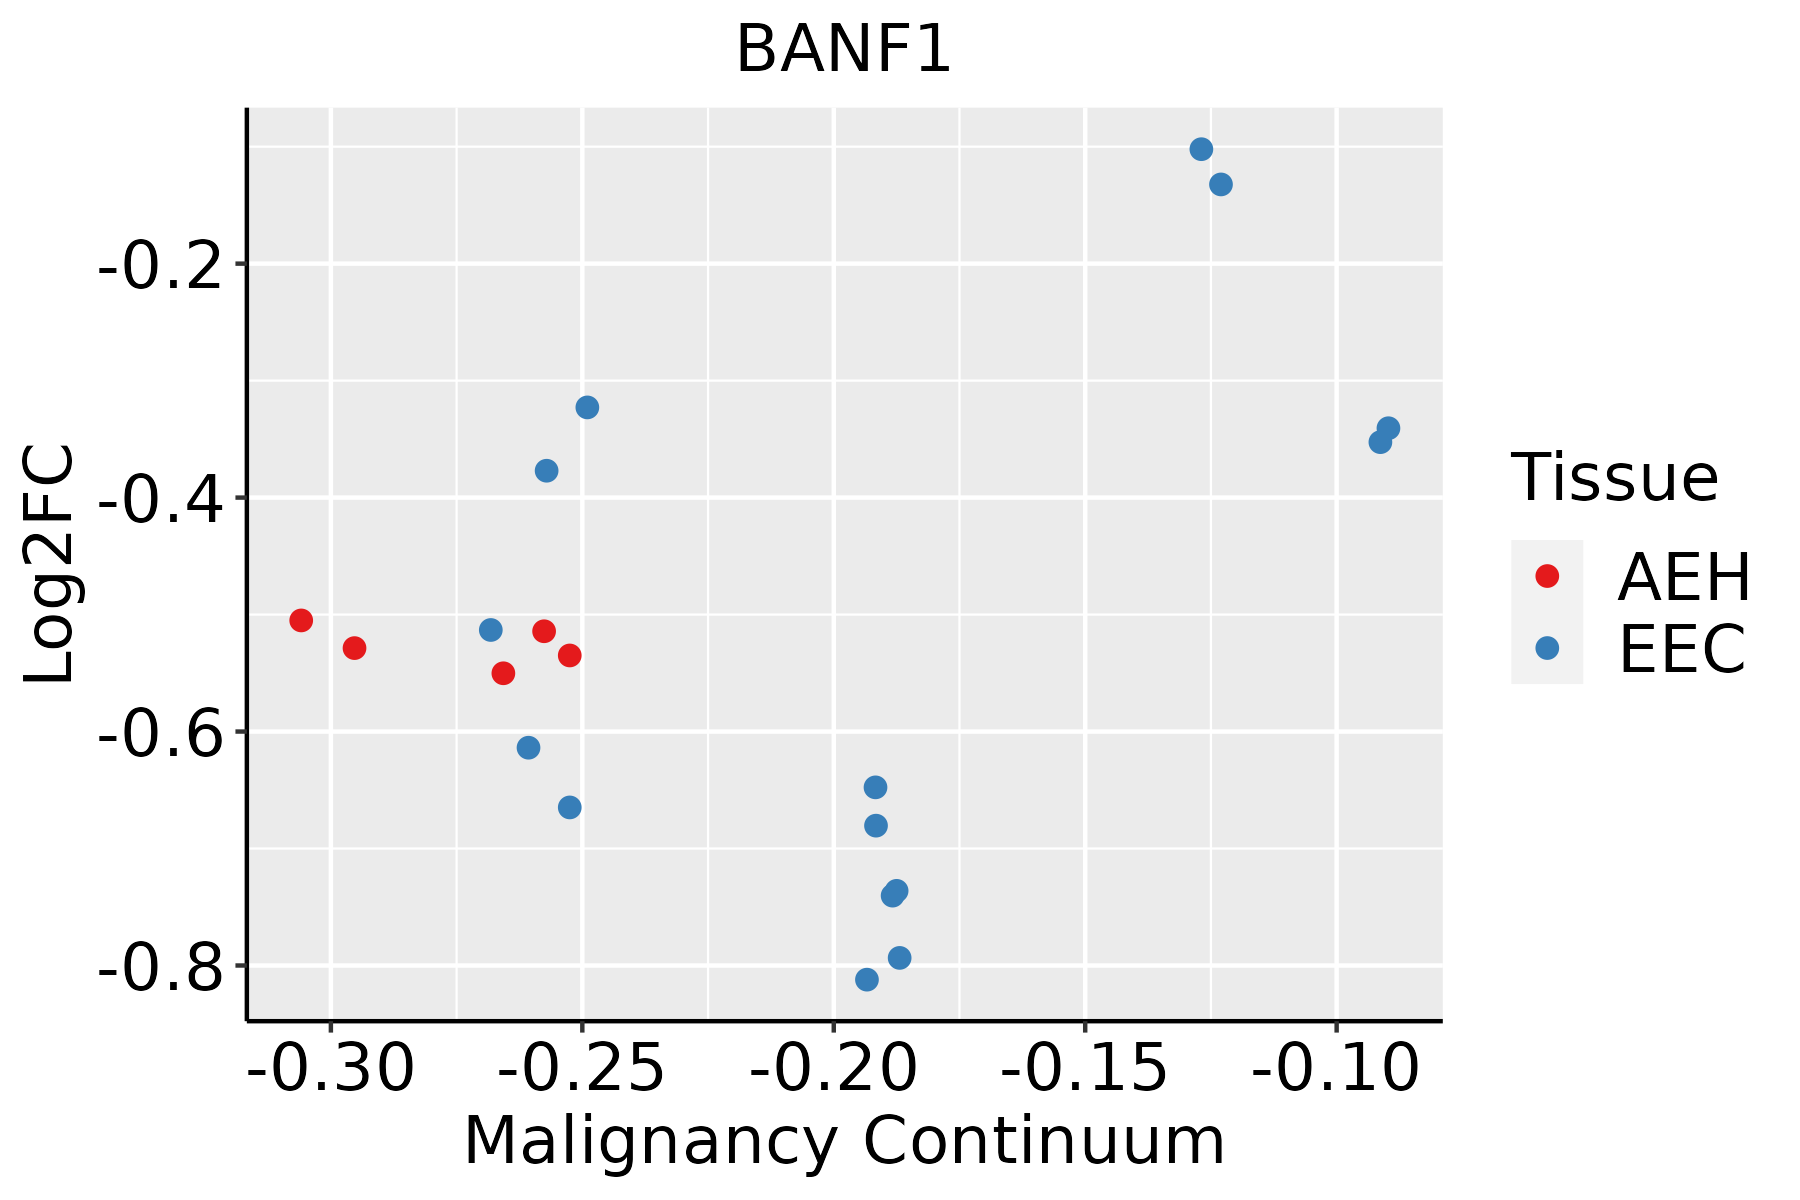 | AEH: Atypical endometrial hyperplasia |
| EEC: Endometrioid Cancer | ||
| Esophagus | 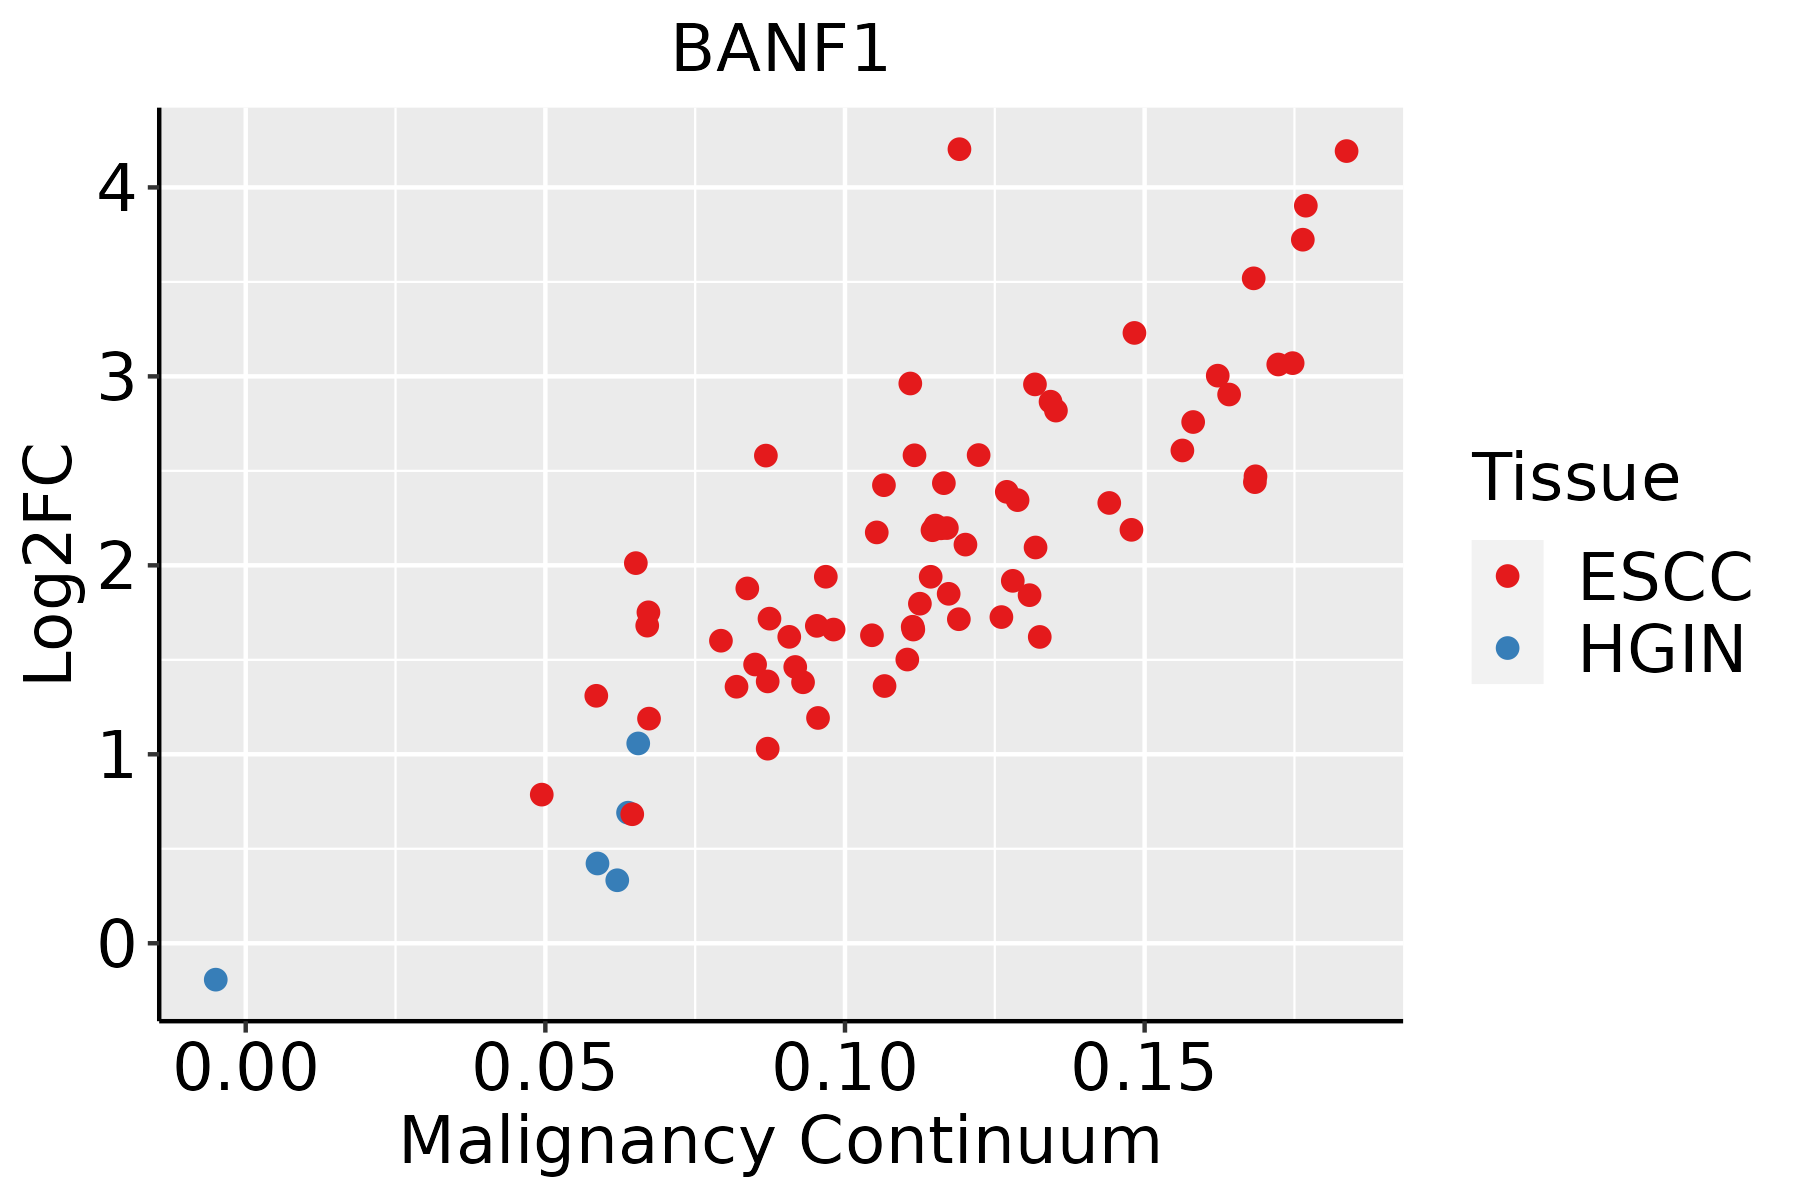 | ESCC: Esophageal squamous cell carcinoma |
| HGIN: High-grade intraepithelial neoplasias | ||
| LGIN: Low-grade intraepithelial neoplasias | ||
| Liver |  | HCC: Hepatocellular carcinoma |
| NAFLD: Non-alcoholic fatty liver disease | ||
| Oral Cavity |  | EOLP: Erosive Oral lichen planus |
| LP: leukoplakia | ||
| NEOLP: Non-erosive oral lichen planus | ||
| OSCC: Oral squamous cell carcinoma | ||
| Prostate | 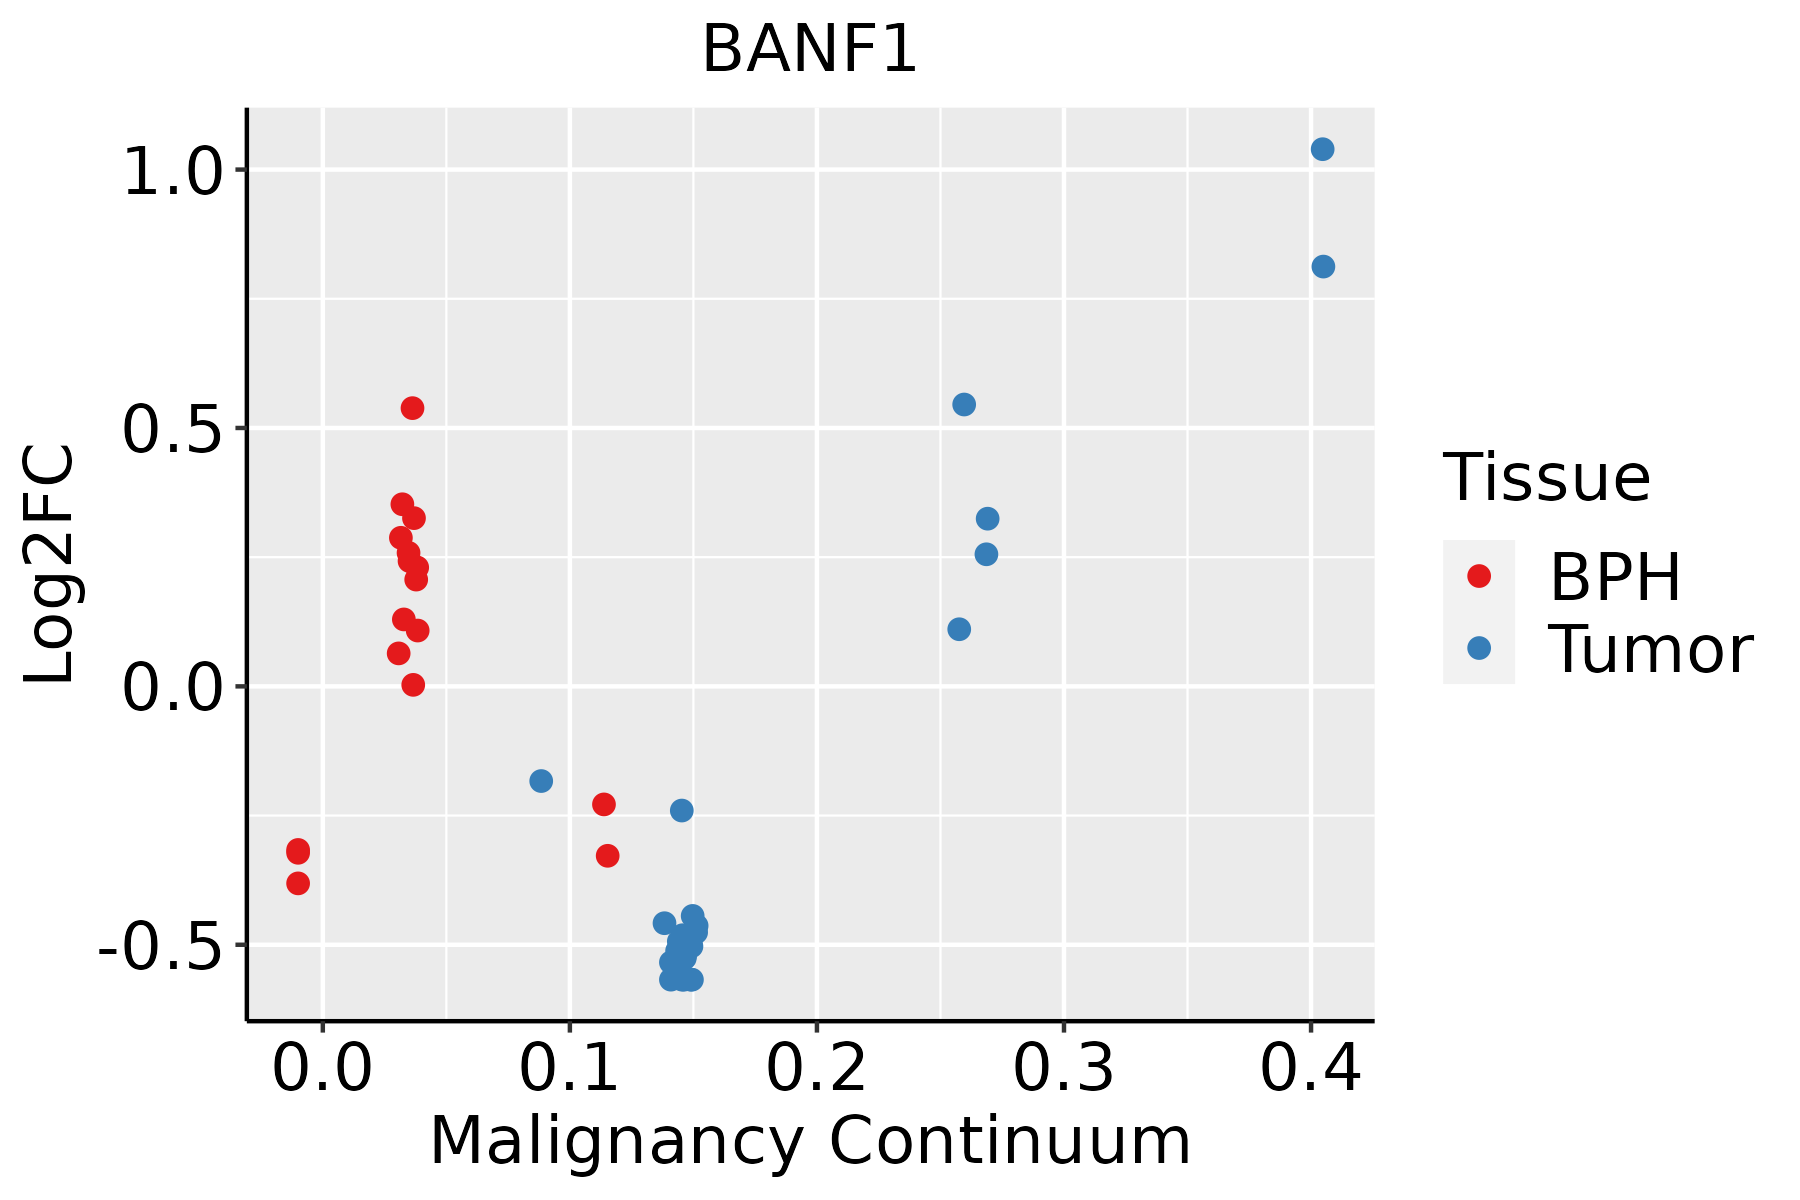 | BPH: Benign Prostatic Hyperplasia |
| Skin |  | AK: Actinic keratosis |
| cSCC: Cutaneous squamous cell carcinoma | ||
| SCCIS:squamous cell carcinoma in situ | ||
| Thyroid |  | ATC: Anaplastic thyroid cancer |
| HT: Hashimoto's thyroiditis | ||
| PTC: Papillary thyroid cancer |
| ∗log2FC in expression of this searched gene in stem-like cells from each diseased tissue sample relative to stem-like cells in normal samples in each tissue plotted against the malignancy continuum. Samples are colored based on if they are from different disease stage. |
Top |
Malignant transformation related pathway analysis |
| Find out the enriched GO biological processes and KEGG pathways involved in transition from healthy to precancer to cancer |
| Tissue | Disease Stage | Enriched GO biological Processes |
| Colorectum | AD |  |
| Colorectum | SER |  |
| Colorectum | MSS |  |
| Colorectum | MSI-H |  |
| Colorectum | FAP |  |
| ∗Top 15 enriched GO BP terms are showed in the bar plot of each disease state in each tissue. Each row represents a significant GO biological process which is colored according to the -log10(p.adjust). |
| Page: 1 2 3 4 5 6 7 8 9 |
| GO ID | Tissue | Disease Stage | Description | Gene Ratio | Bg Ratio | pvalue | p.adjust | Count |
| GO:00160322 | Colorectum | MSS | viral process | 157/3467 | 415/18723 | 7.94e-21 | 6.19e-18 | 157 |
| GO:00190582 | Colorectum | MSS | viral life cycle | 111/3467 | 317/18723 | 1.65e-12 | 2.95e-10 | 111 |
| GO:00190792 | Colorectum | MSS | viral genome replication | 49/3467 | 131/18723 | 2.73e-07 | 1.11e-05 | 49 |
| GO:00507922 | Colorectum | MSS | regulation of viral process | 54/3467 | 164/18723 | 6.79e-06 | 1.77e-04 | 54 |
| GO:19039002 | Colorectum | MSS | regulation of viral life cycle | 47/3467 | 148/18723 | 7.20e-05 | 1.21e-03 | 47 |
| GO:00450691 | Colorectum | MSS | regulation of viral genome replication | 30/3467 | 85/18723 | 1.81e-04 | 2.57e-03 | 30 |
| GO:00160323 | Colorectum | MSI-H | viral process | 74/1319 | 415/18723 | 8.87e-14 | 2.05e-11 | 74 |
| GO:00190583 | Colorectum | MSI-H | viral life cycle | 53/1319 | 317/18723 | 3.27e-09 | 4.32e-07 | 53 |
| GO:00190793 | Colorectum | MSI-H | viral genome replication | 29/1319 | 131/18723 | 2.57e-08 | 2.80e-06 | 29 |
| GO:00450692 | Colorectum | MSI-H | regulation of viral genome replication | 19/1319 | 85/18723 | 5.47e-06 | 2.79e-04 | 19 |
| GO:00507923 | Colorectum | MSI-H | regulation of viral process | 27/1319 | 164/18723 | 3.02e-05 | 1.20e-03 | 27 |
| GO:19039003 | Colorectum | MSI-H | regulation of viral life cycle | 25/1319 | 148/18723 | 3.78e-05 | 1.43e-03 | 25 |
| GO:0045071 | Colorectum | MSI-H | negative regulation of viral genome replication | 11/1319 | 56/18723 | 1.60e-03 | 2.39e-02 | 11 |
| GO:0048525 | Colorectum | MSI-H | negative regulation of viral process | 15/1319 | 92/18723 | 1.85e-03 | 2.65e-02 | 15 |
| GO:0009615 | Colorectum | MSI-H | response to virus | 40/1319 | 367/18723 | 3.99e-03 | 4.61e-02 | 40 |
| GO:001603216 | Endometrium | AEH | viral process | 110/2100 | 415/18723 | 1.99e-18 | 1.09e-15 | 110 |
| GO:001905816 | Endometrium | AEH | viral life cycle | 86/2100 | 317/18723 | 2.53e-15 | 7.58e-13 | 86 |
| GO:001907916 | Endometrium | AEH | viral genome replication | 43/2100 | 131/18723 | 3.22e-11 | 4.60e-09 | 43 |
| GO:005079216 | Endometrium | AEH | regulation of viral process | 40/2100 | 164/18723 | 1.46e-06 | 4.66e-05 | 40 |
| GO:190390016 | Endometrium | AEH | regulation of viral life cycle | 36/2100 | 148/18723 | 5.13e-06 | 1.32e-04 | 36 |
| Page: 1 2 3 4 5 6 7 8 9 |
| Pathway ID | Tissue | Disease Stage | Description | Gene Ratio | Bg Ratio | pvalue | p.adjust | qvalue | Count |
| Page: 1 |
Top |
Cell-cell communication analysis |
| Identification of potential cell-cell interactions between two cell types and their ligand-receptor pairs for different disease states |
| Ligand | Receptor | LRpair | Pathway | Tissue | Disease Stage |
| Page: 1 |
Top |
Single-cell gene regulatory network inference analysis |
| Find out the significant the regulons (TFs) and the target genes of each regulon across cell types for different disease states |
| TF | Cell Type | Tissue | Disease Stage | Target Gene | RSS | Regulon Activity |
| ∗The dot plots of a searched regulon are shown for all cell subpopulations in each disease state of each tissue based on the regulon specific score inferred using pySCENIC and by calculating the average expression. |
| Page: 1 |
Top |
Somatic mutation of malignant transformation related genes |
| Annotation of somatic variants for genes involved in malignant transformation |
| Hugo Symbol | Variant Class | Variant Classification | dbSNP RS | HGVSc | HGVSp | HGVSp Short | SWISSPROT | BIOTYPE | SIFT | PolyPhen | Tumor Sample Barcode | Tissue | Histology | Sex | Age | Stage | Therapy Types | Drugs | Outcome |
| BANF1 | SNV | Missense_Mutation | novel | c.118N>C | p.Asp40His | p.D40H | O75531 | protein_coding | deleterious(0) | probably_damaging(0.983) | TCGA-E2-A1LH-01 | Breast | breast invasive carcinoma | Female | <65 | I/II | Chemotherapy | adriamycin | SD |
| BANF1 | deletion | Frame_Shift_Del | novel | c.261delC | p.Phe88SerfsTer84 | p.F88Sfs*84 | O75531 | protein_coding | TCGA-EW-A2FV-01 | Breast | breast invasive carcinoma | Female | <65 | III/IV | Chemotherapy | docetaxel | SD | ||
| BANF1 | SNV | Missense_Mutation | c.205N>A | p.Ala69Thr | p.A69T | O75531 | protein_coding | deleterious(0.01) | benign(0.382) | TCGA-AZ-6598-01 | Colorectum | colon adenocarcinoma | Female | >=65 | I/II | Unknown | Unknown | SD | |
| BANF1 | SNV | Missense_Mutation | c.65N>A | p.Ser22Asn | p.S22N | O75531 | protein_coding | tolerated(0.3) | benign(0.001) | TCGA-AP-A056-01 | Endometrium | uterine corpus endometrioid carcinoma | Female | <65 | I/II | Unknown | Unknown | SD | |
| BANF1 | SNV | Missense_Mutation | rs772391821 | c.235N>A | p.Gly79Arg | p.G79R | O75531 | protein_coding | tolerated(0.54) | benign(0.123) | TCGA-B5-A11E-01 | Endometrium | uterine corpus endometrioid carcinoma | Female | <65 | I/II | Unknown | Unknown | SD |
| BANF1 | SNV | Missense_Mutation | c.256N>A | p.Asp86Asn | p.D86N | O75531 | protein_coding | tolerated(0.19) | benign(0.041) | TCGA-BS-A0UV-01 | Endometrium | uterine corpus endometrioid carcinoma | Female | <65 | III/IV | Unknown | Unknown | SD | |
| BANF1 | SNV | Missense_Mutation | novel | c.20N>G | p.His7Arg | p.H7R | O75531 | protein_coding | deleterious(0.03) | probably_damaging(0.95) | TCGA-EO-A22R-01 | Endometrium | uterine corpus endometrioid carcinoma | Female | <65 | I/II | Unknown | Unknown | SD |
| BANF1 | SNV | Missense_Mutation | c.45G>T | p.Met15Ile | p.M15I | O75531 | protein_coding | tolerated(0.08) | probably_damaging(0.999) | TCGA-44-7669-01 | Lung | lung adenocarcinoma | Male | <65 | I/II | Chemotherapy | alimta | PD | |
| BANF1 | SNV | Missense_Mutation | c.124N>A | p.Ala42Thr | p.A42T | O75531 | protein_coding | deleterious(0.02) | probably_damaging(1) | TCGA-BR-6452-01 | Stomach | stomach adenocarcinoma | Female | >=65 | I/II | Unknown | Unknown | SD | |
| BANF1 | SNV | Missense_Mutation | novel | c.32T>C | p.Val11Ala | p.V11A | O75531 | protein_coding | deleterious(0.01) | possibly_damaging(0.527) | TCGA-HF-7134-01 | Stomach | stomach adenocarcinoma | Male | Unknown | I/II | Unknown | Unknown | SD |
| Page: 1 |
Top |
Related drugs of malignant transformation related genes |
| Identification of chemicals and drugs interact with genes involved in malignant transfromation |
| (DGIdb 4.0) |
| Entrez ID | Symbol | Category | Interaction Types | Drug Claim Name | Drug Name | PMIDs |
| Page: 1 |

Copyright 2023-Present -The University of Texas Health Science Center at Houston |