
|
|||||
|
 | |
| |
| |
| |
| |
| |
|
Gene: BAIAP2L2 |
Gene summary for BAIAP2L2 |
| Gene information | Species | Human | Gene symbol | BAIAP2L2 | Gene ID | 80115 |
| Gene name | BAR/IMD domain containing adaptor protein 2 like 2 | |
| Gene Alias | BAIAP2L2 | |
| Cytomap | 22q13.1 | |
| Gene Type | protein-coding | GO ID | GO:0006996 | UniProtAcc | Q6UXY1 |
Top |
Malignant transformation analysis |
| Identification of the aberrant gene expression in precancerous and cancerous lesions by comparing the gene expression of stem-like cells in diseased tissues with normal stem cells |
| Entrez ID | Symbol | Replicates | Species | Organ | Tissue | Adj P-value | Log2FC | Malignancy |
| 80115 | BAIAP2L2 | Tumor | Human | Cervix | CC | 2.63e-57 | 9.64e-01 | 0.1241 |
| 80115 | BAIAP2L2 | sample3 | Human | Cervix | CC | 3.80e-69 | 1.00e+00 | 0.1387 |
| 80115 | BAIAP2L2 | T3 | Human | Cervix | CC | 1.31e-68 | 9.55e-01 | 0.1389 |
| 80115 | BAIAP2L2 | P4T-E | Human | Esophagus | ESCC | 2.81e-07 | 2.06e-01 | 0.1323 |
| 80115 | BAIAP2L2 | P5T-E | Human | Esophagus | ESCC | 8.96e-45 | 8.34e-01 | 0.1327 |
| 80115 | BAIAP2L2 | P9T-E | Human | Esophagus | ESCC | 6.89e-11 | 3.52e-01 | 0.1131 |
| 80115 | BAIAP2L2 | P11T-E | Human | Esophagus | ESCC | 4.74e-03 | 1.89e-01 | 0.1426 |
| 80115 | BAIAP2L2 | P17T-E | Human | Esophagus | ESCC | 2.14e-09 | 5.06e-01 | 0.1278 |
| 80115 | BAIAP2L2 | P19T-E | Human | Esophagus | ESCC | 4.64e-06 | 4.31e-01 | 0.1662 |
| 80115 | BAIAP2L2 | P20T-E | Human | Esophagus | ESCC | 1.17e-04 | 1.62e-01 | 0.1124 |
| 80115 | BAIAP2L2 | P21T-E | Human | Esophagus | ESCC | 2.85e-73 | 1.65e+00 | 0.1617 |
| 80115 | BAIAP2L2 | P23T-E | Human | Esophagus | ESCC | 6.05e-08 | 2.94e-01 | 0.108 |
| 80115 | BAIAP2L2 | P24T-E | Human | Esophagus | ESCC | 6.56e-15 | 3.55e-01 | 0.1287 |
| 80115 | BAIAP2L2 | P28T-E | Human | Esophagus | ESCC | 2.02e-06 | 1.90e-01 | 0.1149 |
| 80115 | BAIAP2L2 | P30T-E | Human | Esophagus | ESCC | 9.20e-05 | 3.15e-01 | 0.137 |
| 80115 | BAIAP2L2 | P32T-E | Human | Esophagus | ESCC | 1.45e-46 | 1.18e+00 | 0.1666 |
| 80115 | BAIAP2L2 | P37T-E | Human | Esophagus | ESCC | 5.50e-16 | 4.67e-01 | 0.1371 |
| 80115 | BAIAP2L2 | P38T-E | Human | Esophagus | ESCC | 6.38e-15 | 5.53e-01 | 0.127 |
| 80115 | BAIAP2L2 | P39T-E | Human | Esophagus | ESCC | 9.44e-07 | 1.67e-01 | 0.0894 |
| 80115 | BAIAP2L2 | P40T-E | Human | Esophagus | ESCC | 2.35e-12 | 4.70e-01 | 0.109 |
| Page: 1 2 3 4 |
| Tissue | Expression Dynamics | Abbreviation |
| Cervix |  | CC: Cervix cancer |
| HSIL_HPV: HPV-infected high-grade squamous intraepithelial lesions | ||
| N_HPV: HPV-infected normal cervix | ||
| Esophagus | 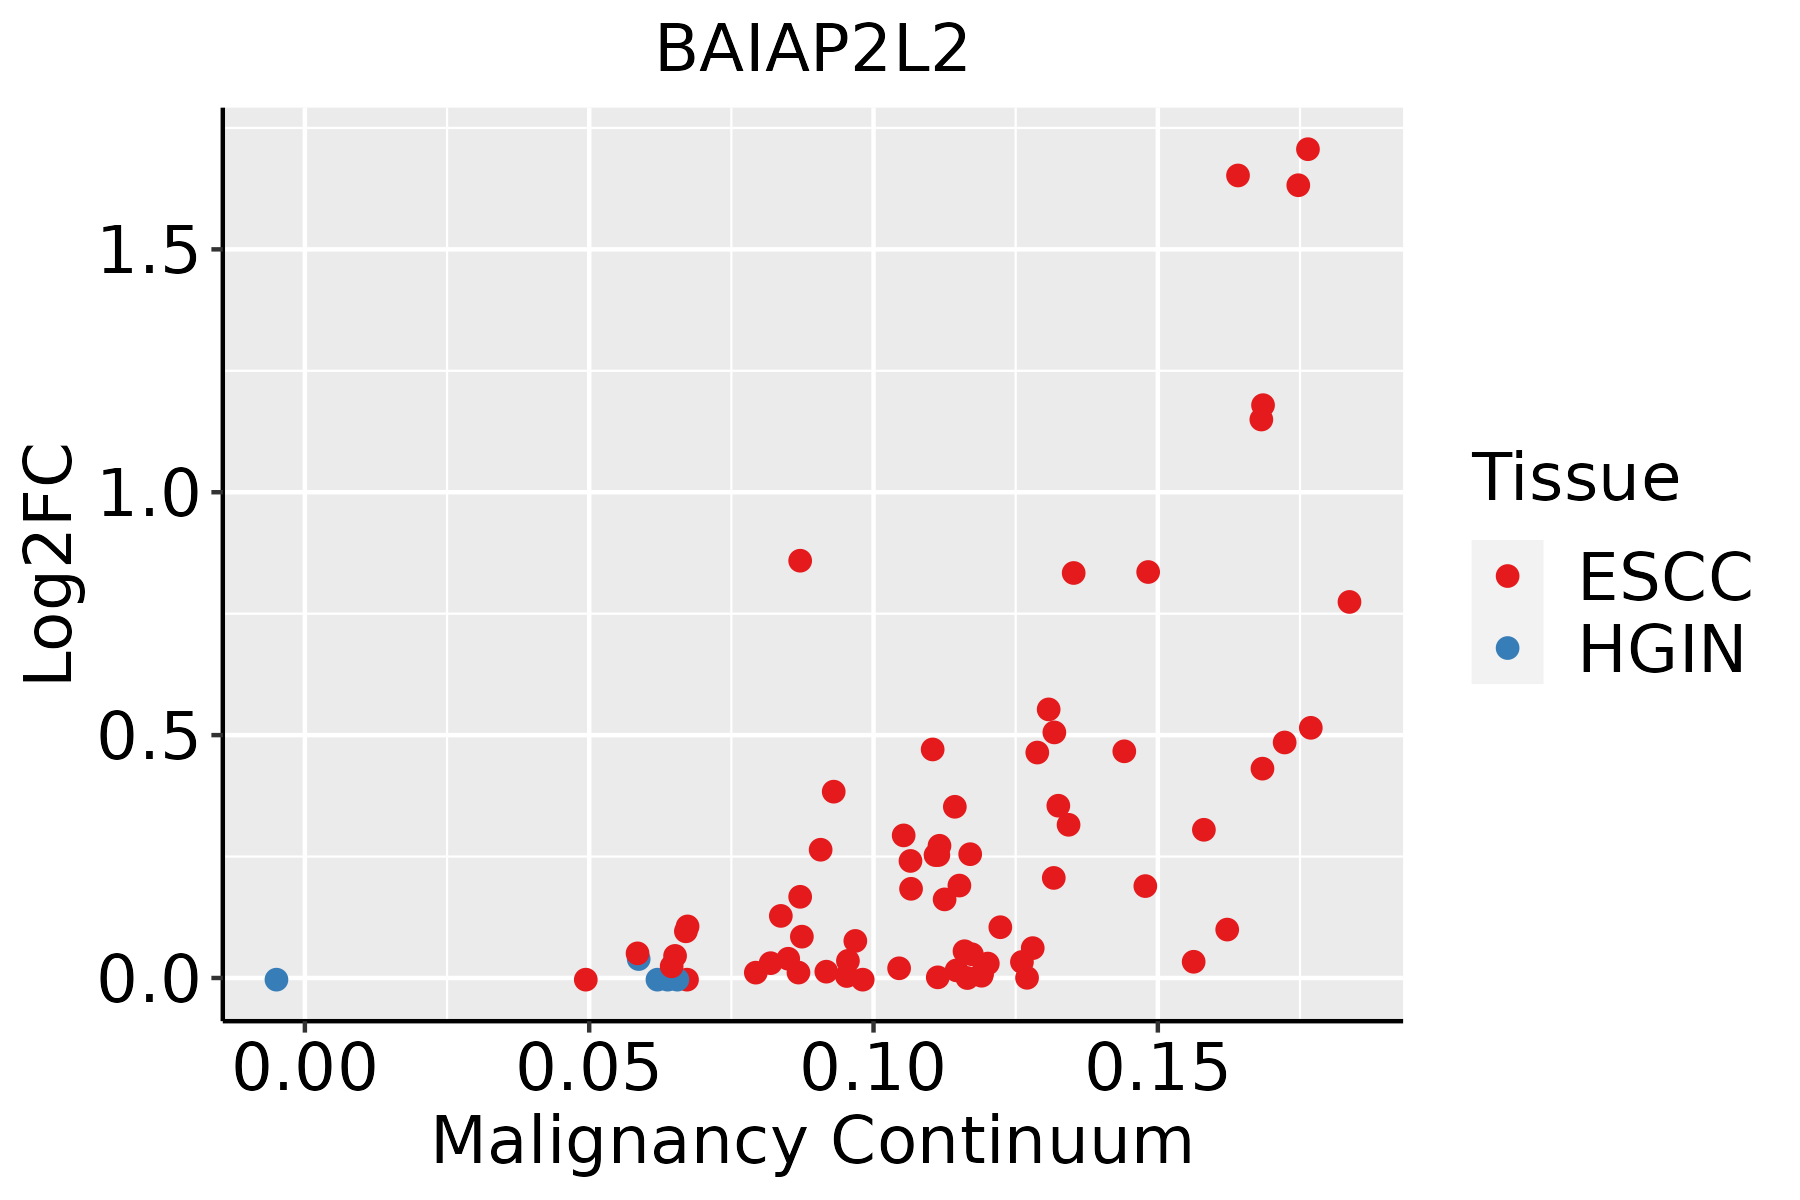 | ESCC: Esophageal squamous cell carcinoma |
| HGIN: High-grade intraepithelial neoplasias | ||
| LGIN: Low-grade intraepithelial neoplasias | ||
| GC |  | CAG: Chronic atrophic gastritis |
| CAG with IM: Chronic atrophic gastritis with intestinal metaplasia | ||
| CSG: Chronic superficial gastritis | ||
| GC: Gastric cancer | ||
| SIM: Severe intestinal metaplasia | ||
| WIM: Wild intestinal metaplasia | ||
| Liver | 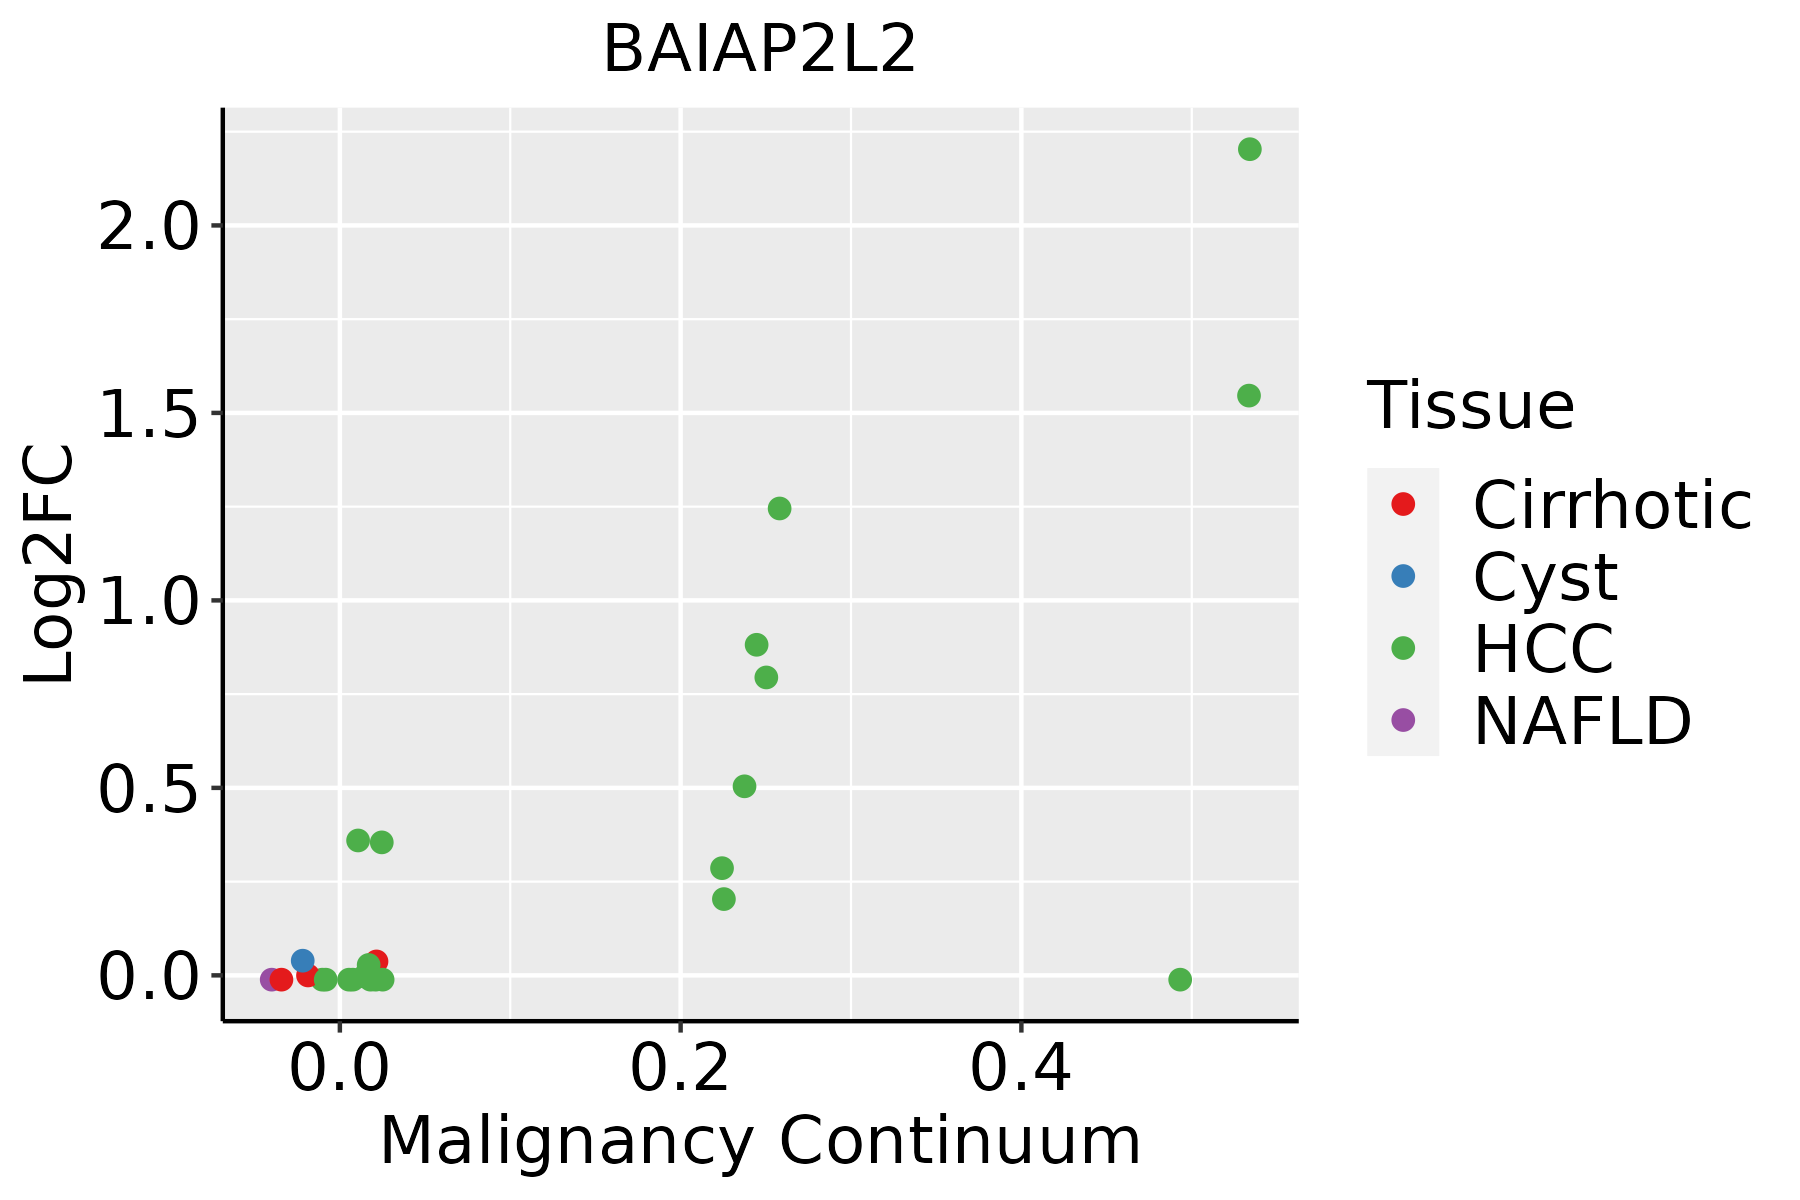 | HCC: Hepatocellular carcinoma |
| NAFLD: Non-alcoholic fatty liver disease | ||
| Oral Cavity | 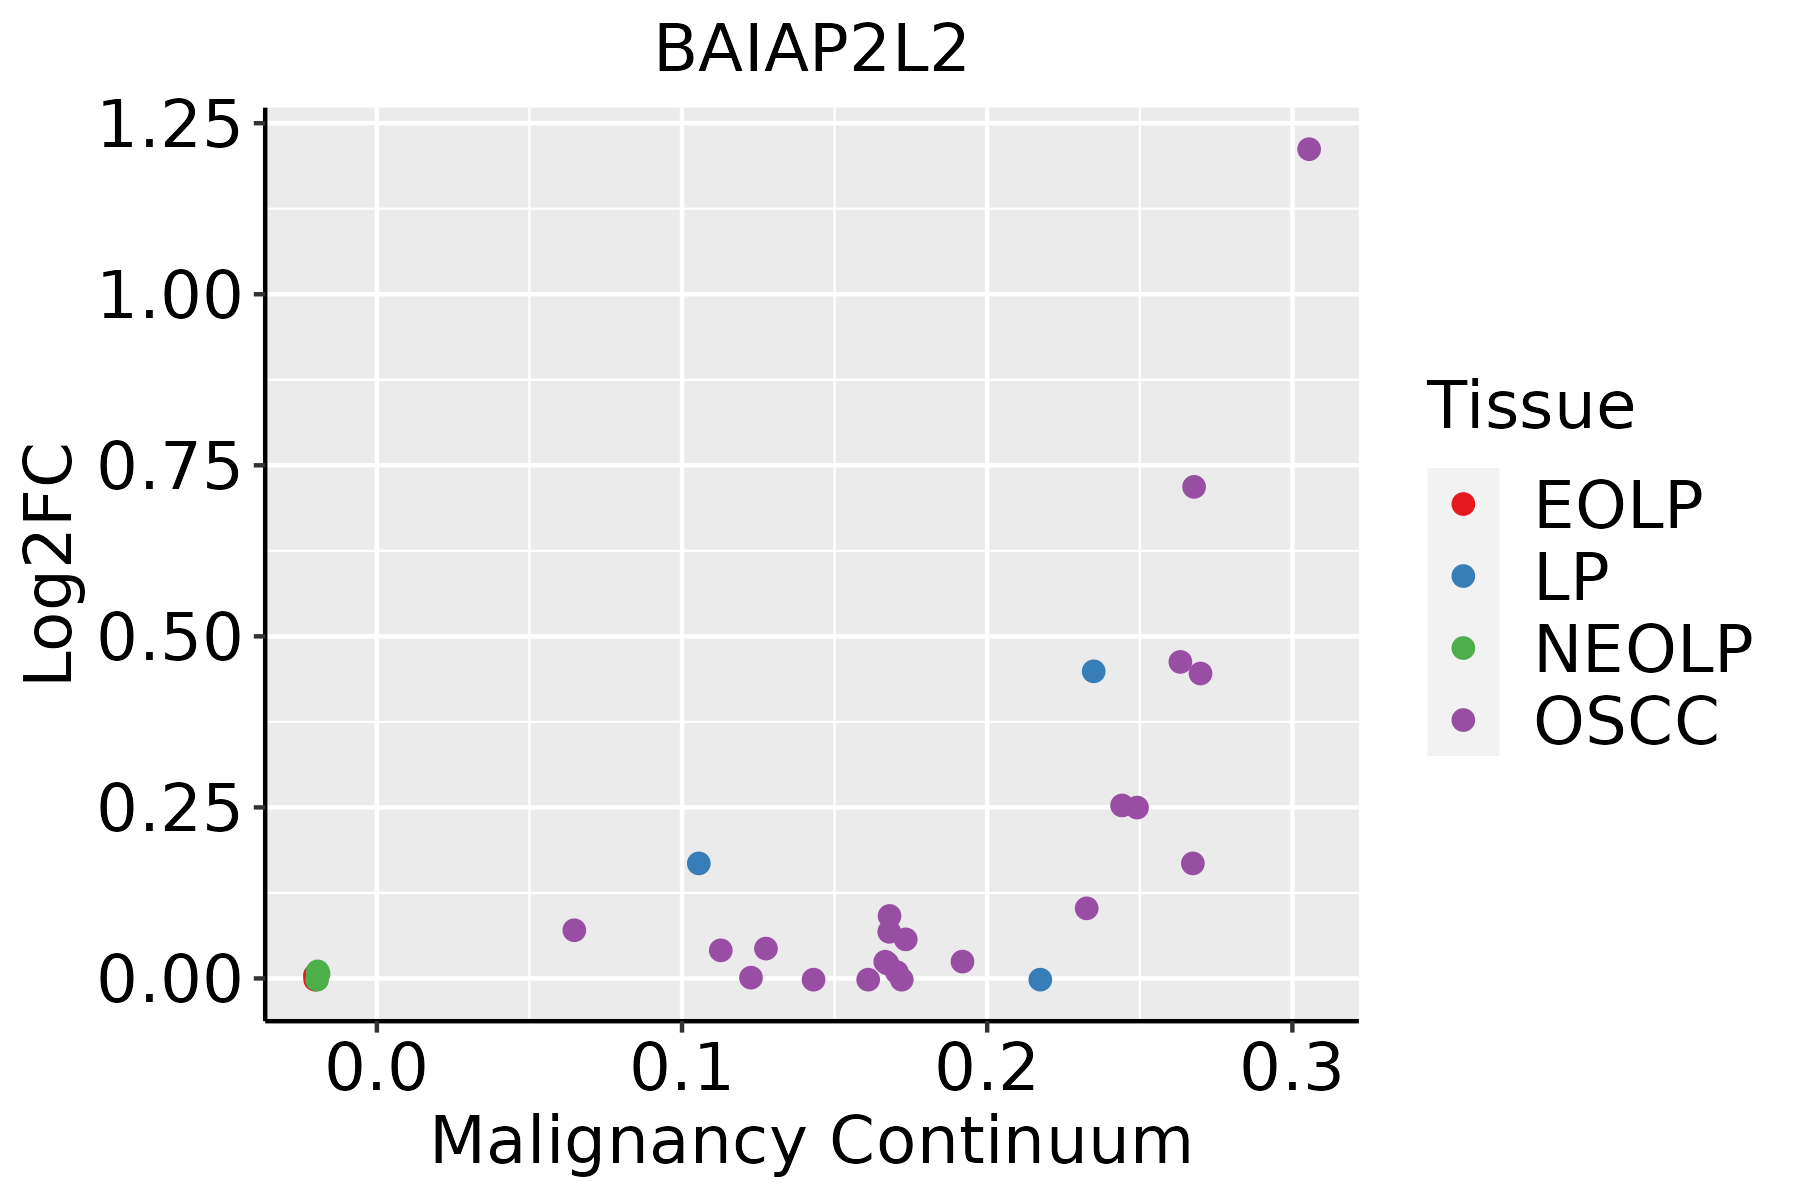 | EOLP: Erosive Oral lichen planus |
| LP: leukoplakia | ||
| NEOLP: Non-erosive oral lichen planus | ||
| OSCC: Oral squamous cell carcinoma |
| ∗log2FC in expression of this searched gene in stem-like cells from each diseased tissue sample relative to stem-like cells in normal samples in each tissue plotted against the malignancy continuum. Samples are colored based on if they are from different disease stage. |
Top |
Malignant transformation related pathway analysis |
| Find out the enriched GO biological processes and KEGG pathways involved in transition from healthy to precancer to cancer |
| Tissue | Disease Stage | Enriched GO biological Processes |
| Colorectum | AD |  |
| Colorectum | SER |  |
| Colorectum | MSS |  |
| Colorectum | MSI-H |  |
| Colorectum | FAP |  |
| ∗Top 15 enriched GO BP terms are showed in the bar plot of each disease state in each tissue. Each row represents a significant GO biological process which is colored according to the -log10(p.adjust). |
| Page: 1 2 3 4 5 6 7 8 9 |
| GO ID | Tissue | Disease Stage | Description | Gene Ratio | Bg Ratio | pvalue | p.adjust | Count |
| GO:003227310 | Cervix | CC | positive regulation of protein polymerization | 33/2311 | 138/18723 | 1.23e-04 | 1.53e-03 | 33 |
| GO:20002493 | Cervix | CC | regulation of actin cytoskeleton reorganization | 14/2311 | 39/18723 | 1.36e-04 | 1.66e-03 | 14 |
| GO:00308389 | Cervix | CC | positive regulation of actin filament polymerization | 24/2311 | 99/18723 | 7.93e-04 | 6.99e-03 | 24 |
| GO:00070092 | Cervix | CC | plasma membrane organization | 28/2311 | 142/18723 | 7.85e-03 | 4.14e-02 | 28 |
| GO:0043254111 | Esophagus | ESCC | regulation of protein-containing complex assembly | 278/8552 | 428/18723 | 3.81e-16 | 2.77e-14 | 278 |
| GO:0031334111 | Esophagus | ESCC | positive regulation of protein-containing complex assembly | 166/8552 | 237/18723 | 2.06e-14 | 1.07e-12 | 166 |
| GO:1902905111 | Esophagus | ESCC | positive regulation of supramolecular fiber organization | 142/8552 | 209/18723 | 5.51e-11 | 1.76e-09 | 142 |
| GO:1902903111 | Esophagus | ESCC | regulation of supramolecular fiber organization | 237/8552 | 383/18723 | 9.06e-11 | 2.75e-09 | 237 |
| GO:005149520 | Esophagus | ESCC | positive regulation of cytoskeleton organization | 147/8552 | 226/18723 | 2.93e-09 | 6.38e-08 | 147 |
| GO:0051258111 | Esophagus | ESCC | protein polymerization | 183/8552 | 297/18723 | 1.94e-08 | 3.75e-07 | 183 |
| GO:000701527 | Esophagus | ESCC | actin filament organization | 259/8552 | 442/18723 | 2.37e-08 | 4.50e-07 | 259 |
| GO:0032273111 | Esophagus | ESCC | positive regulation of protein polymerization | 95/8552 | 138/18723 | 2.97e-08 | 5.57e-07 | 95 |
| GO:003253520 | Esophagus | ESCC | regulation of cellular component size | 227/8552 | 383/18723 | 4.77e-08 | 8.60e-07 | 227 |
| GO:0032970111 | Esophagus | ESCC | regulation of actin filament-based process | 231/8552 | 397/18723 | 2.91e-07 | 4.20e-06 | 231 |
| GO:0032956111 | Esophagus | ESCC | regulation of actin cytoskeleton organization | 210/8552 | 358/18723 | 4.40e-07 | 6.00e-06 | 210 |
| GO:0032271111 | Esophagus | ESCC | regulation of protein polymerization | 143/8552 | 233/18723 | 9.21e-07 | 1.17e-05 | 143 |
| GO:011005327 | Esophagus | ESCC | regulation of actin filament organization | 166/8552 | 278/18723 | 1.54e-06 | 1.85e-05 | 166 |
| GO:005101727 | Esophagus | ESCC | actin filament bundle assembly | 100/8552 | 157/18723 | 3.87e-06 | 4.17e-05 | 100 |
| GO:003153218 | Esophagus | ESCC | actin cytoskeleton reorganization | 72/8552 | 107/18723 | 5.03e-06 | 5.31e-05 | 72 |
| GO:006157227 | Esophagus | ESCC | actin filament bundle organization | 101/8552 | 161/18723 | 9.22e-06 | 8.82e-05 | 101 |
| Page: 1 2 3 4 5 6 7 8 9 10 |
| Pathway ID | Tissue | Disease Stage | Description | Gene Ratio | Bg Ratio | pvalue | p.adjust | qvalue | Count |
| Page: 1 |
Top |
Cell-cell communication analysis |
| Identification of potential cell-cell interactions between two cell types and their ligand-receptor pairs for different disease states |
| Ligand | Receptor | LRpair | Pathway | Tissue | Disease Stage |
| Page: 1 |
Top |
Single-cell gene regulatory network inference analysis |
| Find out the significant the regulons (TFs) and the target genes of each regulon across cell types for different disease states |
| TF | Cell Type | Tissue | Disease Stage | Target Gene | RSS | Regulon Activity |
| ∗The dot plots of a searched regulon are shown for all cell subpopulations in each disease state of each tissue based on the regulon specific score inferred using pySCENIC and by calculating the average expression. |
| Page: 1 |
Top |
Somatic mutation of malignant transformation related genes |
| Annotation of somatic variants for genes involved in malignant transformation |
| Hugo Symbol | Variant Class | Variant Classification | dbSNP RS | HGVSc | HGVSp | HGVSp Short | SWISSPROT | BIOTYPE | SIFT | PolyPhen | Tumor Sample Barcode | Tissue | Histology | Sex | Age | Stage | Therapy Types | Drugs | Outcome |
| BAIAP2L2 | SNV | Missense_Mutation | c.331N>A | p.Asp111Asn | p.D111N | Q6UXY1 | protein_coding | deleterious(0) | probably_damaging(0.999) | TCGA-A2-A0EY-01 | Breast | breast invasive carcinoma | Female | <65 | I/II | Chemotherapy | adriamycin | SD | |
| BAIAP2L2 | SNV | Missense_Mutation | rs201026822 | c.115N>T | p.Arg39Cys | p.R39C | Q6UXY1 | protein_coding | deleterious(0) | probably_damaging(0.999) | TCGA-AC-A23H-01 | Breast | breast invasive carcinoma | Female | >=65 | I/II | Unknown | Unknown | PD |
| BAIAP2L2 | SNV | Missense_Mutation | rs764609892 | c.211C>G | p.Leu71Val | p.L71V | Q6UXY1 | protein_coding | deleterious(0) | probably_damaging(0.959) | TCGA-VS-A9UH-01 | Cervix | cervical & endocervical cancer | Female | <65 | I/II | Chemotherapy | cisplatin | CR |
| BAIAP2L2 | SNV | Missense_Mutation | c.548G>A | p.Arg183His | p.R183H | Q6UXY1 | protein_coding | deleterious(0) | probably_damaging(0.999) | TCGA-AA-3864-01 | Colorectum | colon adenocarcinoma | Male | >=65 | I/II | Unknown | Unknown | SD | |
| BAIAP2L2 | SNV | Missense_Mutation | c.1031N>A | p.Leu344Gln | p.L344Q | Q6UXY1 | protein_coding | deleterious(0) | probably_damaging(1) | TCGA-CK-4951-01 | Colorectum | colon adenocarcinoma | Female | >=65 | I/II | Unknown | Unknown | PD | |
| BAIAP2L2 | SNV | Missense_Mutation | c.544N>T | p.Arg182Trp | p.R182W | Q6UXY1 | protein_coding | deleterious(0) | probably_damaging(1) | TCGA-G4-6628-01 | Colorectum | colon adenocarcinoma | Male | >=65 | I/II | Unknown | Unknown | SD | |
| BAIAP2L2 | SNV | Missense_Mutation | novel | c.424C>T | p.Arg142Cys | p.R142C | Q6UXY1 | protein_coding | deleterious(0) | probably_damaging(0.962) | TCGA-EI-6917-01 | Colorectum | rectum adenocarcinoma | Male | <65 | III/IV | Chemotherapy | 5fluorouracil+oxaciplatina+l-folinian | SD |
| BAIAP2L2 | insertion | In_Frame_Ins | novel | c.1223_1224insAACACCCAT | p.Pro407_Met408insIleThrPro | p.P407_M408insITP | Q6UXY1 | protein_coding | TCGA-AA-A01P-01 | Colorectum | colon adenocarcinoma | Female | >=65 | III/IV | Unknown | Unknown | PD | ||
| BAIAP2L2 | SNV | Missense_Mutation | rs201411605 | c.1175N>A | p.Pro392His | p.P392H | Q6UXY1 | protein_coding | tolerated(0.25) | possibly_damaging(0.753) | TCGA-AP-A051-01 | Endometrium | uterine corpus endometrioid carcinoma | Female | >=65 | I/II | Unknown | Unknown | SD |
| BAIAP2L2 | SNV | Missense_Mutation | rs761059410 | c.1547G>A | p.Arg516His | p.R516H | Q6UXY1 | protein_coding | deleterious(0) | probably_damaging(0.972) | TCGA-AP-A059-01 | Endometrium | uterine corpus endometrioid carcinoma | Female | >=65 | I/II | Unknown | Unknown | SD |
| Page: 1 2 3 4 |
Top |
Related drugs of malignant transformation related genes |
| Identification of chemicals and drugs interact with genes involved in malignant transfromation |
| (DGIdb 4.0) |
| Entrez ID | Symbol | Category | Interaction Types | Drug Claim Name | Drug Name | PMIDs |
| Page: 1 |

Copyright 2023-Present -The University of Texas Health Science Center at Houston |