Schematic overview of the cellular and molecular mechanisms involved in the cancer progression, including the proposed cellular and molecular mechanisms in cancer cells trajectory. AT1: alveolar type 1 cells; AT2: alveolar type 2 cells; AAH: atypical adenomatous hyperplasia; AIS: adenocarcinoma in situ; MIA: minimally invasive adenocarcinoma; IA: invasive adenocarcinoma; EMT: epithelial-mesenchymal transition

Home

Download

Statistics

Help

Contact

Center for Computational Systems Medicine
leaf

Gene summary

leaf

Malignant transformation analysis

leaf

Malignant transformation related pathway analysis

leaf

Cell-cell communication analysis

leaf

Single-cell gene regulatory network inference analysis

leaf

Somatic mutation of malignant transformation related genes

leaf

Related drugs of malignant transformation related genes

Gene: B3GAT3

Gene summary for B3GAT3

check button Gene summary.

Gene informationSpeciesHuman
Gene symbol

B3GAT3

Gene ID

26229

Gene namebeta-1,3-glucuronyltransferase 3
Gene AliasGLCATI
Cytomap11q12.3
Gene Typeprotein-coding
GO ID

GO:0005975

UniProtAcc

Q5U676


Top

Malignant transformation analysis

check button Identification of the aberrant gene expression in precancerous and cancerous lesions by comparing the gene expression of stem-like cells in diseased tissues with normal stem cells
check button Malignant transformation involving gene list.
Entrez IDSymbolReplicatesSpeciesOrganTissueAdj P-valueLog2FCMalignancy
26229B3GAT3LZE2THumanEsophagusESCC1.54e-096.09e-010.082
26229B3GAT3LZE4THumanEsophagusESCC1.73e-102.94e-010.0811
26229B3GAT3LZE7THumanEsophagusESCC4.12e-108.05e-010.0667
26229B3GAT3LZE8THumanEsophagusESCC5.76e-122.31e-010.067
26229B3GAT3LZE20THumanEsophagusESCC3.16e-041.33e-010.0662
26229B3GAT3LZE22THumanEsophagusESCC5.75e-074.76e-010.068
26229B3GAT3LZE24THumanEsophagusESCC4.32e-307.47e-010.0596
26229B3GAT3LZE6THumanEsophagusESCC2.17e-094.93e-010.0845
26229B3GAT3P1T-EHumanEsophagusESCC2.04e-062.44e-010.0875
26229B3GAT3P2T-EHumanEsophagusESCC4.87e-468.16e-010.1177
26229B3GAT3P4T-EHumanEsophagusESCC3.59e-501.02e+000.1323
26229B3GAT3P5T-EHumanEsophagusESCC1.97e-428.50e-010.1327
26229B3GAT3P8T-EHumanEsophagusESCC3.98e-366.65e-010.0889
26229B3GAT3P9T-EHumanEsophagusESCC1.34e-295.93e-010.1131
26229B3GAT3P10T-EHumanEsophagusESCC9.47e-427.25e-010.116
26229B3GAT3P11T-EHumanEsophagusESCC9.90e-259.81e-010.1426
26229B3GAT3P12T-EHumanEsophagusESCC2.76e-367.13e-010.1122
26229B3GAT3P15T-EHumanEsophagusESCC4.29e-234.58e-010.1149
26229B3GAT3P16T-EHumanEsophagusESCC2.19e-347.62e-010.1153
26229B3GAT3P17T-EHumanEsophagusESCC2.11e-156.94e-010.1278
Page: 1 2 3 4 5 6 7 

check button Transcriptomic changes along malignancy continuum.
TissueExpression DynamicsAbbreviation
EsophagusThe image shows the transcriptomic changes along malignancy continuum.log2FC in expression of this searched gene in stem-like cells from each diseased tissue sample relative to stem-like cells in normal samples in each tissue plotted against the malignancy continuum. Samples are colored based on if they are from different disease stage.
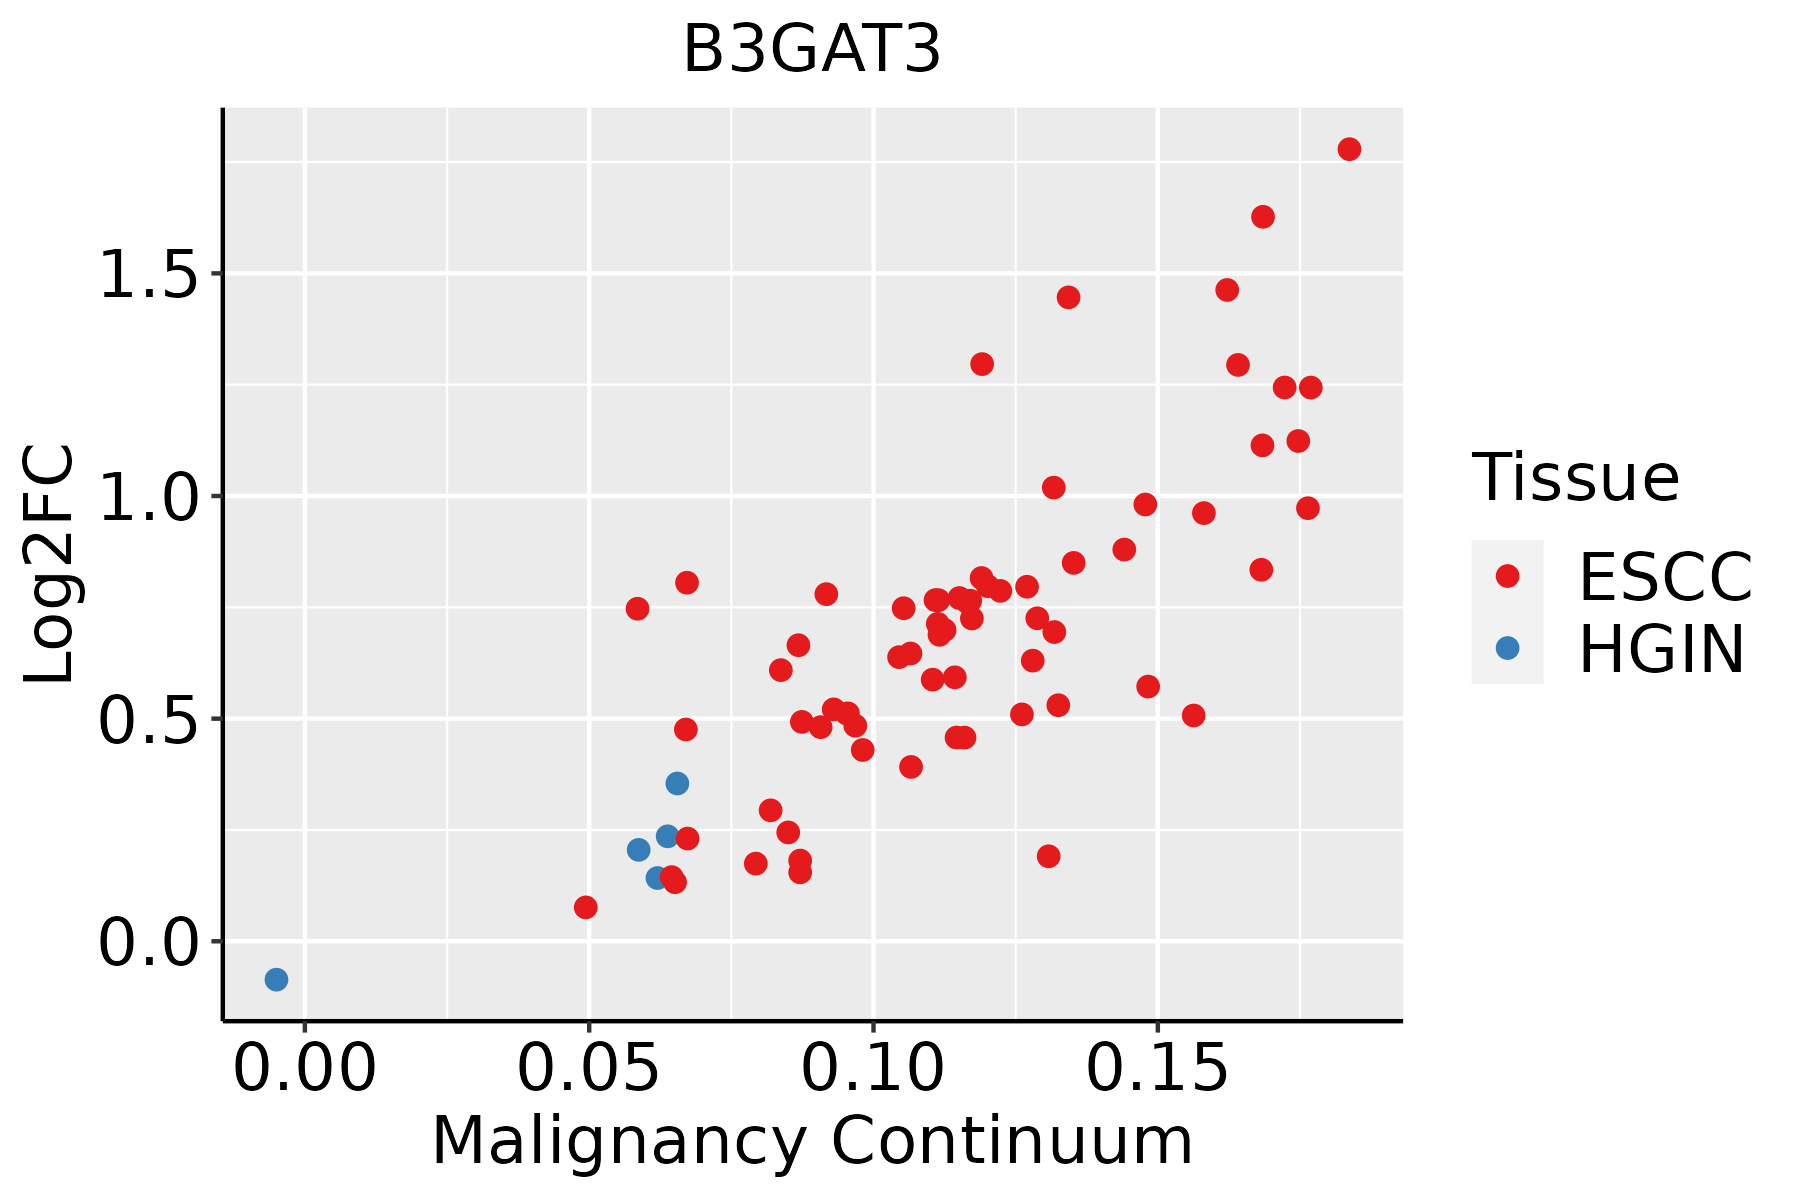
ESCC: Esophageal squamous cell carcinoma
HGIN: High-grade intraepithelial neoplasias
LGIN: Low-grade intraepithelial neoplasias
LiverThe image shows the transcriptomic changes along malignancy continuum.log2FC in expression of this searched gene in stem-like cells from each diseased tissue sample relative to stem-like cells in normal samples in each tissue plotted against the malignancy continuum. Samples are colored based on if they are from different disease stage.
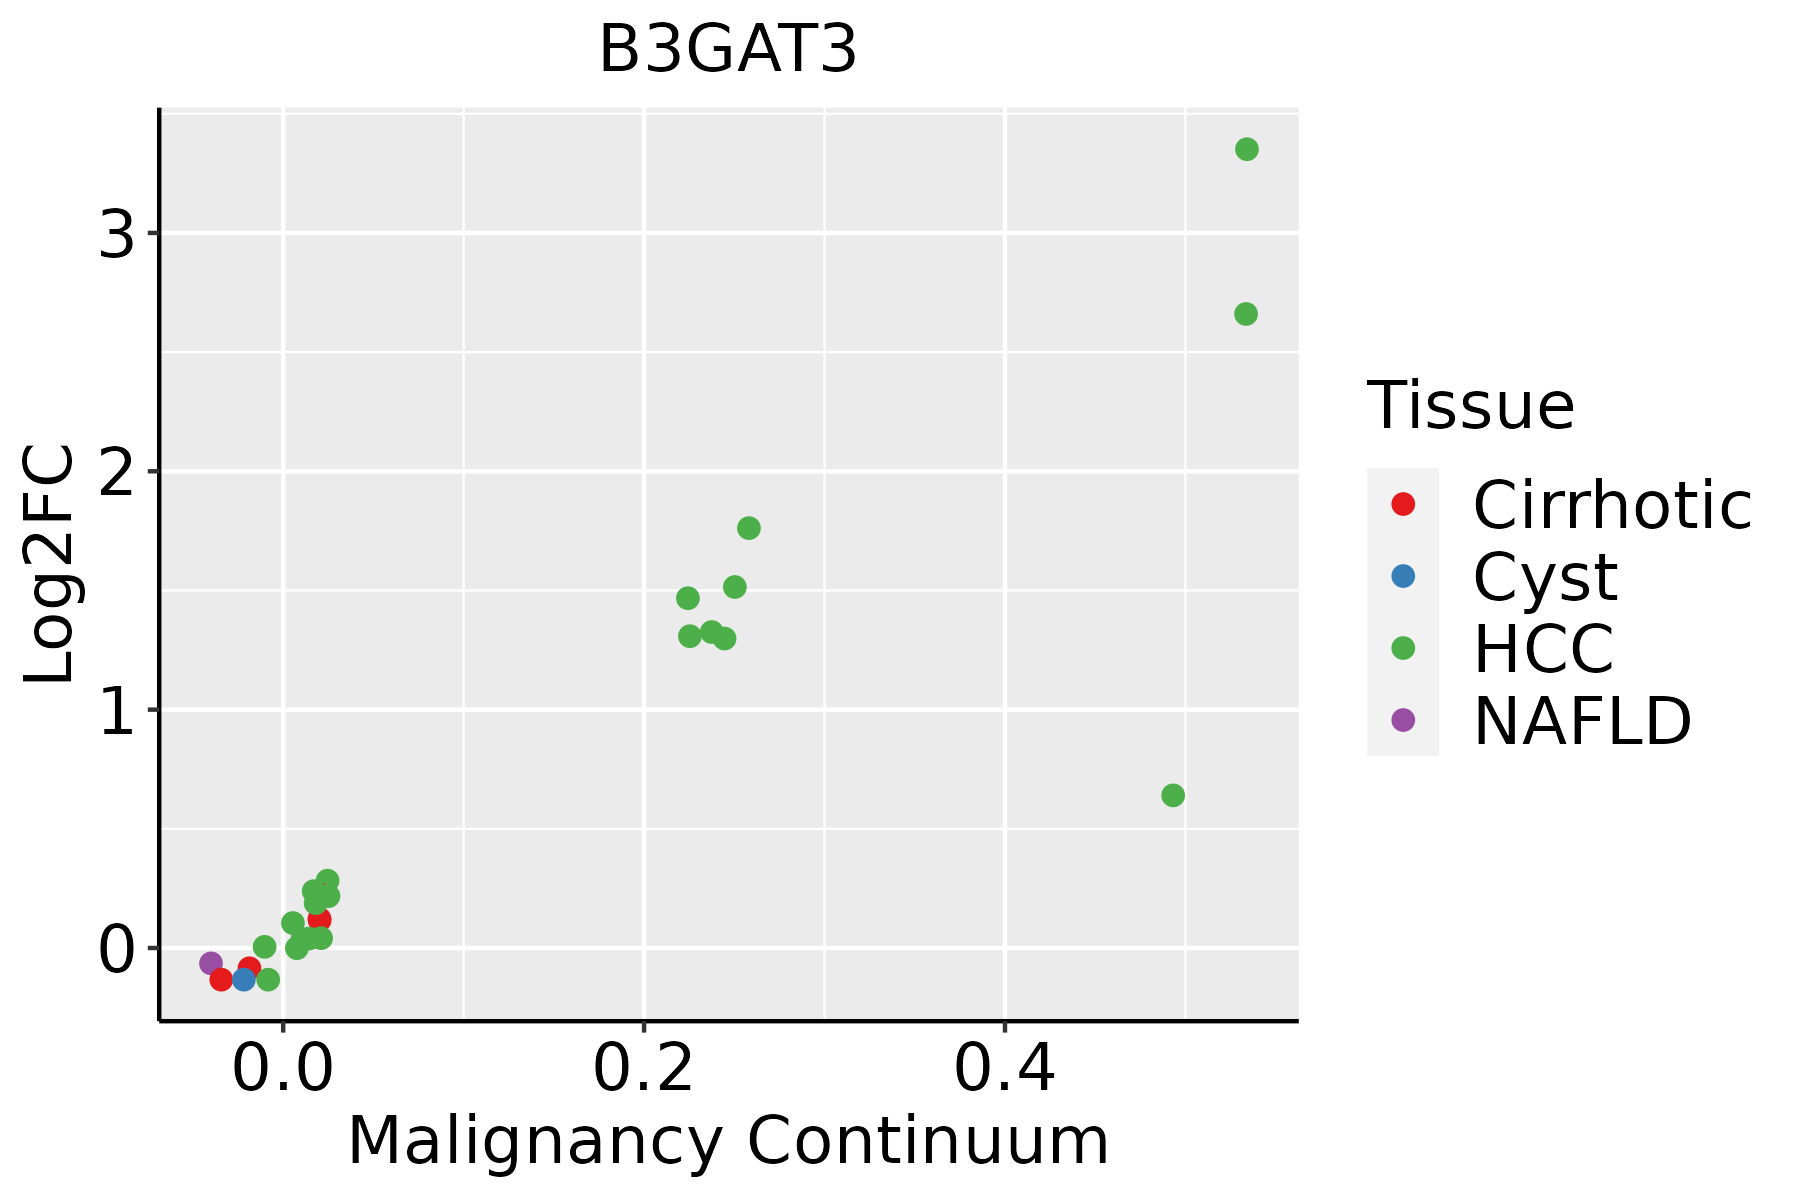
HCC: Hepatocellular carcinoma
NAFLD: Non-alcoholic fatty liver disease
Oral CavityThe image shows the transcriptomic changes along malignancy continuum.log2FC in expression of this searched gene in stem-like cells from each diseased tissue sample relative to stem-like cells in normal samples in each tissue plotted against the malignancy continuum. Samples are colored based on if they are from different disease stage.
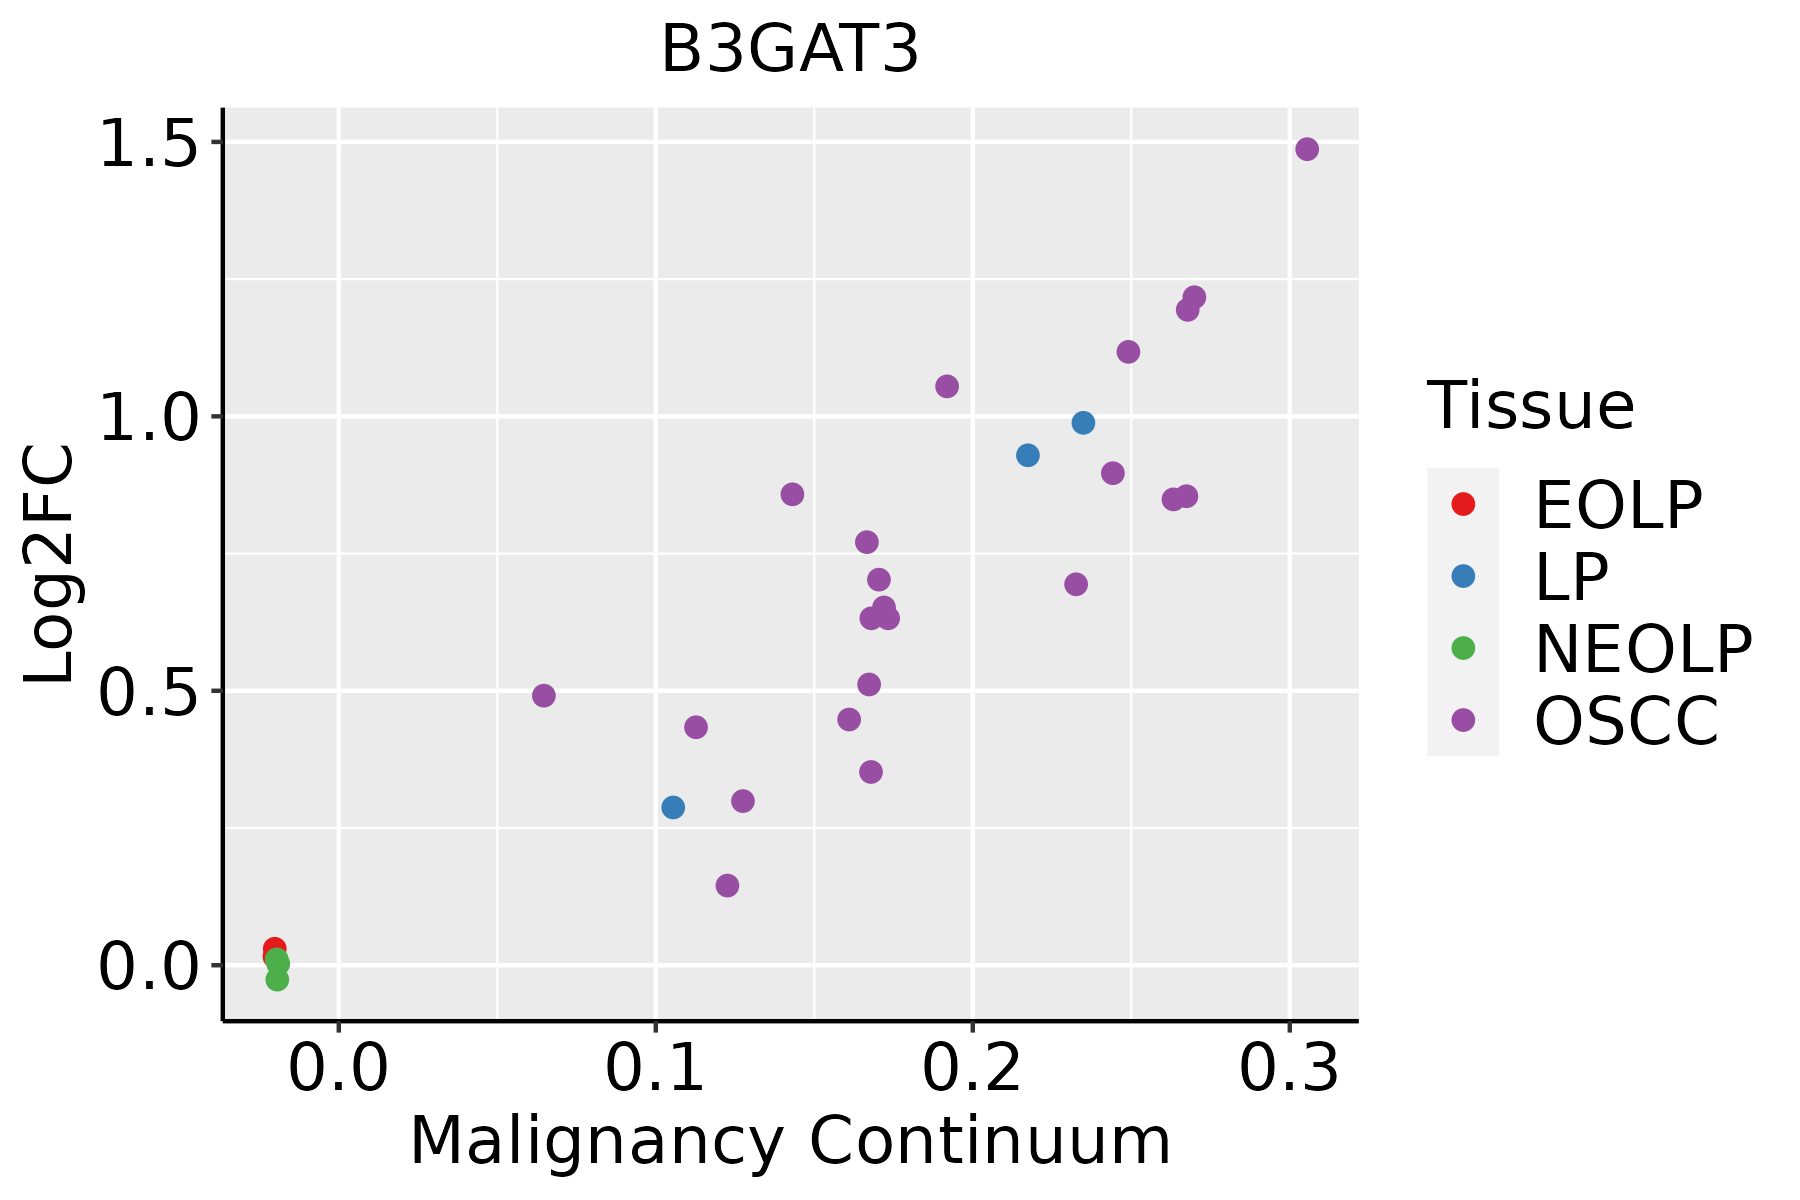
EOLP: Erosive Oral lichen planus
LP: leukoplakia
NEOLP: Non-erosive oral lichen planus
OSCC: Oral squamous cell carcinoma
SkinThe image shows the transcriptomic changes along malignancy continuum.log2FC in expression of this searched gene in stem-like cells from each diseased tissue sample relative to stem-like cells in normal samples in each tissue plotted against the malignancy continuum. Samples are colored based on if they are from different disease stage.
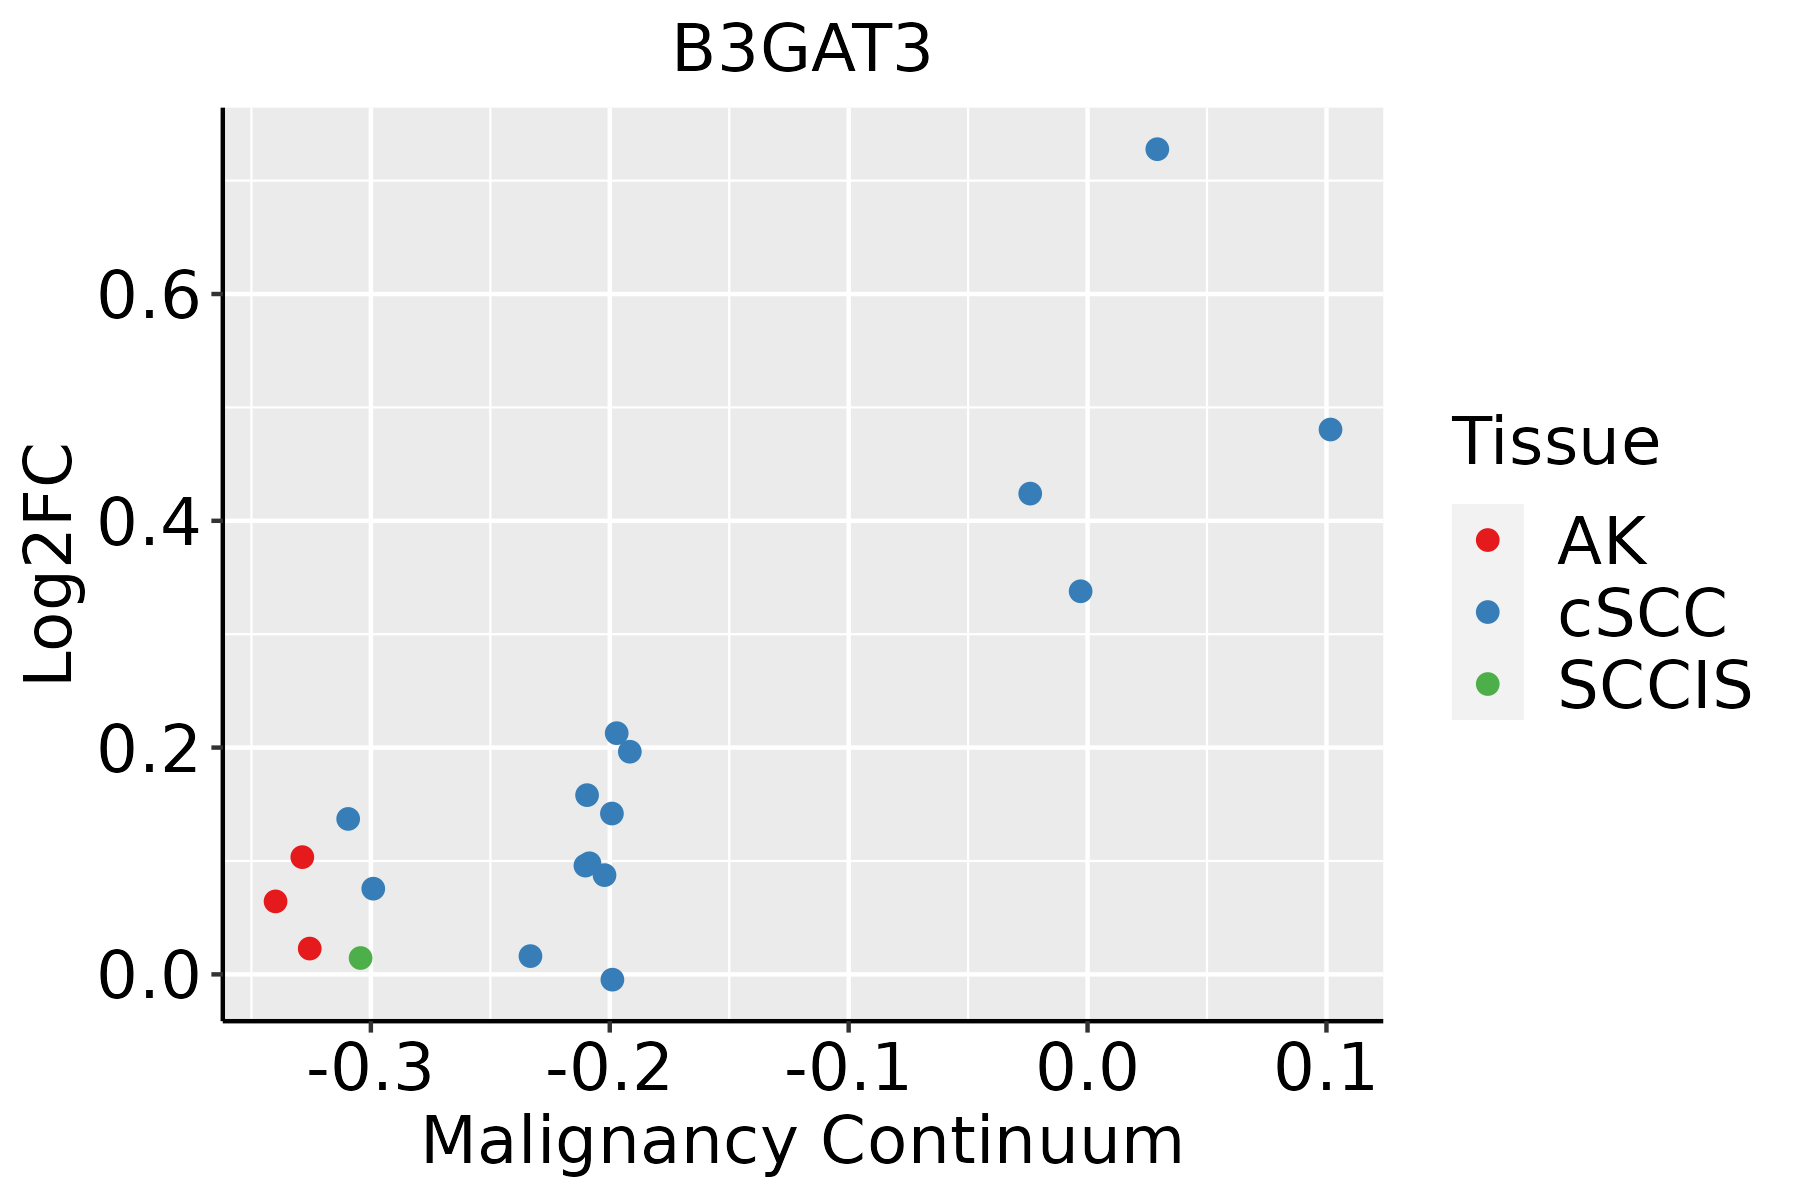
AK: Actinic keratosis
cSCC: Cutaneous squamous cell carcinoma
SCCIS:squamous cell carcinoma in situ
ThyroidThe image shows the transcriptomic changes along malignancy continuum.log2FC in expression of this searched gene in stem-like cells from each diseased tissue sample relative to stem-like cells in normal samples in each tissue plotted against the malignancy continuum. Samples are colored based on if they are from different disease stage.
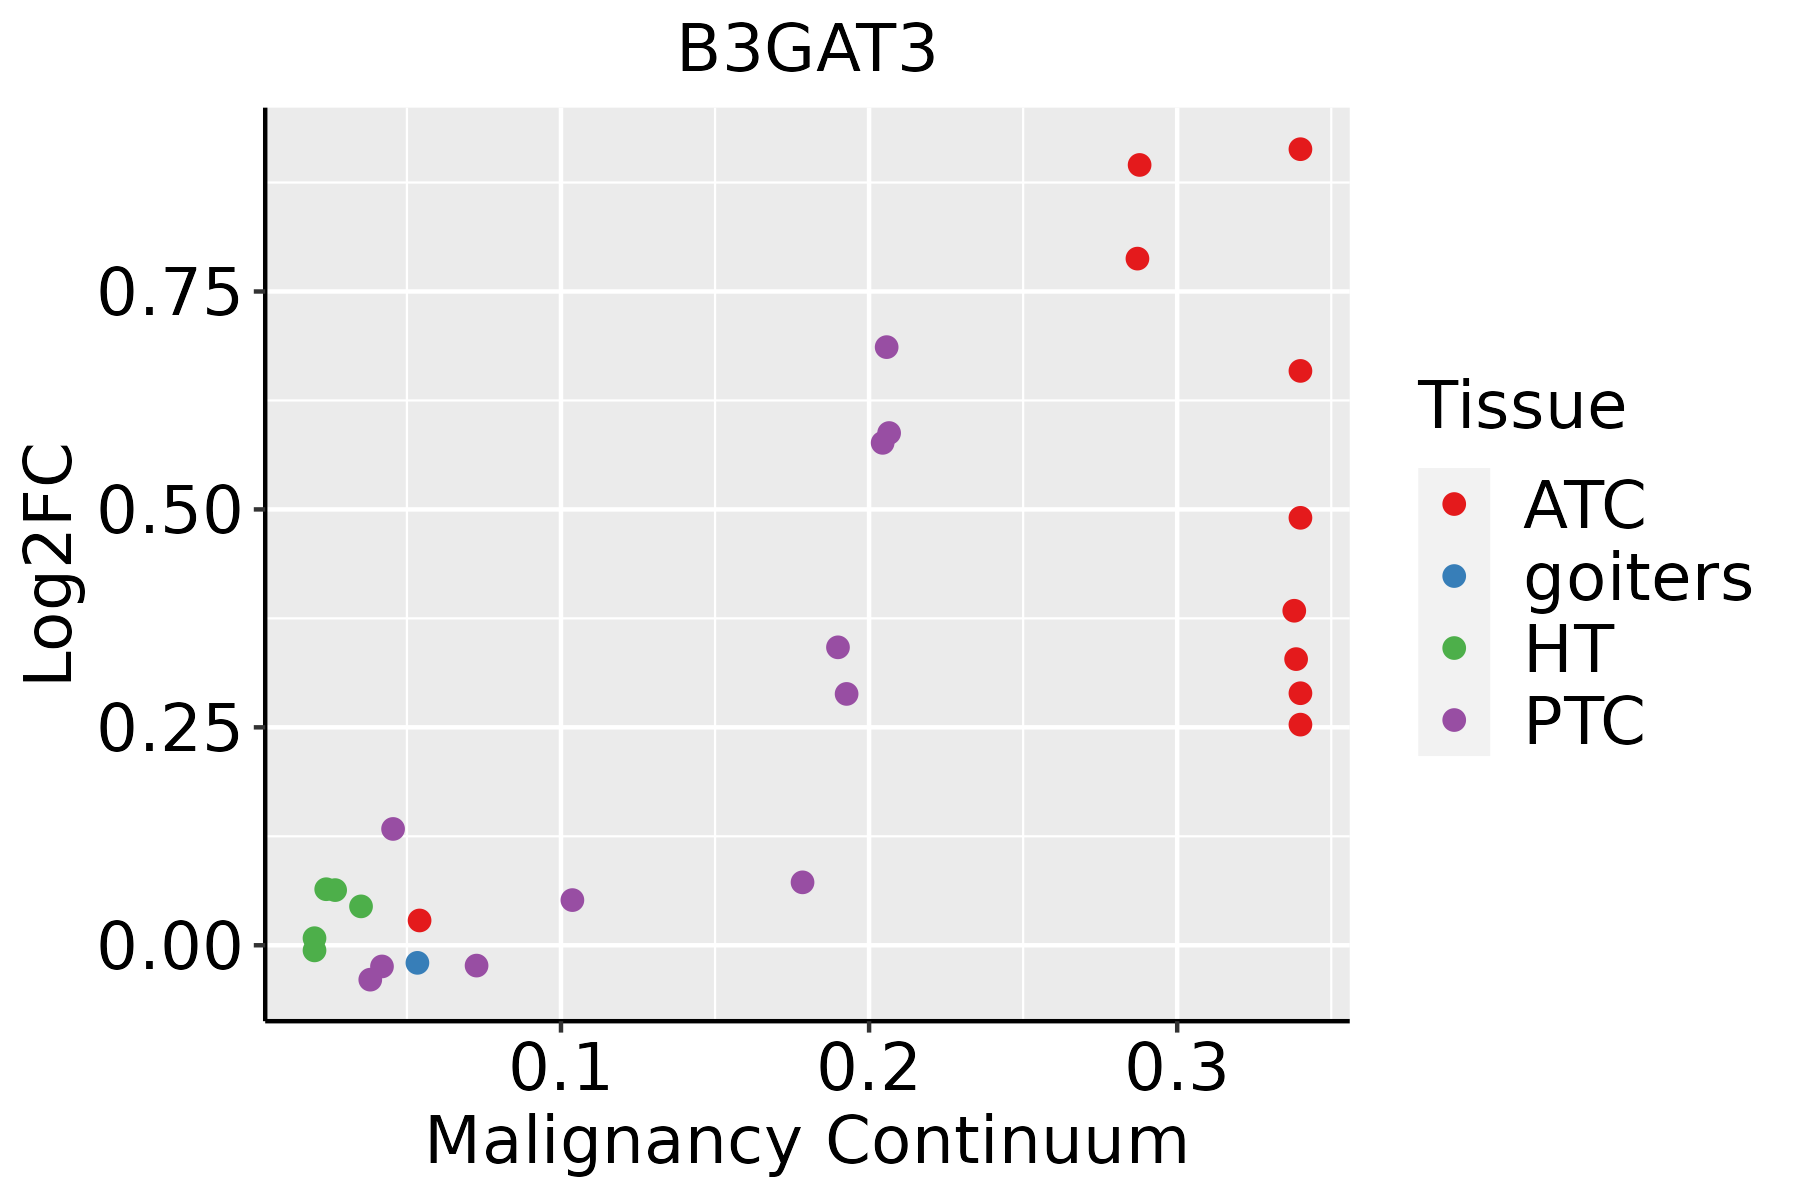
ATC: Anaplastic thyroid cancer
HT: Hashimoto's thyroiditis
PTC: Papillary thyroid cancer
∗log2FC in expression of this searched gene in stem-like cells from each diseased tissue sample relative to stem-like cells in normal samples in each tissue plotted against the malignancy continuum. Samples are colored based on if they are from different disease stage.

Top

Malignant transformation related pathway analysis

check buttonFind out the enriched GO biological processes and KEGG pathways involved in transition from healthy to precancer to cancer
check button Figure of enriched GO biological processes.
TissueDisease StageEnriched GO biological Processes
ColorectumADGO analysis - Figure of enriched GO biological processes: Top 15 enriched GO BP terms are showed in the bar plot of each disease state in each tissue. Each row represents a significant GO biological process which is colored according to the -log10(p.adjust).
ColorectumSERGO analysis - Figure of enriched GO biological processes: Top 15 enriched GO BP terms are showed in the bar plot of each disease state in each tissue. Each row represents a significant GO biological process which is colored according to the -log10(p.adjust).
ColorectumMSSGO analysis - Figure of enriched GO biological processes: Top 15 enriched GO BP terms are showed in the bar plot of each disease state in each tissue. Each row represents a significant GO biological process which is colored according to the -log10(p.adjust).
ColorectumMSI-HGO analysis - Figure of enriched GO biological processes: Top 15 enriched GO BP terms are showed in the bar plot of each disease state in each tissue. Each row represents a significant GO biological process which is colored according to the -log10(p.adjust).
ColorectumFAPGO analysis - Figure of enriched GO biological processes: Top 15 enriched GO BP terms are showed in the bar plot of each disease state in each tissue. Each row represents a significant GO biological process which is colored according to the -log10(p.adjust).
∗Top 15 enriched GO BP terms are showed in the bar plot of each disease state in each tissue. Each row represents a significant GO biological process which is colored according to the -log10(p.adjust).
Page: 1 2 3 4 5 6 7 8 9 

check button Enriched GO biological processes.
GO IDTissueDisease StageDescriptionGene RatioBg Ratiopvaluep.adjustCount
GO:003238811LiverCirrhoticpositive regulation of intracellular transport92/4634202/187238.60e-114.66e-0992
GO:009031611LiverCirrhoticpositive regulation of intracellular protein transport77/4634160/187231.17e-106.21e-0977
GO:003238621LiverHCCregulation of intracellular transport231/7958337/187231.99e-223.40e-20231
GO:003315721LiverHCCregulation of intracellular protein transport165/7958229/187238.37e-201.15e-17165
GO:003238821LiverHCCpositive regulation of intracellular transport148/7958202/187235.15e-196.66e-17148
GO:009031621LiverHCCpositive regulation of intracellular protein transport121/7958160/187231.27e-171.39e-15121
GO:190495122LiverHCCpositive regulation of establishment of protein localization207/7958319/187233.95e-163.29e-14207
GO:005122222LiverHCCpositive regulation of protein transport194/7958303/187232.41e-141.56e-12194
GO:00064862LiverHCCprotein glycosylation122/7958226/187233.11e-042.21e-03122
GO:00434132LiverHCCmacromolecule glycosylation122/7958226/187233.11e-042.21e-03122
GO:00700852LiverHCCglycosylation128/7958240/187234.35e-042.92e-03128
GO:0009100LiverHCCglycoprotein metabolic process193/7958387/187231.89e-039.62e-03193
GO:003238615Oral cavityOSCCregulation of intracellular transport218/7305337/187236.91e-221.41e-19218
GO:003315718Oral cavityOSCCregulation of intracellular protein transport155/7305229/187231.05e-181.28e-16155
GO:190495119Oral cavityOSCCpositive regulation of establishment of protein localization196/7305319/187232.89e-162.20e-14196
GO:005122219Oral cavityOSCCpositive regulation of protein transport187/7305303/187237.37e-165.49e-14187
GO:003238818Oral cavityOSCCpositive regulation of intracellular transport134/7305202/187232.82e-151.88e-13134
GO:009031610Oral cavityOSCCpositive regulation of intracellular protein transport110/7305160/187232.10e-141.19e-12110
GO:00091001Oral cavityOSCCglycoprotein metabolic process185/7305387/187232.37e-041.54e-03185
GO:00091011Oral cavityOSCCglycoprotein biosynthetic process151/7305317/187231.01e-035.26e-03151
Page: 1 2 3 4 

check button Enriched KEGG pathways.
Pathway IDTissueDisease StageDescriptionGene RatioBg Ratiopvaluep.adjustqvalueCount
hsa00532Oral cavityOSCCGlycosaminoglycan biosynthesis - chondroitin sulfate / dermatan sulfate16/370421/84652.61e-036.77e-033.45e-0316
hsa005321Oral cavityOSCCGlycosaminoglycan biosynthesis - chondroitin sulfate / dermatan sulfate16/370421/84652.61e-036.77e-033.45e-0316
Page: 1 

Top

Cell-cell communication analysis

check buttonIdentification of potential cell-cell interactions between two cell types and their ligand-receptor pairs for different disease states
LigandReceptorLRpairPathwayTissueDisease Stage
Page: 1 

Top

Single-cell gene regulatory network inference analysis

check buttonFind out the significant the regulons (TFs) and the target genes of each regulon across cell types for different disease states
TFCell TypeTissueDisease StageTarget GeneRSSRegulon Activity
∗The dot plots of a searched regulon are shown for all cell subpopulations in each disease state of each tissue based on the regulon specific score inferred using pySCENIC and by calculating the average expression.
Page: 1 

Top

Somatic mutation of malignant transformation related genes

check buttonAnnotation of somatic variants for genes involved in malignant transformation
Hugo SymbolVariant ClassVariant ClassificationdbSNP RSHGVScHGVSpHGVSp ShortSWISSPROTBIOTYPESIFTPolyPhenTumor Sample BarcodeTissueHistologySexAgeStageTherapy TypesDrugsOutcome
B3GAT3SNVMissense_Mutationnovelc.87N>Tp.Gln29Hisp.Q29HO94766protein_codingdeleterious(0.01)probably_damaging(0.936)TCGA-A8-A08L-01Breastbreast invasive carcinomaFemale>=65III/IVUnknownUnknownSD
B3GAT3SNVMissense_Mutationrs868665260c.928N>Tp.Arg310Trpp.R310WO94766protein_codingdeleterious(0)probably_damaging(1)TCGA-B6-A0RG-01Breastbreast invasive carcinomaFemale<65I/IIUnknownUnknownSD
B3GAT3SNVMissense_Mutationnovelc.94N>Ap.Asp32Asnp.D32NO94766protein_codingtolerated(0.08)probably_damaging(0.994)TCGA-EW-A3U0-01Breastbreast invasive carcinomaFemale<65III/IVChemotherapycisplatinCR
B3GAT3SNVMissense_Mutationnovelc.674G>Ap.Arg225Glnp.R225QO94766protein_codingtolerated(0.11)possibly_damaging(0.691)TCGA-EA-A3HU-01Cervixcervical & endocervical cancerFemale<65I/IIUnknownUnknownSD
B3GAT3SNVMissense_Mutationrs562657438c.632G>Ap.Arg211Hisp.R211HO94766protein_codingdeleterious(0.03)benign(0.028)TCGA-EA-A410-01Cervixcervical & endocervical cancerFemale<65I/IIUnknownUnknownSD
B3GAT3SNVMissense_Mutationc.563N>Tp.Gly188Valp.G188VO94766protein_codingdeleterious(0)probably_damaging(1)TCGA-AG-A002-01Colorectumrectum adenocarcinomaMale<65I/IIUnknownUnknownSD
B3GAT3SNVMissense_Mutationnovelc.17A>Tp.Lys6Metp.K6MO94766protein_codingdeleterious(0)probably_damaging(0.927)TCGA-A5-A0G1-01Endometriumuterine corpus endometrioid carcinomaFemale>=65I/IIUnknownUnknownSD
B3GAT3SNVMissense_Mutationnovelc.583N>Ap.Asp195Asnp.D195NO94766protein_codingdeleterious(0)probably_damaging(0.981)TCGA-A5-A0G2-01Endometriumuterine corpus endometrioid carcinomaFemale<65III/IVUnknownUnknownSD
B3GAT3SNVMissense_Mutationnovelc.872N>Ap.Pro291Hisp.P291HO94766protein_codingtolerated(0.06)possibly_damaging(0.618)TCGA-A5-A2K3-01Endometriumuterine corpus endometrioid carcinomaFemale>=65I/IIChemotherapycarboplatinSD
B3GAT3SNVMissense_Mutationrs768684929c.622N>Tp.Arg208Cysp.R208CO94766protein_codingdeleterious(0)probably_damaging(0.996)TCGA-A5-A2K3-01Endometriumuterine corpus endometrioid carcinomaFemale>=65I/IIChemotherapycarboplatinSD
Page: 1 2 3 4 

Top

Related drugs of malignant transformation related genes

check buttonIdentification of chemicals and drugs interact with genes involved in malignant transfromation
(DGIdb 4.0)
Entrez IDSymbolCategoryInteraction TypesDrug Claim NameDrug NamePMIDs
Page: 1