
|
|||||
|
 | |
| |
| |
| |
| |
| |
|
Gene: ATF6B |
Gene summary for ATF6B |
| Gene information | Species | Human | Gene symbol | ATF6B | Gene ID | 1388 |
| Gene name | activating transcription factor 6 beta | |
| Gene Alias | CREB-RP | |
| Cytomap | 6p21.32 | |
| Gene Type | protein-coding | GO ID | GO:0006139 | UniProtAcc | A0A1U9X796 |
Top |
Malignant transformation analysis |
| Identification of the aberrant gene expression in precancerous and cancerous lesions by comparing the gene expression of stem-like cells in diseased tissues with normal stem cells |
| Entrez ID | Symbol | Replicates | Species | Organ | Tissue | Adj P-value | Log2FC | Malignancy |
| 1388 | ATF6B | LZE4T | Human | Esophagus | ESCC | 2.03e-21 | 6.10e-01 | 0.0811 |
| 1388 | ATF6B | LZE5T | Human | Esophagus | ESCC | 4.98e-02 | 3.56e-01 | 0.0514 |
| 1388 | ATF6B | LZE7T | Human | Esophagus | ESCC | 3.08e-09 | 4.93e-01 | 0.0667 |
| 1388 | ATF6B | LZE8T | Human | Esophagus | ESCC | 1.26e-16 | 3.86e-01 | 0.067 |
| 1388 | ATF6B | LZE20T | Human | Esophagus | ESCC | 1.60e-13 | 6.50e-01 | 0.0662 |
| 1388 | ATF6B | LZE22D1 | Human | Esophagus | HGIN | 7.86e-07 | 2.75e-01 | 0.0595 |
| 1388 | ATF6B | LZE22T | Human | Esophagus | ESCC | 2.69e-10 | 6.31e-01 | 0.068 |
| 1388 | ATF6B | LZE24T | Human | Esophagus | ESCC | 3.00e-32 | 8.13e-01 | 0.0596 |
| 1388 | ATF6B | LZE21T | Human | Esophagus | ESCC | 6.14e-04 | 4.05e-01 | 0.0655 |
| 1388 | ATF6B | LZE6T | Human | Esophagus | ESCC | 1.16e-11 | 5.06e-01 | 0.0845 |
| 1388 | ATF6B | P1T-E | Human | Esophagus | ESCC | 6.15e-21 | 7.41e-01 | 0.0875 |
| 1388 | ATF6B | P2T-E | Human | Esophagus | ESCC | 1.90e-65 | 1.14e+00 | 0.1177 |
| 1388 | ATF6B | P4T-E | Human | Esophagus | ESCC | 3.65e-42 | 9.45e-01 | 0.1323 |
| 1388 | ATF6B | P5T-E | Human | Esophagus | ESCC | 5.33e-21 | 4.60e-01 | 0.1327 |
| 1388 | ATF6B | P8T-E | Human | Esophagus | ESCC | 4.02e-45 | 9.13e-01 | 0.0889 |
| 1388 | ATF6B | P9T-E | Human | Esophagus | ESCC | 7.07e-26 | 4.57e-01 | 0.1131 |
| 1388 | ATF6B | P10T-E | Human | Esophagus | ESCC | 2.35e-18 | 3.59e-01 | 0.116 |
| 1388 | ATF6B | P11T-E | Human | Esophagus | ESCC | 5.43e-25 | 1.07e+00 | 0.1426 |
| 1388 | ATF6B | P12T-E | Human | Esophagus | ESCC | 2.56e-48 | 8.27e-01 | 0.1122 |
| 1388 | ATF6B | P15T-E | Human | Esophagus | ESCC | 6.29e-38 | 7.09e-01 | 0.1149 |
| Page: 1 2 3 4 5 6 7 |
| Tissue | Expression Dynamics | Abbreviation |
| Esophagus | 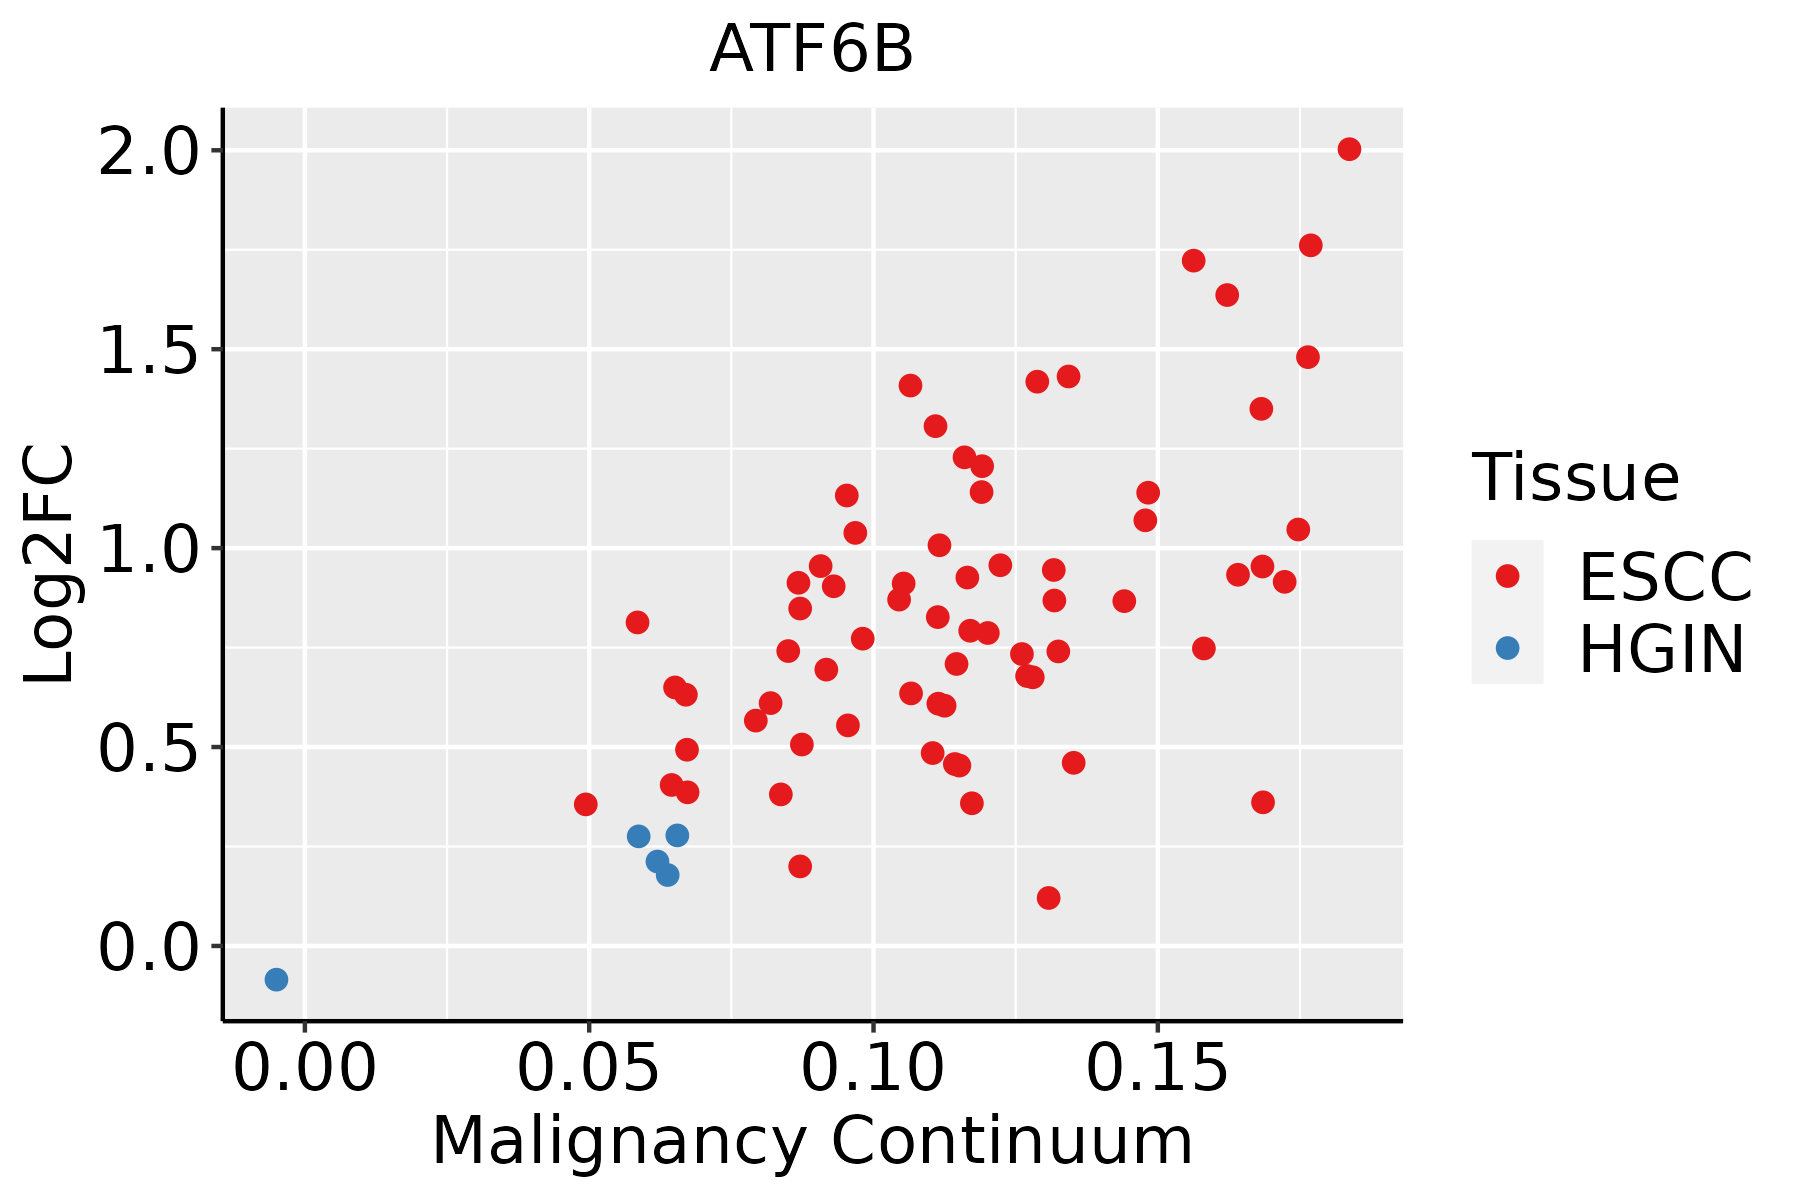 | ESCC: Esophageal squamous cell carcinoma |
| HGIN: High-grade intraepithelial neoplasias | ||
| LGIN: Low-grade intraepithelial neoplasias | ||
| Liver |  | HCC: Hepatocellular carcinoma |
| NAFLD: Non-alcoholic fatty liver disease | ||
| Oral Cavity | 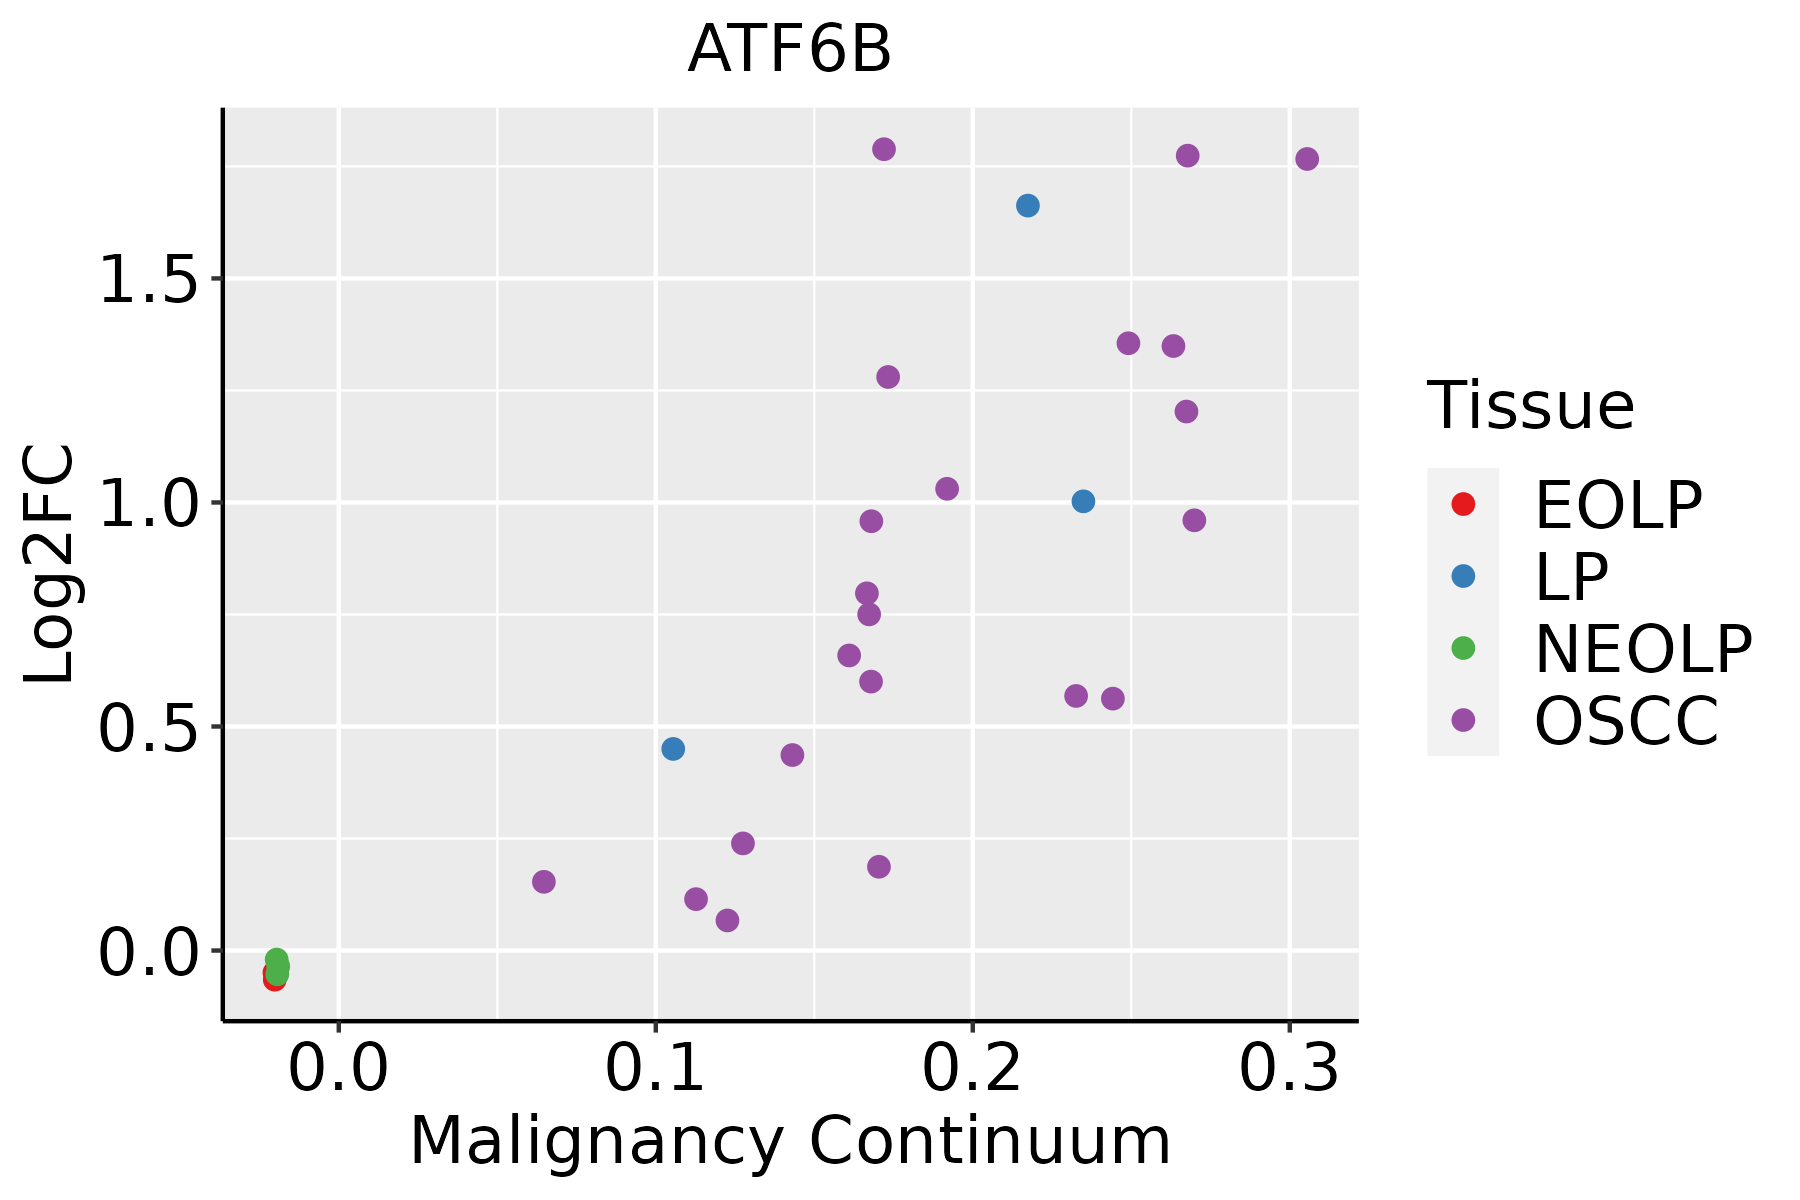 | EOLP: Erosive Oral lichen planus |
| LP: leukoplakia | ||
| NEOLP: Non-erosive oral lichen planus | ||
| OSCC: Oral squamous cell carcinoma | ||
| Skin |  | AK: Actinic keratosis |
| cSCC: Cutaneous squamous cell carcinoma | ||
| SCCIS:squamous cell carcinoma in situ | ||
| Thyroid |  | ATC: Anaplastic thyroid cancer |
| HT: Hashimoto's thyroiditis | ||
| PTC: Papillary thyroid cancer |
| ∗log2FC in expression of this searched gene in stem-like cells from each diseased tissue sample relative to stem-like cells in normal samples in each tissue plotted against the malignancy continuum. Samples are colored based on if they are from different disease stage. |
Top |
Malignant transformation related pathway analysis |
| Find out the enriched GO biological processes and KEGG pathways involved in transition from healthy to precancer to cancer |
| Tissue | Disease Stage | Enriched GO biological Processes |
| Colorectum | AD |  |
| Colorectum | SER |  |
| Colorectum | MSS |  |
| Colorectum | MSI-H |  |
| Colorectum | FAP |  |
| ∗Top 15 enriched GO BP terms are showed in the bar plot of each disease state in each tissue. Each row represents a significant GO biological process which is colored according to the -log10(p.adjust). |
| Page: 1 2 3 4 5 6 7 8 9 |
| GO ID | Tissue | Disease Stage | Description | Gene Ratio | Bg Ratio | pvalue | p.adjust | Count |
| GO:1905897111 | Esophagus | ESCC | regulation of response to endoplasmic reticulum stress | 63/8552 | 82/18723 | 8.16e-09 | 1.66e-07 | 63 |
| GO:000698416 | Esophagus | ESCC | ER-nucleus signaling pathway | 38/8552 | 46/18723 | 2.70e-07 | 4.00e-06 | 38 |
| GO:1903573111 | Esophagus | ESCC | negative regulation of response to endoplasmic reticulum stress | 34/8552 | 44/18723 | 1.90e-05 | 1.67e-04 | 34 |
| GO:0036003110 | Esophagus | ESCC | positive regulation of transcription from RNA polymerase II promoter in response to stress | 21/8552 | 24/18723 | 2.57e-05 | 2.17e-04 | 21 |
| GO:190010110 | Esophagus | ESCC | regulation of endoplasmic reticulum unfolded protein response | 24/8552 | 30/18723 | 1.27e-04 | 8.67e-04 | 24 |
| GO:00349767 | Liver | Cirrhotic | response to endoplasmic reticulum stress | 130/4634 | 256/18723 | 1.72e-19 | 3.86e-17 | 130 |
| GO:00359667 | Liver | Cirrhotic | response to topologically incorrect protein | 91/4634 | 159/18723 | 2.07e-18 | 3.60e-16 | 91 |
| GO:00069867 | Liver | Cirrhotic | response to unfolded protein | 79/4634 | 137/18723 | 1.99e-16 | 2.49e-14 | 79 |
| GO:00359677 | Liver | Cirrhotic | cellular response to topologically incorrect protein | 64/4634 | 116/18723 | 2.20e-12 | 1.62e-10 | 64 |
| GO:00346207 | Liver | Cirrhotic | cellular response to unfolded protein | 54/4634 | 96/18723 | 4.16e-11 | 2.42e-09 | 54 |
| GO:00309686 | Liver | Cirrhotic | endoplasmic reticulum unfolded protein response | 43/4634 | 74/18723 | 9.86e-10 | 4.48e-08 | 43 |
| GO:19058977 | Liver | Cirrhotic | regulation of response to endoplasmic reticulum stress | 46/4634 | 82/18723 | 1.28e-09 | 5.56e-08 | 46 |
| GO:00069844 | Liver | Cirrhotic | ER-nucleus signaling pathway | 29/4634 | 46/18723 | 4.23e-08 | 1.36e-06 | 29 |
| GO:19035737 | Liver | Cirrhotic | negative regulation of response to endoplasmic reticulum stress | 26/4634 | 44/18723 | 1.30e-06 | 2.59e-05 | 26 |
| GO:19001015 | Liver | Cirrhotic | regulation of endoplasmic reticulum unfolded protein response | 19/4634 | 30/18723 | 8.57e-06 | 1.27e-04 | 19 |
| GO:004361812 | Liver | Cirrhotic | regulation of transcription from RNA polymerase II promoter in response to stress | 24/4634 | 47/18723 | 9.00e-05 | 9.67e-04 | 24 |
| GO:004362012 | Liver | Cirrhotic | regulation of DNA-templated transcription in response to stress | 26/4634 | 53/18723 | 1.11e-04 | 1.12e-03 | 26 |
| GO:00360035 | Liver | Cirrhotic | positive regulation of transcription from RNA polymerase II promoter in response to stress | 14/4634 | 24/18723 | 4.64e-04 | 3.75e-03 | 14 |
| GO:19001022 | Liver | Cirrhotic | negative regulation of endoplasmic reticulum unfolded protein response | 10/4634 | 15/18723 | 7.26e-04 | 5.36e-03 | 10 |
| GO:19904401 | Liver | Cirrhotic | positive regulation of transcription from RNA polymerase II promoter in response to endoplasmic reticulum stress | 7/4634 | 11/18723 | 7.11e-03 | 3.41e-02 | 7 |
| Page: 1 2 3 4 5 6 7 |
| Pathway ID | Tissue | Disease Stage | Description | Gene Ratio | Bg Ratio | pvalue | p.adjust | qvalue | Count |
| hsa0502030 | Esophagus | HGIN | Prion disease | 117/1383 | 273/8465 | 4.15e-26 | 3.38e-24 | 2.69e-24 | 117 |
| hsa0414139 | Esophagus | HGIN | Protein processing in endoplasmic reticulum | 67/1383 | 174/8465 | 1.06e-12 | 2.16e-11 | 1.72e-11 | 67 |
| hsa052039 | Esophagus | HGIN | Viral carcinogenesis | 53/1383 | 204/8465 | 2.58e-04 | 2.71e-03 | 2.15e-03 | 53 |
| hsa0516639 | Esophagus | HGIN | Human T-cell leukemia virus 1 infection | 51/1383 | 222/8465 | 5.84e-03 | 4.05e-02 | 3.22e-02 | 51 |
| hsa0516330 | Esophagus | HGIN | Human cytomegalovirus infection | 51/1383 | 225/8465 | 7.67e-03 | 4.63e-02 | 3.68e-02 | 51 |
| hsa05020113 | Esophagus | HGIN | Prion disease | 117/1383 | 273/8465 | 4.15e-26 | 3.38e-24 | 2.69e-24 | 117 |
| hsa04141114 | Esophagus | HGIN | Protein processing in endoplasmic reticulum | 67/1383 | 174/8465 | 1.06e-12 | 2.16e-11 | 1.72e-11 | 67 |
| hsa0520315 | Esophagus | HGIN | Viral carcinogenesis | 53/1383 | 204/8465 | 2.58e-04 | 2.71e-03 | 2.15e-03 | 53 |
| hsa05166114 | Esophagus | HGIN | Human T-cell leukemia virus 1 infection | 51/1383 | 222/8465 | 5.84e-03 | 4.05e-02 | 3.22e-02 | 51 |
| hsa05163113 | Esophagus | HGIN | Human cytomegalovirus infection | 51/1383 | 225/8465 | 7.67e-03 | 4.63e-02 | 3.68e-02 | 51 |
| hsa04141211 | Esophagus | ESCC | Protein processing in endoplasmic reticulum | 147/4205 | 174/8465 | 3.29e-22 | 1.10e-19 | 5.64e-20 | 147 |
| hsa05166211 | Esophagus | ESCC | Human T-cell leukemia virus 1 infection | 164/4205 | 222/8465 | 8.13e-14 | 2.09e-12 | 1.07e-12 | 164 |
| hsa05020210 | Esophagus | ESCC | Prion disease | 193/4205 | 273/8465 | 6.42e-13 | 1.34e-11 | 6.89e-12 | 193 |
| hsa0466810 | Esophagus | ESCC | TNF signaling pathway | 89/4205 | 114/8465 | 3.36e-10 | 4.01e-09 | 2.06e-09 | 89 |
| hsa0520325 | Esophagus | ESCC | Viral carcinogenesis | 137/4205 | 204/8465 | 2.47e-07 | 1.88e-06 | 9.62e-07 | 137 |
| hsa05163210 | Esophagus | ESCC | Human cytomegalovirus infection | 148/4205 | 225/8465 | 5.73e-07 | 4.00e-06 | 2.05e-06 | 148 |
| hsa051619 | Esophagus | ESCC | Hepatitis B | 108/4205 | 162/8465 | 7.68e-06 | 4.15e-05 | 2.12e-05 | 108 |
| hsa049268 | Esophagus | ESCC | Relaxin signaling pathway | 81/4205 | 129/8465 | 1.72e-03 | 5.09e-03 | 2.61e-03 | 81 |
| hsa0421114 | Esophagus | ESCC | Longevity regulating pathway | 58/4205 | 89/8465 | 2.19e-03 | 6.16e-03 | 3.16e-03 | 58 |
| hsa0492816 | Esophagus | ESCC | Parathyroid hormone synthesis, secretion and action | 66/4205 | 106/8465 | 5.86e-03 | 1.47e-02 | 7.51e-03 | 66 |
| Page: 1 2 3 4 5 |
Top |
Cell-cell communication analysis |
| Identification of potential cell-cell interactions between two cell types and their ligand-receptor pairs for different disease states |
| Ligand | Receptor | LRpair | Pathway | Tissue | Disease Stage |
| Page: 1 |
Top |
Single-cell gene regulatory network inference analysis |
| Find out the significant the regulons (TFs) and the target genes of each regulon across cell types for different disease states |
| TF | Cell Type | Tissue | Disease Stage | Target Gene | RSS | Regulon Activity |
| ATF6B | ASC | Colorectum | MSS | ARVCF,CERS4,NHP2, etc. | 4.17e-01 |  |
| ATF6B | TFH | Colorectum | Healthy | PLEKHG7,MAST3,INTS7, etc. | 1.08e-01 |  |
| ATF6B | INCAF | Colorectum | Healthy | SPRY1,PIGR,PPARG, etc. | 1.29e-01 | |
| ATF6B | CD8TEFF | Endometrium | EEC | PNISR,MT-ND1,MT-ATP6, etc. | 1.68e-01 |  |
| ATF6B | STM | Liver | Healthy | LYRM5,CDKN2B,PCSK1N, etc. | 6.52e-01 |  |
| ATF6B | MSC.MVA | Liver | HCC | GJA5,FBLN5,DLL4, etc. | 1.11e-01 |  |
| ATF6B | CD8TCM | Skin | ADJ | SDC1,PRNP,APOBEC3H, etc. | 1.55e-02 |  |
| ∗The dot plots of a searched regulon are shown for all cell subpopulations in each disease state of each tissue based on the regulon specific score inferred using pySCENIC and by calculating the average expression. |
| Page: 1 |
Top |
Somatic mutation of malignant transformation related genes |
| Annotation of somatic variants for genes involved in malignant transformation |
| Hugo Symbol | Variant Class | Variant Classification | dbSNP RS | HGVSc | HGVSp | HGVSp Short | SWISSPROT | BIOTYPE | SIFT | PolyPhen | Tumor Sample Barcode | Tissue | Histology | Sex | Age | Stage | Therapy Types | Drugs | Outcome |
| ATF6B | SNV | Missense_Mutation | c.2104N>A | p.His702Asn | p.H702N | Q99941 | protein_coding | deleterious_low_confidence(0) | probably_damaging(0.954) | TCGA-A8-A08R-01 | Breast | breast invasive carcinoma | Female | <65 | I/II | Unknown | Unknown | SD | |
| ATF6B | SNV | Missense_Mutation | rs372075542 | c.1994N>T | p.Ser665Leu | p.S665L | Q99941 | protein_coding | tolerated(0.21) | benign(0.401) | TCGA-5M-AAT4-01 | Colorectum | colon adenocarcinoma | Male | >=65 | III/IV | Unknown | Unknown | PD |
| ATF6B | SNV | Missense_Mutation | c.53N>T | p.Thr18Ile | p.T18I | Q99941 | protein_coding | deleterious(0.01) | benign(0.265) | TCGA-AA-3663-01 | Colorectum | colon adenocarcinoma | Male | <65 | I/II | Unknown | Unknown | SD | |
| ATF6B | SNV | Missense_Mutation | c.1987N>T | p.Pro663Ser | p.P663S | Q99941 | protein_coding | deleterious(0) | probably_damaging(0.998) | TCGA-AD-6964-01 | Colorectum | colon adenocarcinoma | Male | <65 | III/IV | Chemotherapy | folfox | PD | |
| ATF6B | SNV | Missense_Mutation | c.1482G>C | p.Gln494His | p.Q494H | Q99941 | protein_coding | tolerated(0.14) | benign(0.003) | TCGA-AY-6196-01 | Colorectum | colon adenocarcinoma | Male | <65 | III/IV | Unknown | Unknown | SD | |
| ATF6B | SNV | Missense_Mutation | c.1640N>T | p.Pro547Leu | p.P547L | Q99941 | protein_coding | tolerated(0.73) | benign(0) | TCGA-CA-6717-01 | Colorectum | colon adenocarcinoma | Male | <65 | I/II | Chemotherapy | oxaliplatin | CR | |
| ATF6B | SNV | Missense_Mutation | c.856N>A | p.Gly286Ser | p.G286S | Q99941 | protein_coding | tolerated(0.77) | possibly_damaging(0.696) | TCGA-CM-5341-01 | Colorectum | colon adenocarcinoma | Female | >=65 | III/IV | Chemotherapy | fluorouracil | SD | |
| ATF6B | SNV | Missense_Mutation | c.1022N>G | p.Gln341Arg | p.Q341R | Q99941 | protein_coding | deleterious(0) | probably_damaging(0.989) | TCGA-G4-6302-01 | Colorectum | colon adenocarcinoma | Female | >=65 | I/II | Unknown | Unknown | SD | |
| ATF6B | insertion | In_Frame_Ins | novel | c.1084_1085insTCTCAC | p.Ala362delinsValSerPro | p.A362delinsVSP | Q99941 | protein_coding | TCGA-AM-5820-01 | Colorectum | colon adenocarcinoma | Female | <65 | I/II | Unknown | Unknown | SD | ||
| ATF6B | deletion | Frame_Shift_Del | c.1992delN | p.Ser665ArgfsTer46 | p.S665Rfs*46 | Q99941 | protein_coding | TCGA-WS-AB45-01 | Colorectum | colon adenocarcinoma | Female | <65 | I/II | Unknown | Unknown | SD |
| Page: 1 2 3 4 |
Top |
Related drugs of malignant transformation related genes |
| Identification of chemicals and drugs interact with genes involved in malignant transfromation |
| (DGIdb 4.0) |
| Entrez ID | Symbol | Category | Interaction Types | Drug Claim Name | Drug Name | PMIDs |
| Page: 1 |

Copyright 2023-Present -The University of Texas Health Science Center at Houston |