
|
|||||
|
 | |
| |
| |
| |
| |
| |
|
Gene: ATF5 |
Gene summary for ATF5 |
| Gene information | Species | Human | Gene symbol | ATF5 | Gene ID | 22809 |
| Gene name | activating transcription factor 5 | |
| Gene Alias | ATFX | |
| Cytomap | 19q13.33 | |
| Gene Type | protein-coding | GO ID | GO:0000226 | UniProtAcc | A0A024QZG3 |
Top |
Malignant transformation analysis |
| Identification of the aberrant gene expression in precancerous and cancerous lesions by comparing the gene expression of stem-like cells in diseased tissues with normal stem cells |
| Entrez ID | Symbol | Replicates | Species | Organ | Tissue | Adj P-value | Log2FC | Malignancy |
| 22809 | ATF5 | HTA11_1938_2000001011 | Human | Colorectum | AD | 1.02e-10 | 4.03e-01 | -0.0811 |
| 22809 | ATF5 | HTA11_347_2000001011 | Human | Colorectum | AD | 1.26e-08 | 2.71e-01 | -0.1954 |
| 22809 | ATF5 | HTA11_411_2000001011 | Human | Colorectum | SER | 4.58e-03 | 4.77e-01 | -0.2602 |
| 22809 | ATF5 | HTA11_3361_2000001011 | Human | Colorectum | AD | 3.06e-02 | 2.39e-01 | -0.1207 |
| 22809 | ATF5 | HTA11_696_2000001011 | Human | Colorectum | AD | 1.54e-12 | 2.88e-01 | -0.1464 |
| 22809 | ATF5 | HTA11_866_2000001011 | Human | Colorectum | AD | 1.97e-06 | 2.04e-01 | -0.1001 |
| 22809 | ATF5 | HTA11_1391_2000001011 | Human | Colorectum | AD | 1.54e-11 | 4.08e-01 | -0.059 |
| 22809 | ATF5 | HTA11_2992_2000001011 | Human | Colorectum | SER | 4.94e-02 | 2.82e-01 | -0.1706 |
| 22809 | ATF5 | HTA11_546_2000001011 | Human | Colorectum | AD | 1.92e-05 | 3.04e-01 | -0.0842 |
| 22809 | ATF5 | HTA11_7862_2000001011 | Human | Colorectum | AD | 5.85e-03 | 2.59e-01 | -0.0179 |
| 22809 | ATF5 | HTA11_866_3004761011 | Human | Colorectum | AD | 5.57e-09 | 3.12e-01 | 0.096 |
| 22809 | ATF5 | HTA11_7696_3000711011 | Human | Colorectum | AD | 8.47e-22 | 4.87e-01 | 0.0674 |
| 22809 | ATF5 | HTA11_6818_2000001021 | Human | Colorectum | AD | 1.41e-05 | 3.16e-01 | 0.0588 |
| 22809 | ATF5 | HTA11_99999970781_79442 | Human | Colorectum | MSS | 4.43e-05 | 1.55e-01 | 0.294 |
| 22809 | ATF5 | HTA11_99999965104_69814 | Human | Colorectum | MSS | 2.77e-02 | 1.85e-01 | 0.281 |
| 22809 | ATF5 | HTA11_99999971662_82457 | Human | Colorectum | MSS | 3.70e-05 | 2.40e-01 | 0.3859 |
| 22809 | ATF5 | HTA11_99999974143_84620 | Human | Colorectum | MSS | 1.49e-08 | 2.68e-01 | 0.3005 |
| 22809 | ATF5 | LZE7T | Human | Esophagus | ESCC | 9.45e-08 | 6.94e-01 | 0.0667 |
| 22809 | ATF5 | LZE24T | Human | Esophagus | ESCC | 1.75e-09 | 5.55e-01 | 0.0596 |
| 22809 | ATF5 | P1T-E | Human | Esophagus | ESCC | 1.53e-13 | 9.25e-01 | 0.0875 |
| Page: 1 2 3 4 5 6 |
| Tissue | Expression Dynamics | Abbreviation |
| Colorectum (GSE201348) |  | FAP: Familial adenomatous polyposis |
| CRC: Colorectal cancer | ||
| Colorectum (HTA11) |  | AD: Adenomas |
| SER: Sessile serrated lesions | ||
| MSI-H: Microsatellite-high colorectal cancer | ||
| MSS: Microsatellite stable colorectal cancer | ||
| Esophagus | 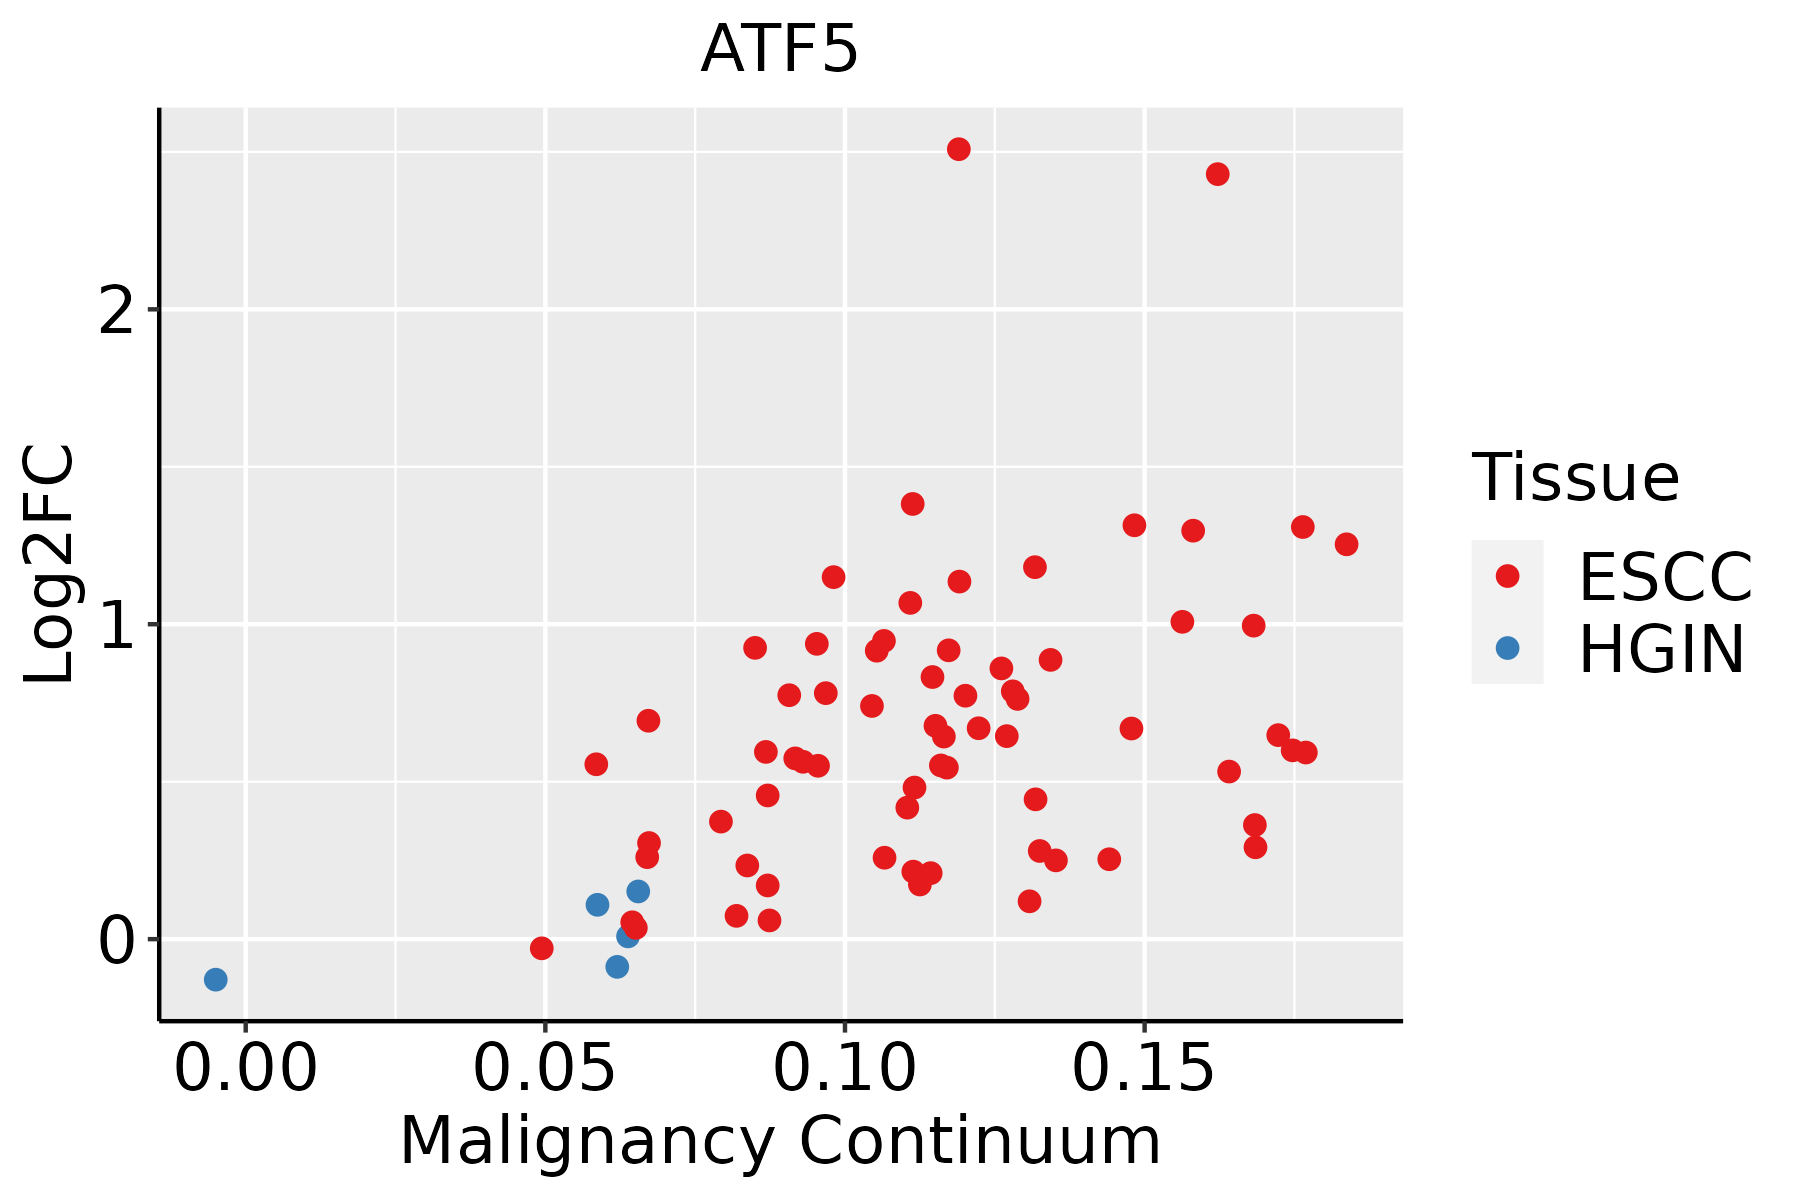 | ESCC: Esophageal squamous cell carcinoma |
| HGIN: High-grade intraepithelial neoplasias | ||
| LGIN: Low-grade intraepithelial neoplasias | ||
| Liver |  | HCC: Hepatocellular carcinoma |
| NAFLD: Non-alcoholic fatty liver disease | ||
| Oral Cavity | 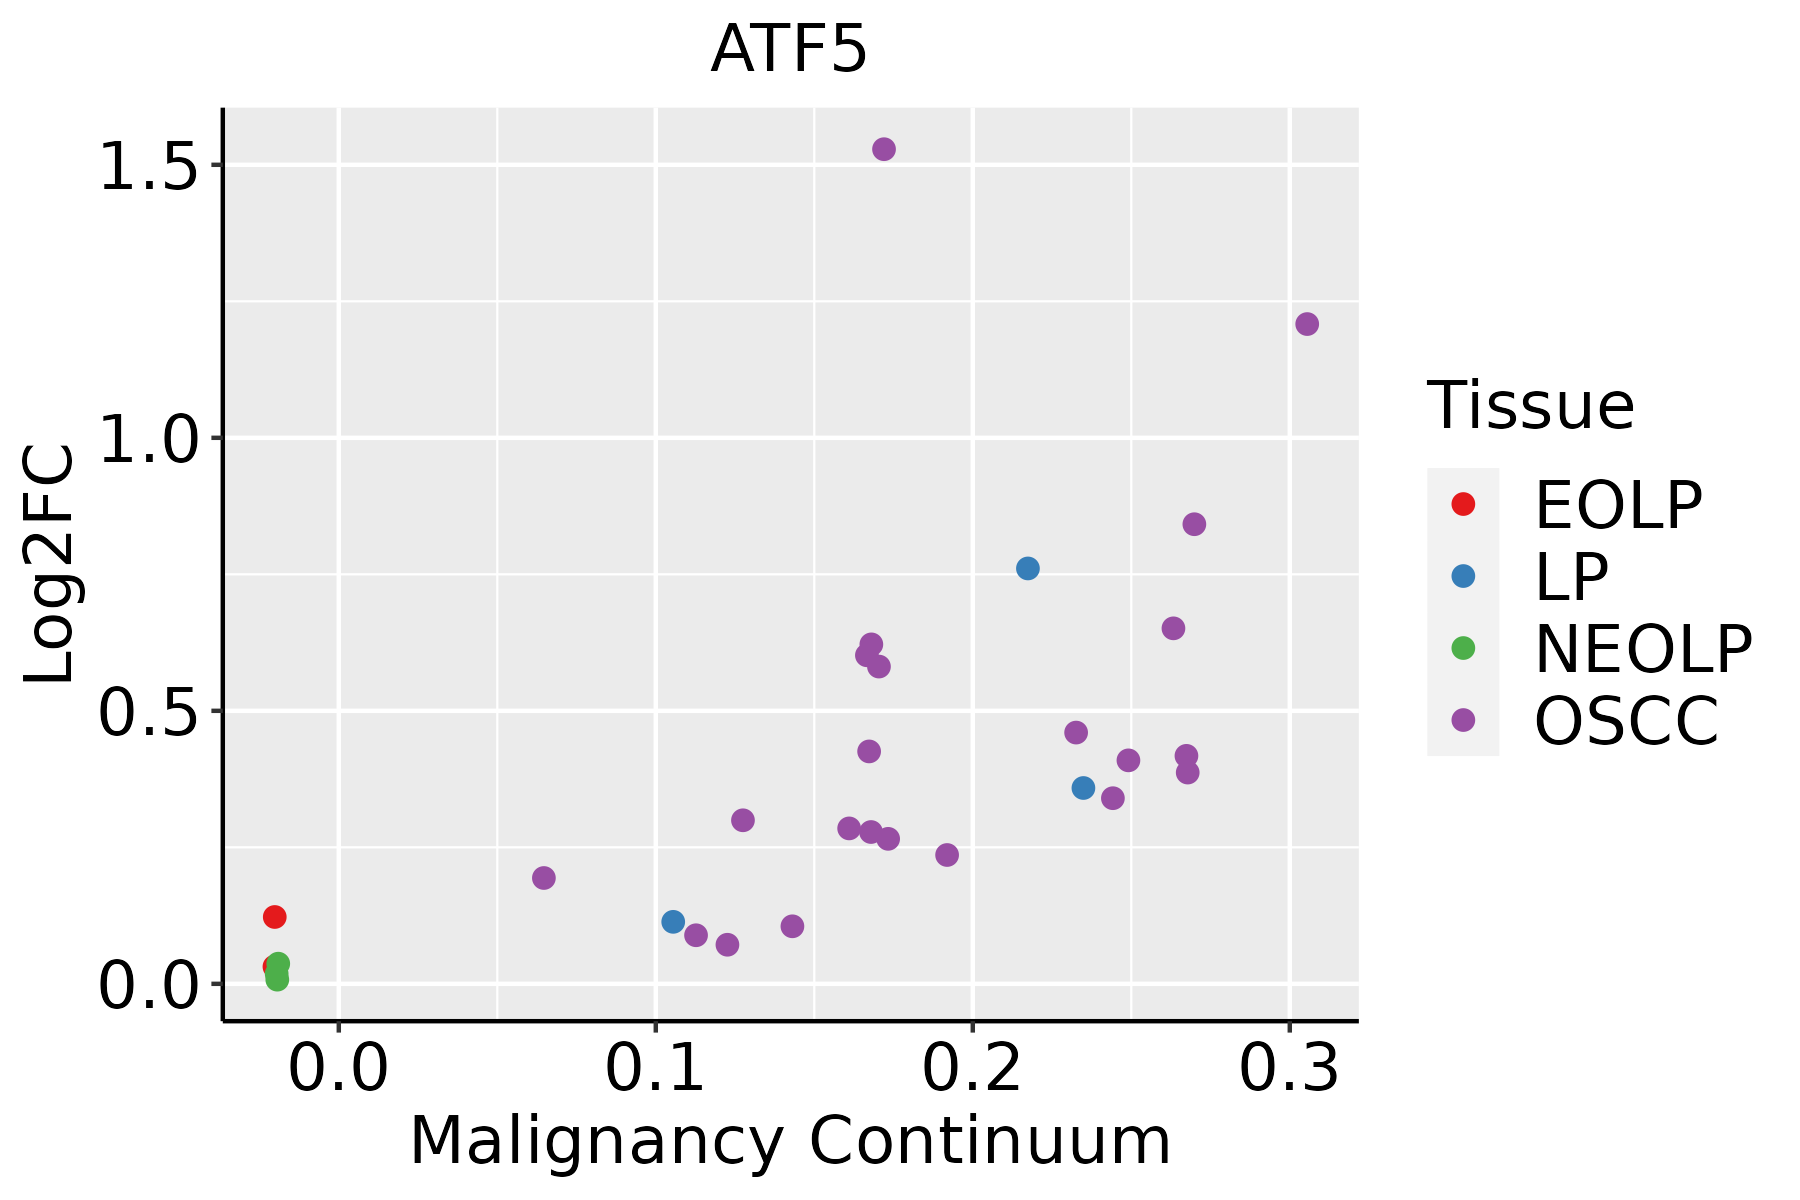 | EOLP: Erosive Oral lichen planus |
| LP: leukoplakia | ||
| NEOLP: Non-erosive oral lichen planus | ||
| OSCC: Oral squamous cell carcinoma | ||
| Thyroid |  | ATC: Anaplastic thyroid cancer |
| HT: Hashimoto's thyroiditis | ||
| PTC: Papillary thyroid cancer |
| ∗log2FC in expression of this searched gene in stem-like cells from each diseased tissue sample relative to stem-like cells in normal samples in each tissue plotted against the malignancy continuum. Samples are colored based on if they are from different disease stage. |
Top |
Malignant transformation related pathway analysis |
| Find out the enriched GO biological processes and KEGG pathways involved in transition from healthy to precancer to cancer |
| Tissue | Disease Stage | Enriched GO biological Processes |
| Colorectum | AD |  |
| Colorectum | SER |  |
| Colorectum | MSS |  |
| Colorectum | MSI-H |  |
| Colorectum | FAP |  |
| ∗Top 15 enriched GO BP terms are showed in the bar plot of each disease state in each tissue. Each row represents a significant GO biological process which is colored according to the -log10(p.adjust). |
| Page: 1 2 3 4 5 6 7 8 9 |
| GO ID | Tissue | Disease Stage | Description | Gene Ratio | Bg Ratio | pvalue | p.adjust | Count |
| GO:00097919 | Esophagus | ESCC | post-embryonic development | 56/8552 | 80/18723 | 9.08e-06 | 8.71e-05 | 56 |
| GO:19027491 | Esophagus | ESCC | regulation of cell cycle G2/M phase transition | 68/8552 | 102/18723 | 1.48e-05 | 1.33e-04 | 68 |
| GO:00454449 | Esophagus | ESCC | fat cell differentiation | 135/8552 | 229/18723 | 3.38e-05 | 2.78e-04 | 135 |
| GO:19027501 | Esophagus | ESCC | negative regulation of cell cycle G2/M phase transition | 42/8552 | 62/18723 | 3.69e-04 | 2.14e-03 | 42 |
| GO:00352647 | Esophagus | ESCC | multicellular organism growth | 80/8552 | 132/18723 | 3.84e-04 | 2.22e-03 | 80 |
| GO:004851118 | Esophagus | ESCC | rhythmic process | 164/8552 | 298/18723 | 6.80e-04 | 3.57e-03 | 164 |
| GO:000762319 | Esophagus | ESCC | circadian rhythm | 119/8552 | 210/18723 | 8.47e-04 | 4.36e-03 | 119 |
| GO:00328864 | Esophagus | ESCC | regulation of microtubule-based process | 134/8552 | 240/18723 | 9.44e-04 | 4.80e-03 | 134 |
| GO:00485115 | Liver | NAFLD | rhythmic process | 56/1882 | 298/18723 | 3.03e-06 | 1.23e-04 | 56 |
| GO:00076236 | Liver | NAFLD | circadian rhythm | 42/1882 | 210/18723 | 1.06e-05 | 3.34e-04 | 42 |
| GO:00352643 | Liver | NAFLD | multicellular organism growth | 27/1882 | 132/18723 | 2.57e-04 | 4.19e-03 | 27 |
| GO:1901987 | Liver | NAFLD | regulation of cell cycle phase transition | 56/1882 | 390/18723 | 4.01e-03 | 3.36e-02 | 56 |
| GO:000762312 | Liver | Cirrhotic | circadian rhythm | 84/4634 | 210/18723 | 7.04e-07 | 1.50e-05 | 84 |
| GO:004851111 | Liver | Cirrhotic | rhythmic process | 103/4634 | 298/18723 | 8.47e-05 | 9.19e-04 | 103 |
| GO:003526411 | Liver | Cirrhotic | multicellular organism growth | 47/4634 | 132/18723 | 3.40e-03 | 1.89e-02 | 47 |
| GO:00454442 | Liver | Cirrhotic | fat cell differentiation | 73/4634 | 229/18723 | 8.57e-03 | 3.97e-02 | 73 |
| GO:19019871 | Liver | HCC | regulation of cell cycle phase transition | 211/7958 | 390/18723 | 2.11e-06 | 2.89e-05 | 211 |
| GO:0045786 | Liver | HCC | negative regulation of cell cycle | 204/7958 | 385/18723 | 1.84e-05 | 1.99e-04 | 204 |
| GO:000762321 | Liver | HCC | circadian rhythm | 117/7958 | 210/18723 | 7.29e-05 | 6.54e-04 | 117 |
| GO:0031023 | Liver | HCC | microtubule organizing center organization | 82/7958 | 143/18723 | 2.38e-04 | 1.79e-03 | 82 |
| Page: 1 2 3 4 5 6 |
| Pathway ID | Tissue | Disease Stage | Description | Gene Ratio | Bg Ratio | pvalue | p.adjust | qvalue | Count |
| Page: 1 |
Top |
Cell-cell communication analysis |
| Identification of potential cell-cell interactions between two cell types and their ligand-receptor pairs for different disease states |
| Ligand | Receptor | LRpair | Pathway | Tissue | Disease Stage |
| Page: 1 |
Top |
Single-cell gene regulatory network inference analysis |
| Find out the significant the regulons (TFs) and the target genes of each regulon across cell types for different disease states |
| TF | Cell Type | Tissue | Disease Stage | Target Gene | RSS | Regulon Activity |
| ATF5 | STM | Cervix | HSIL_HPV | CHP2,MMP12,IL7R, etc. | 2.43e-01 |  |
| ATF5 | ICAF | Cervix | CC | SPP1,IL4I1,NUPR1, etc. | 2.06e-01 |  |
| ATF5 | M2MAC | Endometrium | EEC | IL4I1,ROCK2,FSCN1, etc. | 2.98e-01 |  |
| ATF5 | M2MAC | Endometrium | Healthy | IL4I1,ROCK2,FSCN1, etc. | 3.86e-01 |  |
| ATF5 | PRO | Esophagus | ADJ | RNF187,ARHGEF2,KCNG1, etc. | 8.69e-02 |  |
| ATF5 | GC | Esophagus | ADJ | ZFP2,TIAF1,LINC00460, etc. | 4.01e-01 | |
| ATF5 | GC | Esophagus | ESCC | ZFP2,TIAF1,LINC00460, etc. | 3.32e-01 |  |
| ATF5 | HEP | Liver | NAFLD | ANGPTL8,INHBE,ITIH3, etc. | 7.95e-01 |  |
| ATF5 | KUP | Liver | Cirrhotic | KLRF1,IL4I1,CSTB, etc. | 2.10e-01 |  |
| ATF5 | DC | Liver | Cirrhotic | KLRF1,IL4I1,CSTB, etc. | 1.53e-01 | |
| ∗The dot plots of a searched regulon are shown for all cell subpopulations in each disease state of each tissue based on the regulon specific score inferred using pySCENIC and by calculating the average expression. |
| Page: 1 2 |
Top |
Somatic mutation of malignant transformation related genes |
| Annotation of somatic variants for genes involved in malignant transformation |
| Hugo Symbol | Variant Class | Variant Classification | dbSNP RS | HGVSc | HGVSp | HGVSp Short | SWISSPROT | BIOTYPE | SIFT | PolyPhen | Tumor Sample Barcode | Tissue | Histology | Sex | Age | Stage | Therapy Types | Drugs | Outcome |
| ATF5 | SNV | Missense_Mutation | c.805A>C | p.Ile269Leu | p.I269L | Q9Y2D1 | protein_coding | deleterious(0.05) | probably_damaging(0.928) | TCGA-AQ-A04J-01 | Breast | breast invasive carcinoma | Female | <65 | I/II | Chemotherapy | cytoxan | SD | |
| ATF5 | SNV | Missense_Mutation | novel | c.256N>T | p.Gly86Cys | p.G86C | Q9Y2D1 | protein_coding | tolerated(0.06) | probably_damaging(0.925) | TCGA-BH-A0B4-01 | Breast | breast invasive carcinoma | Male | >=65 | III/IV | Hormone Therapy | tamoxiphen | SD |
| ATF5 | SNV | Missense_Mutation | novel | c.780N>C | p.Glu260Asp | p.E260D | Q9Y2D1 | protein_coding | deleterious(0) | probably_damaging(0.999) | TCGA-C8-A3M8-01 | Breast | breast invasive carcinoma | Female | >=65 | I/II | Hormone Therapy | tamoxiphen | CR |
| ATF5 | SNV | Missense_Mutation | rs755997792 | c.838C>T | p.Arg280Cys | p.R280C | Q9Y2D1 | protein_coding | deleterious(0) | probably_damaging(0.976) | TCGA-E2-A15K-06 | Breast | breast invasive carcinoma | Female | <65 | I/II | Chemotherapy | adriamycin | SD |
| ATF5 | SNV | Missense_Mutation | rs756468104 | c.676N>T | p.Arg226Cys | p.R226C | Q9Y2D1 | protein_coding | deleterious(0) | probably_damaging(0.999) | TCGA-2W-A8YY-01 | Cervix | cervical & endocervical cancer | Female | <65 | I/II | Chemotherapy | cisplatin | CR |
| ATF5 | SNV | Missense_Mutation | c.577N>G | p.Gln193Glu | p.Q193E | Q9Y2D1 | protein_coding | tolerated(1) | benign(0.001) | TCGA-EK-A2R8-01 | Cervix | cervical & endocervical cancer | Female | <65 | I/II | Unknown | Unknown | SD | |
| ATF5 | SNV | Missense_Mutation | c.281C>A | p.Thr94Asn | p.T94N | Q9Y2D1 | protein_coding | tolerated(0.26) | benign(0.005) | TCGA-AA-A00N-01 | Colorectum | colon adenocarcinoma | Male | >=65 | I/II | Unknown | Unknown | PD | |
| ATF5 | SNV | Missense_Mutation | c.711G>T | p.Glu237Asp | p.E237D | Q9Y2D1 | protein_coding | tolerated(0.31) | benign(0.066) | TCGA-AZ-4615-01 | Colorectum | colon adenocarcinoma | Male | >=65 | III/IV | Chemotherapy | xeloda | PD | |
| ATF5 | SNV | Missense_Mutation | novel | c.392N>T | p.Pro131Leu | p.P131L | Q9Y2D1 | protein_coding | tolerated(0.42) | benign(0) | TCGA-D5-6540-01 | Colorectum | colon adenocarcinoma | Male | >=65 | I/II | Unknown | Unknown | SD |
| ATF5 | SNV | Missense_Mutation | rs745985003 | c.73G>A | p.Val25Ile | p.V25I | Q9Y2D1 | protein_coding | tolerated(0.48) | benign(0.042) | TCGA-D5-6927-01 | Colorectum | colon adenocarcinoma | Male | <65 | I/II | Unknown | Unknown | SD |
| Page: 1 2 3 |
Top |
Related drugs of malignant transformation related genes |
| Identification of chemicals and drugs interact with genes involved in malignant transfromation |
| (DGIdb 4.0) |
| Entrez ID | Symbol | Category | Interaction Types | Drug Claim Name | Drug Name | PMIDs |
| Page: 1 |

Copyright 2023-Present -The University of Texas Health Science Center at Houston |