
|
|||||
|
 | |
| |
| |
| |
| |
| |
|
Gene: ASNSD1 |
Gene summary for ASNSD1 |
| Gene information | Species | Human | Gene symbol | ASNSD1 | Gene ID | 54529 |
| Gene name | asparagine synthetase domain containing 1 | |
| Gene Alias | NBLA00058 | |
| Cytomap | 2q32.2 | |
| Gene Type | protein-coding | GO ID | GO:0006082 | UniProtAcc | Q9NWL6 |
Top |
Malignant transformation analysis |
| Identification of the aberrant gene expression in precancerous and cancerous lesions by comparing the gene expression of stem-like cells in diseased tissues with normal stem cells |
| Entrez ID | Symbol | Replicates | Species | Organ | Tissue | Adj P-value | Log2FC | Malignancy |
| 54529 | ASNSD1 | P1T-E | Human | Esophagus | ESCC | 9.30e-08 | 2.70e-01 | 0.0875 |
| 54529 | ASNSD1 | P2T-E | Human | Esophagus | ESCC | 1.74e-22 | 3.25e-01 | 0.1177 |
| 54529 | ASNSD1 | P4T-E | Human | Esophagus | ESCC | 9.98e-31 | 7.12e-01 | 0.1323 |
| 54529 | ASNSD1 | P5T-E | Human | Esophagus | ESCC | 2.72e-16 | 2.92e-01 | 0.1327 |
| 54529 | ASNSD1 | P8T-E | Human | Esophagus | ESCC | 1.92e-16 | 3.83e-01 | 0.0889 |
| 54529 | ASNSD1 | P10T-E | Human | Esophagus | ESCC | 2.68e-14 | 2.55e-01 | 0.116 |
| 54529 | ASNSD1 | P11T-E | Human | Esophagus | ESCC | 1.08e-15 | 5.35e-01 | 0.1426 |
| 54529 | ASNSD1 | P12T-E | Human | Esophagus | ESCC | 4.93e-30 | 6.28e-01 | 0.1122 |
| 54529 | ASNSD1 | P15T-E | Human | Esophagus | ESCC | 5.48e-13 | 4.31e-01 | 0.1149 |
| 54529 | ASNSD1 | P16T-E | Human | Esophagus | ESCC | 1.53e-21 | 3.45e-01 | 0.1153 |
| 54529 | ASNSD1 | P17T-E | Human | Esophagus | ESCC | 6.13e-03 | 3.06e-01 | 0.1278 |
| 54529 | ASNSD1 | P19T-E | Human | Esophagus | ESCC | 4.21e-08 | 5.28e-01 | 0.1662 |
| 54529 | ASNSD1 | P20T-E | Human | Esophagus | ESCC | 5.39e-16 | 3.63e-01 | 0.1124 |
| 54529 | ASNSD1 | P21T-E | Human | Esophagus | ESCC | 2.45e-20 | 4.65e-01 | 0.1617 |
| 54529 | ASNSD1 | P22T-E | Human | Esophagus | ESCC | 1.83e-33 | 6.29e-01 | 0.1236 |
| 54529 | ASNSD1 | P23T-E | Human | Esophagus | ESCC | 7.78e-61 | 1.50e+00 | 0.108 |
| 54529 | ASNSD1 | P24T-E | Human | Esophagus | ESCC | 1.19e-13 | 3.30e-01 | 0.1287 |
| 54529 | ASNSD1 | P26T-E | Human | Esophagus | ESCC | 3.18e-17 | 3.93e-01 | 0.1276 |
| 54529 | ASNSD1 | P27T-E | Human | Esophagus | ESCC | 1.11e-16 | 2.79e-01 | 0.1055 |
| 54529 | ASNSD1 | P28T-E | Human | Esophagus | ESCC | 8.73e-16 | 3.67e-01 | 0.1149 |
| Page: 1 2 3 4 5 6 |
| Tissue | Expression Dynamics | Abbreviation |
| Esophagus | 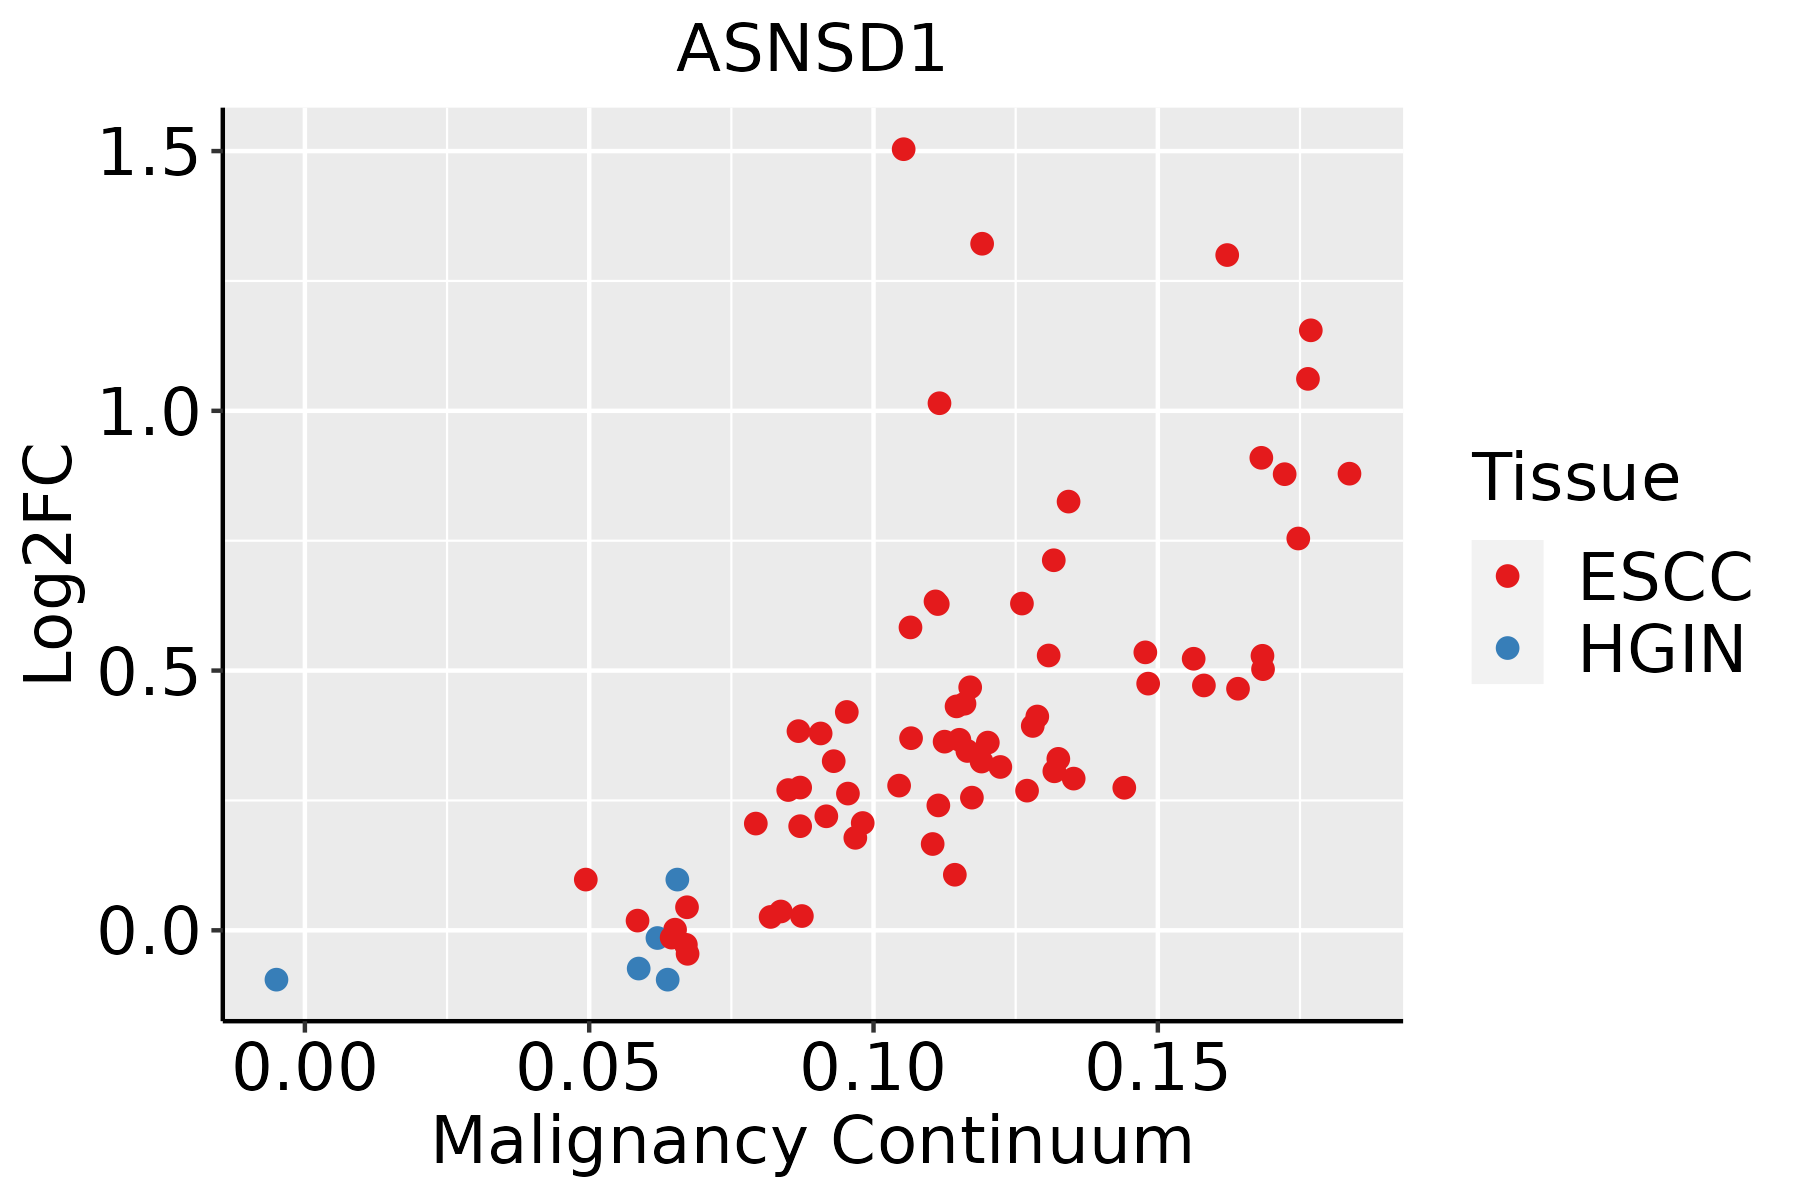 | ESCC: Esophageal squamous cell carcinoma |
| HGIN: High-grade intraepithelial neoplasias | ||
| LGIN: Low-grade intraepithelial neoplasias | ||
| Liver | 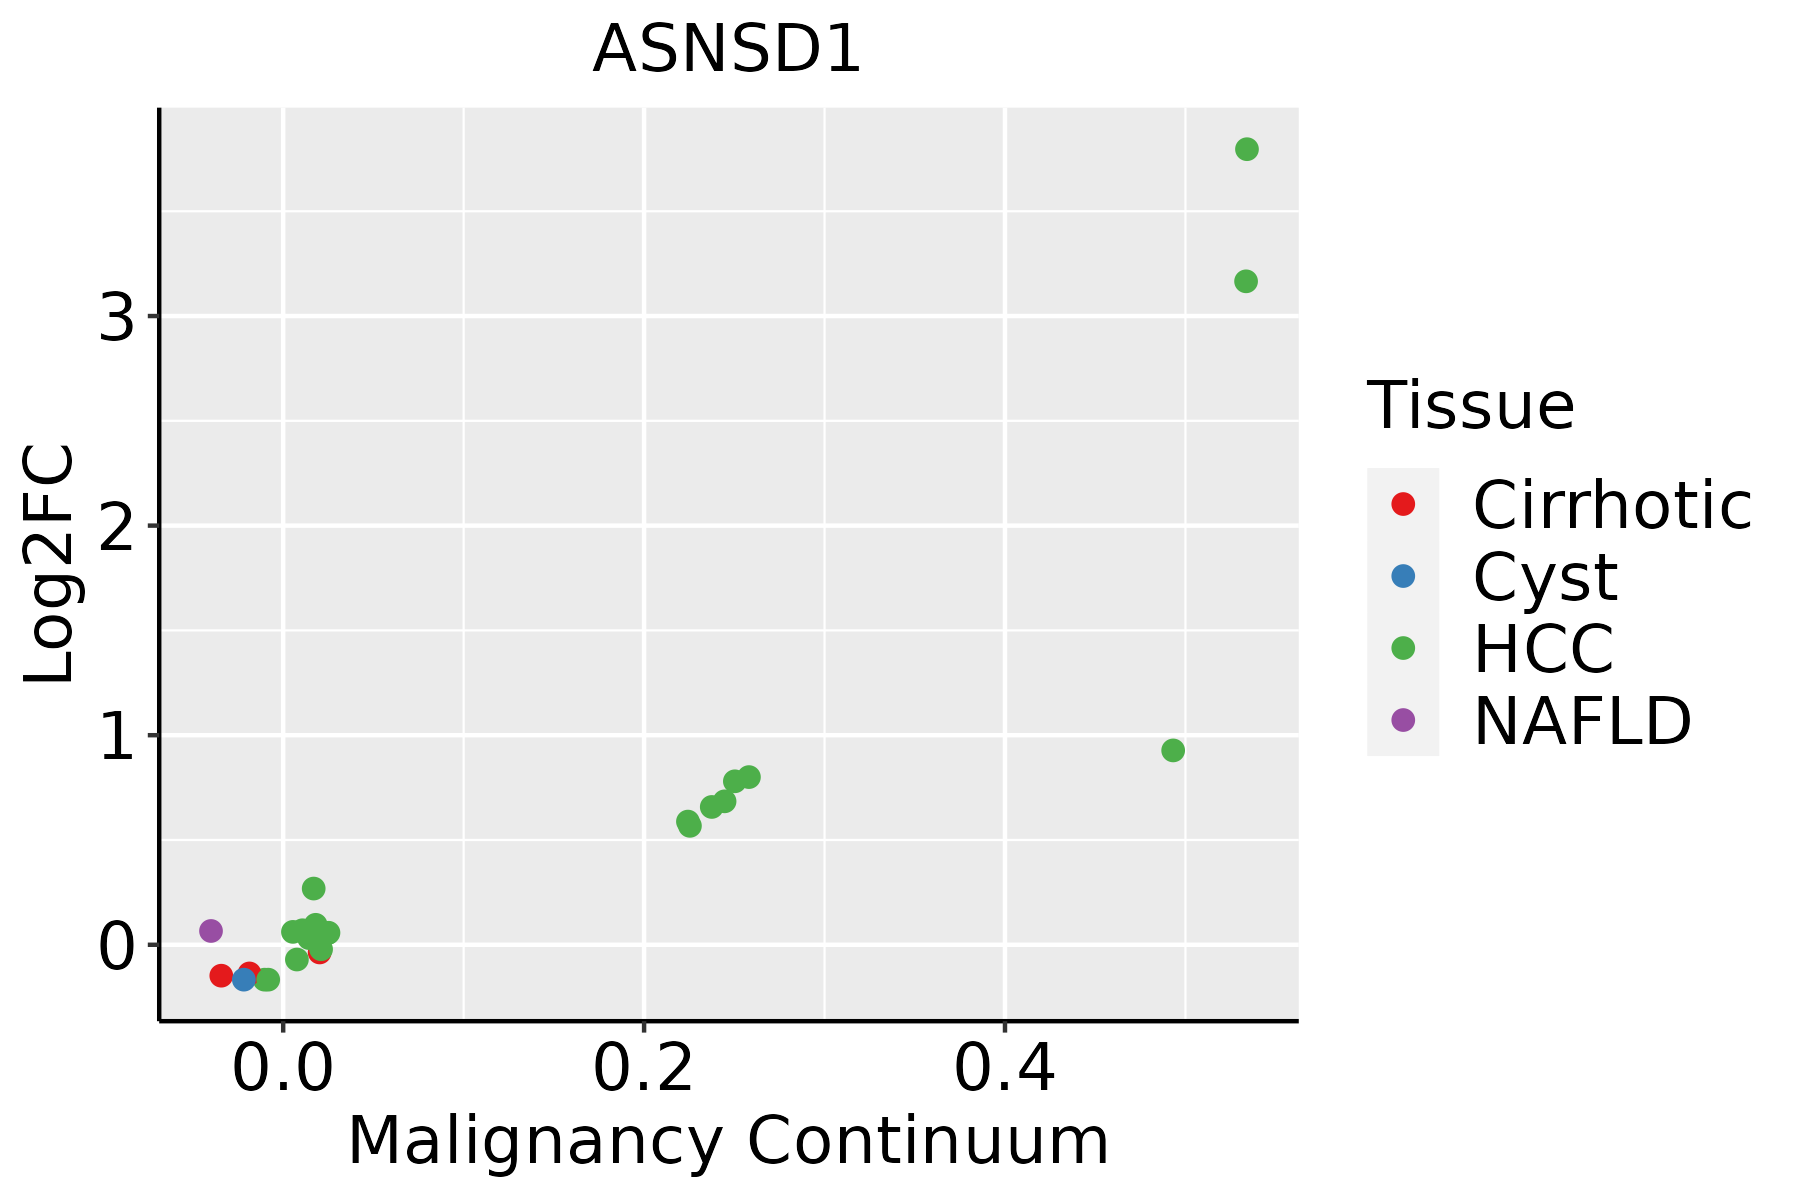 | HCC: Hepatocellular carcinoma |
| NAFLD: Non-alcoholic fatty liver disease | ||
| Oral Cavity |  | EOLP: Erosive Oral lichen planus |
| LP: leukoplakia | ||
| NEOLP: Non-erosive oral lichen planus | ||
| OSCC: Oral squamous cell carcinoma | ||
| Skin |  | AK: Actinic keratosis |
| cSCC: Cutaneous squamous cell carcinoma | ||
| SCCIS:squamous cell carcinoma in situ | ||
| Thyroid |  | ATC: Anaplastic thyroid cancer |
| HT: Hashimoto's thyroiditis | ||
| PTC: Papillary thyroid cancer |
| ∗log2FC in expression of this searched gene in stem-like cells from each diseased tissue sample relative to stem-like cells in normal samples in each tissue plotted against the malignancy continuum. Samples are colored based on if they are from different disease stage. |
Top |
Malignant transformation related pathway analysis |
| Find out the enriched GO biological processes and KEGG pathways involved in transition from healthy to precancer to cancer |
| Tissue | Disease Stage | Enriched GO biological Processes |
| Colorectum | AD |  |
| Colorectum | SER |  |
| Colorectum | MSS |  |
| Colorectum | MSI-H |  |
| Colorectum | FAP |  |
| ∗Top 15 enriched GO BP terms are showed in the bar plot of each disease state in each tissue. Each row represents a significant GO biological process which is colored according to the -log10(p.adjust). |
| Page: 1 2 3 4 5 6 7 8 9 |
| GO ID | Tissue | Disease Stage | Description | Gene Ratio | Bg Ratio | pvalue | p.adjust | Count |
| GO:00090673 | Oral cavity | LP | aspartate family amino acid biosynthetic process | 11/4623 | 21/18723 | 5.78e-03 | 3.44e-02 | 11 |
| GO:19016076 | Skin | cSCC | alpha-amino acid biosynthetic process | 30/4864 | 68/18723 | 8.91e-04 | 6.10e-03 | 30 |
| GO:00090675 | Skin | cSCC | aspartate family amino acid biosynthetic process | 12/4864 | 21/18723 | 2.40e-03 | 1.38e-02 | 12 |
| GO:00086526 | Skin | cSCC | cellular amino acid biosynthetic process | 30/4864 | 76/18723 | 6.79e-03 | 3.29e-02 | 30 |
| GO:00090676 | Thyroid | PTC | aspartate family amino acid biosynthetic process | 15/5968 | 21/18723 | 2.31e-04 | 1.67e-03 | 15 |
| GO:19016077 | Thyroid | PTC | alpha-amino acid biosynthetic process | 33/5968 | 68/18723 | 3.04e-03 | 1.50e-02 | 33 |
| GO:00086527 | Thyroid | PTC | cellular amino acid biosynthetic process | 35/5968 | 76/18723 | 6.68e-03 | 2.89e-02 | 35 |
| GO:000906711 | Thyroid | ATC | aspartate family amino acid biosynthetic process | 15/6293 | 21/18723 | 4.45e-04 | 2.64e-03 | 15 |
| GO:000865212 | Thyroid | ATC | cellular amino acid biosynthetic process | 39/6293 | 76/18723 | 1.07e-03 | 5.63e-03 | 39 |
| GO:190160712 | Thyroid | ATC | alpha-amino acid biosynthetic process | 35/6293 | 68/18723 | 1.76e-03 | 8.71e-03 | 35 |
| Page: 1 2 |
| Pathway ID | Tissue | Disease Stage | Description | Gene Ratio | Bg Ratio | pvalue | p.adjust | qvalue | Count |
| Page: 1 |
Top |
Cell-cell communication analysis |
| Identification of potential cell-cell interactions between two cell types and their ligand-receptor pairs for different disease states |
| Ligand | Receptor | LRpair | Pathway | Tissue | Disease Stage |
| Page: 1 |
Top |
Single-cell gene regulatory network inference analysis |
| Find out the significant the regulons (TFs) and the target genes of each regulon across cell types for different disease states |
| TF | Cell Type | Tissue | Disease Stage | Target Gene | RSS | Regulon Activity |
| ∗The dot plots of a searched regulon are shown for all cell subpopulations in each disease state of each tissue based on the regulon specific score inferred using pySCENIC and by calculating the average expression. |
| Page: 1 |
Top |
Somatic mutation of malignant transformation related genes |
| Annotation of somatic variants for genes involved in malignant transformation |
| Hugo Symbol | Variant Class | Variant Classification | dbSNP RS | HGVSc | HGVSp | HGVSp Short | SWISSPROT | BIOTYPE | SIFT | PolyPhen | Tumor Sample Barcode | Tissue | Histology | Sex | Age | Stage | Therapy Types | Drugs | Outcome |
| ASNSD1 | SNV | Missense_Mutation | c.1792C>G | p.Leu598Val | p.L598V | Q9NWL6 | protein_coding | tolerated(0.89) | benign(0.017) | TCGA-A2-A04W-01 | Breast | breast invasive carcinoma | Female | <65 | I/II | Chemotherapy | cytoxan | SD | |
| ASNSD1 | SNV | Missense_Mutation | rs753403228 | c.1526N>A | p.Arg509His | p.R509H | Q9NWL6 | protein_coding | tolerated(0.11) | benign(0.036) | TCGA-AN-A046-01 | Breast | breast invasive carcinoma | Female | >=65 | I/II | Unknown | Unknown | SD |
| ASNSD1 | SNV | Missense_Mutation | novel | c.1826N>T | p.Arg609Ile | p.R609I | Q9NWL6 | protein_coding | deleterious(0) | probably_damaging(0.94) | TCGA-AN-A046-01 | Breast | breast invasive carcinoma | Female | >=65 | I/II | Unknown | Unknown | SD |
| ASNSD1 | SNV | Missense_Mutation | c.52G>C | p.Asp18His | p.D18H | Q9NWL6 | protein_coding | tolerated(0.12) | benign(0.023) | TCGA-AO-A1KR-01 | Breast | breast invasive carcinoma | Female | <65 | I/II | Chemotherapy | cyclophosphamide | SD | |
| ASNSD1 | SNV | Missense_Mutation | c.451N>T | p.Gly151Cys | p.G151C | Q9NWL6 | protein_coding | deleterious(0.02) | possibly_damaging(0.52) | TCGA-GM-A2DB-01 | Breast | breast invasive carcinoma | Female | <65 | I/II | Chemotherapy | taxol | CR | |
| ASNSD1 | SNV | Missense_Mutation | rs777711639 | c.1520G>A | p.Arg507His | p.R507H | Q9NWL6 | protein_coding | deleterious(0) | probably_damaging(0.987) | TCGA-2W-A8YY-01 | Cervix | cervical & endocervical cancer | Female | <65 | I/II | Chemotherapy | cisplatin | CR |
| ASNSD1 | SNV | Missense_Mutation | c.109N>G | p.Gln37Glu | p.Q37E | Q9NWL6 | protein_coding | tolerated(0.12) | benign(0.007) | TCGA-DS-A1OC-01 | Cervix | cervical & endocervical cancer | Female | <65 | I/II | Chemotherapy | gemcitabine | SD | |
| ASNSD1 | SNV | Missense_Mutation | c.168N>T | p.Leu56Phe | p.L56F | Q9NWL6 | protein_coding | tolerated(0.06) | benign(0.066) | TCGA-LP-A7HU-01 | Cervix | cervical & endocervical cancer | Female | <65 | I/II | Unknown | Unknown | SD | |
| ASNSD1 | SNV | Missense_Mutation | rs781735004 | c.889N>T | p.Arg297Cys | p.R297C | Q9NWL6 | protein_coding | deleterious(0) | probably_damaging(1) | TCGA-MA-AA42-01 | Cervix | cervical & endocervical cancer | Female | >=65 | I/II | Unknown | Unknown | SD |
| ASNSD1 | SNV | Missense_Mutation | rs144391161 | c.1217G>A | p.Arg406Gln | p.R406Q | Q9NWL6 | protein_coding | deleterious(0) | probably_damaging(1) | TCGA-AA-3510-01 | Colorectum | colon adenocarcinoma | Male | >=65 | I/II | Unknown | Unknown | SD |
| Page: 1 2 3 4 5 6 |
Top |
Related drugs of malignant transformation related genes |
| Identification of chemicals and drugs interact with genes involved in malignant transfromation |
| (DGIdb 4.0) |
| Entrez ID | Symbol | Category | Interaction Types | Drug Claim Name | Drug Name | PMIDs |
| Page: 1 |

Copyright 2023-Present -The University of Texas Health Science Center at Houston |