
|
|||||
|
 | |
| |
| |
| |
| |
| |
|
Gene: ARHGAP1 |
Gene summary for ARHGAP1 |
| Gene information | Species | Human | Gene symbol | ARHGAP1 | Gene ID | 392 |
| Gene name | Rho GTPase activating protein 1 | |
| Gene Alias | CDC42GAP | |
| Cytomap | 11p11.2 | |
| Gene Type | protein-coding | GO ID | GO:0000041 | UniProtAcc | Q07960 |
Top |
Malignant transformation analysis |
| Identification of the aberrant gene expression in precancerous and cancerous lesions by comparing the gene expression of stem-like cells in diseased tissues with normal stem cells |
| Entrez ID | Symbol | Replicates | Species | Organ | Tissue | Adj P-value | Log2FC | Malignancy |
| 392 | ARHGAP1 | HTA11_3410_2000001011 | Human | Colorectum | AD | 2.91e-05 | 2.18e-01 | 0.0155 |
| 392 | ARHGAP1 | HTA11_2487_2000001011 | Human | Colorectum | SER | 1.96e-09 | 5.33e-01 | -0.1808 |
| 392 | ARHGAP1 | HTA11_1938_2000001011 | Human | Colorectum | AD | 3.17e-11 | 5.57e-01 | -0.0811 |
| 392 | ARHGAP1 | HTA11_78_2000001011 | Human | Colorectum | AD | 7.96e-09 | 5.32e-01 | -0.1088 |
| 392 | ARHGAP1 | HTA11_347_2000001011 | Human | Colorectum | AD | 1.43e-26 | 6.78e-01 | -0.1954 |
| 392 | ARHGAP1 | HTA11_411_2000001011 | Human | Colorectum | SER | 1.25e-10 | 1.15e+00 | -0.2602 |
| 392 | ARHGAP1 | HTA11_2112_2000001011 | Human | Colorectum | SER | 6.35e-06 | 7.08e-01 | -0.2196 |
| 392 | ARHGAP1 | HTA11_3361_2000001011 | Human | Colorectum | AD | 1.50e-08 | 5.66e-01 | -0.1207 |
| 392 | ARHGAP1 | HTA11_83_2000001011 | Human | Colorectum | SER | 9.25e-07 | 5.20e-01 | -0.1526 |
| 392 | ARHGAP1 | HTA11_696_2000001011 | Human | Colorectum | AD | 7.18e-18 | 7.14e-01 | -0.1464 |
| 392 | ARHGAP1 | HTA11_866_2000001011 | Human | Colorectum | AD | 2.47e-13 | 5.40e-01 | -0.1001 |
| 392 | ARHGAP1 | HTA11_1391_2000001011 | Human | Colorectum | AD | 1.91e-19 | 6.82e-01 | -0.059 |
| 392 | ARHGAP1 | HTA11_2992_2000001011 | Human | Colorectum | SER | 4.18e-02 | 5.35e-01 | -0.1706 |
| 392 | ARHGAP1 | HTA11_546_2000001011 | Human | Colorectum | AD | 1.65e-06 | 5.45e-01 | -0.0842 |
| 392 | ARHGAP1 | HTA11_866_3004761011 | Human | Colorectum | AD | 2.87e-04 | 2.54e-01 | 0.096 |
| 392 | ARHGAP1 | HTA11_4255_2000001011 | Human | Colorectum | SER | 3.13e-02 | 4.16e-01 | 0.0446 |
| 392 | ARHGAP1 | HTA11_8622_2000001021 | Human | Colorectum | SER | 5.00e-03 | 5.19e-01 | 0.0528 |
| 392 | ARHGAP1 | HTA11_7663_2000001011 | Human | Colorectum | SER | 6.40e-03 | 4.13e-01 | 0.0131 |
| 392 | ARHGAP1 | HTA11_10623_2000001011 | Human | Colorectum | AD | 2.10e-02 | 3.49e-01 | -0.0177 |
| 392 | ARHGAP1 | HTA11_6801_2000001011 | Human | Colorectum | SER | 1.31e-03 | 5.23e-01 | 0.0171 |
| Page: 1 2 3 4 5 6 7 8 |
| Tissue | Expression Dynamics | Abbreviation |
| Colorectum (GSE201348) |  | FAP: Familial adenomatous polyposis |
| CRC: Colorectal cancer | ||
| Colorectum (HTA11) | 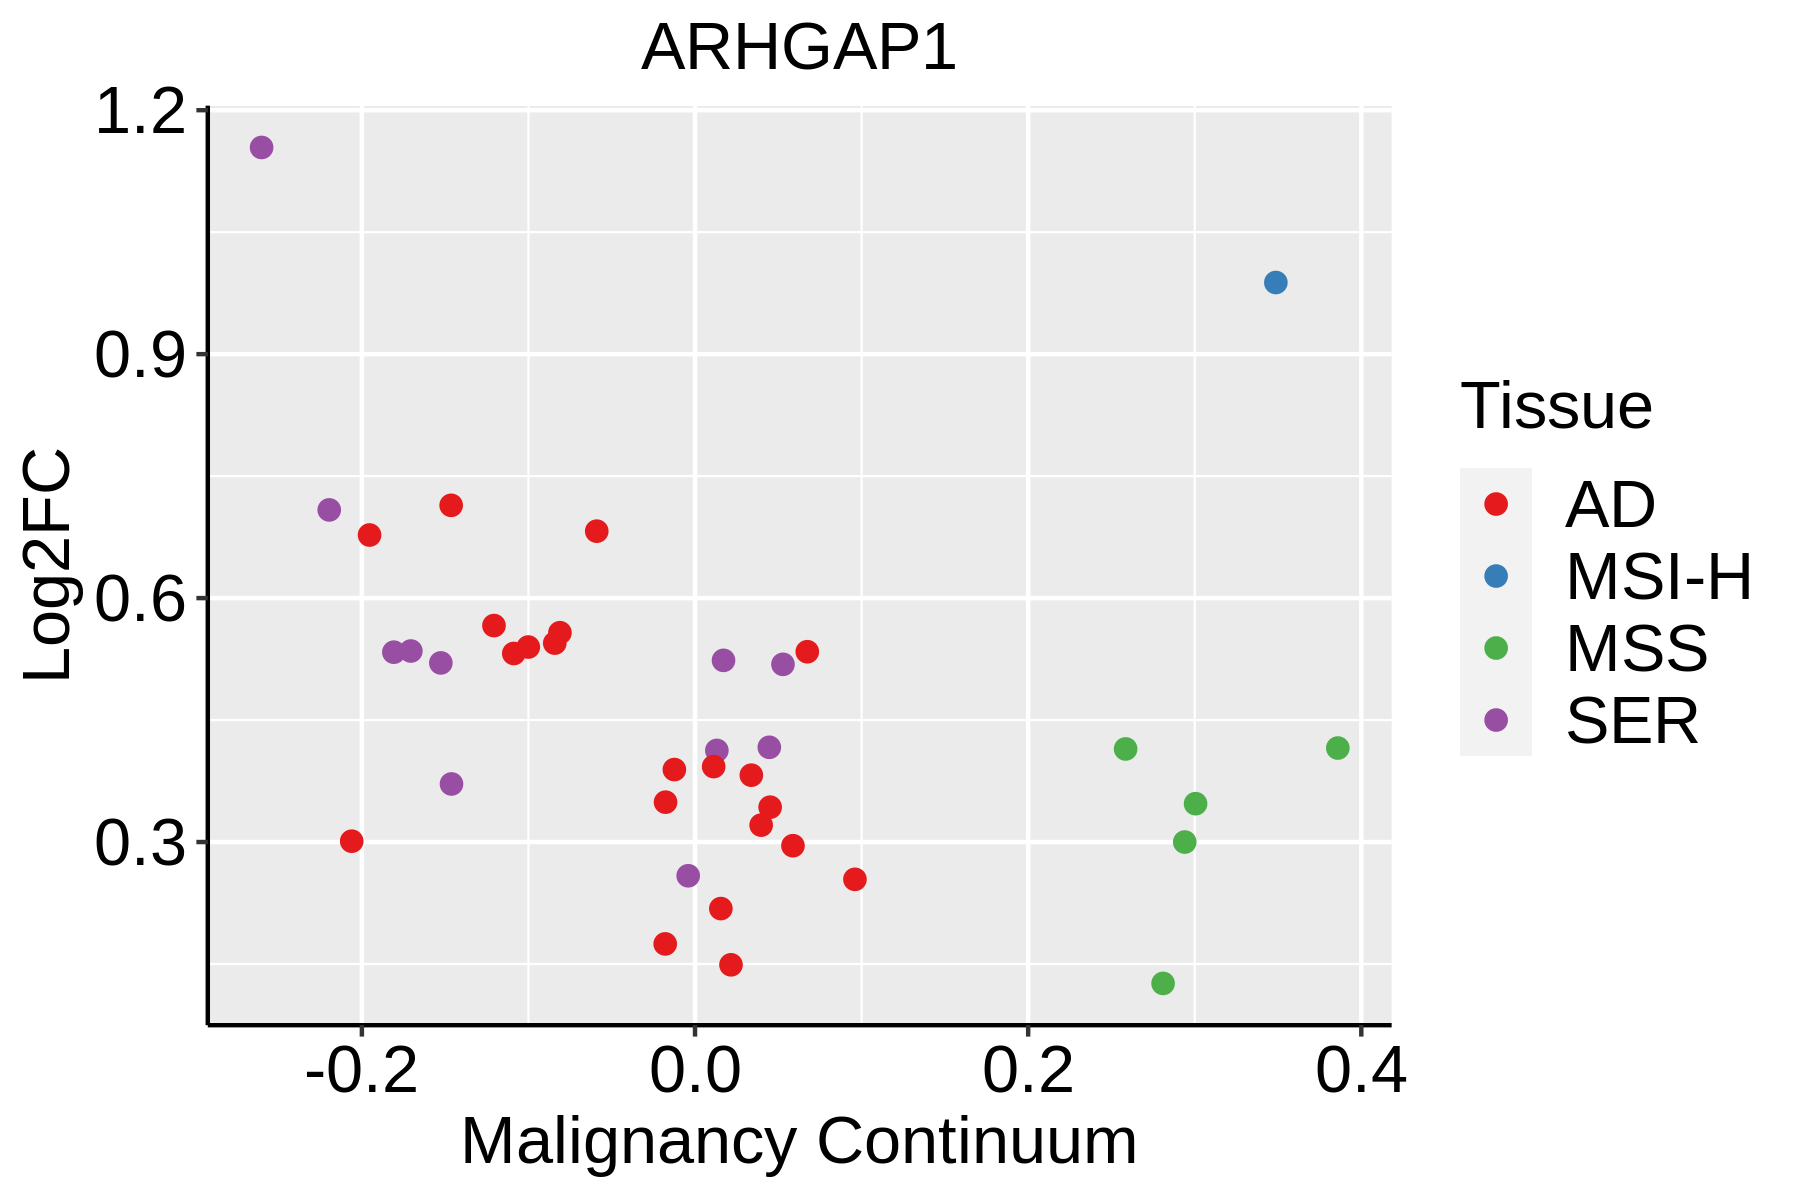 | AD: Adenomas |
| SER: Sessile serrated lesions | ||
| MSI-H: Microsatellite-high colorectal cancer | ||
| MSS: Microsatellite stable colorectal cancer | ||
| Esophagus | 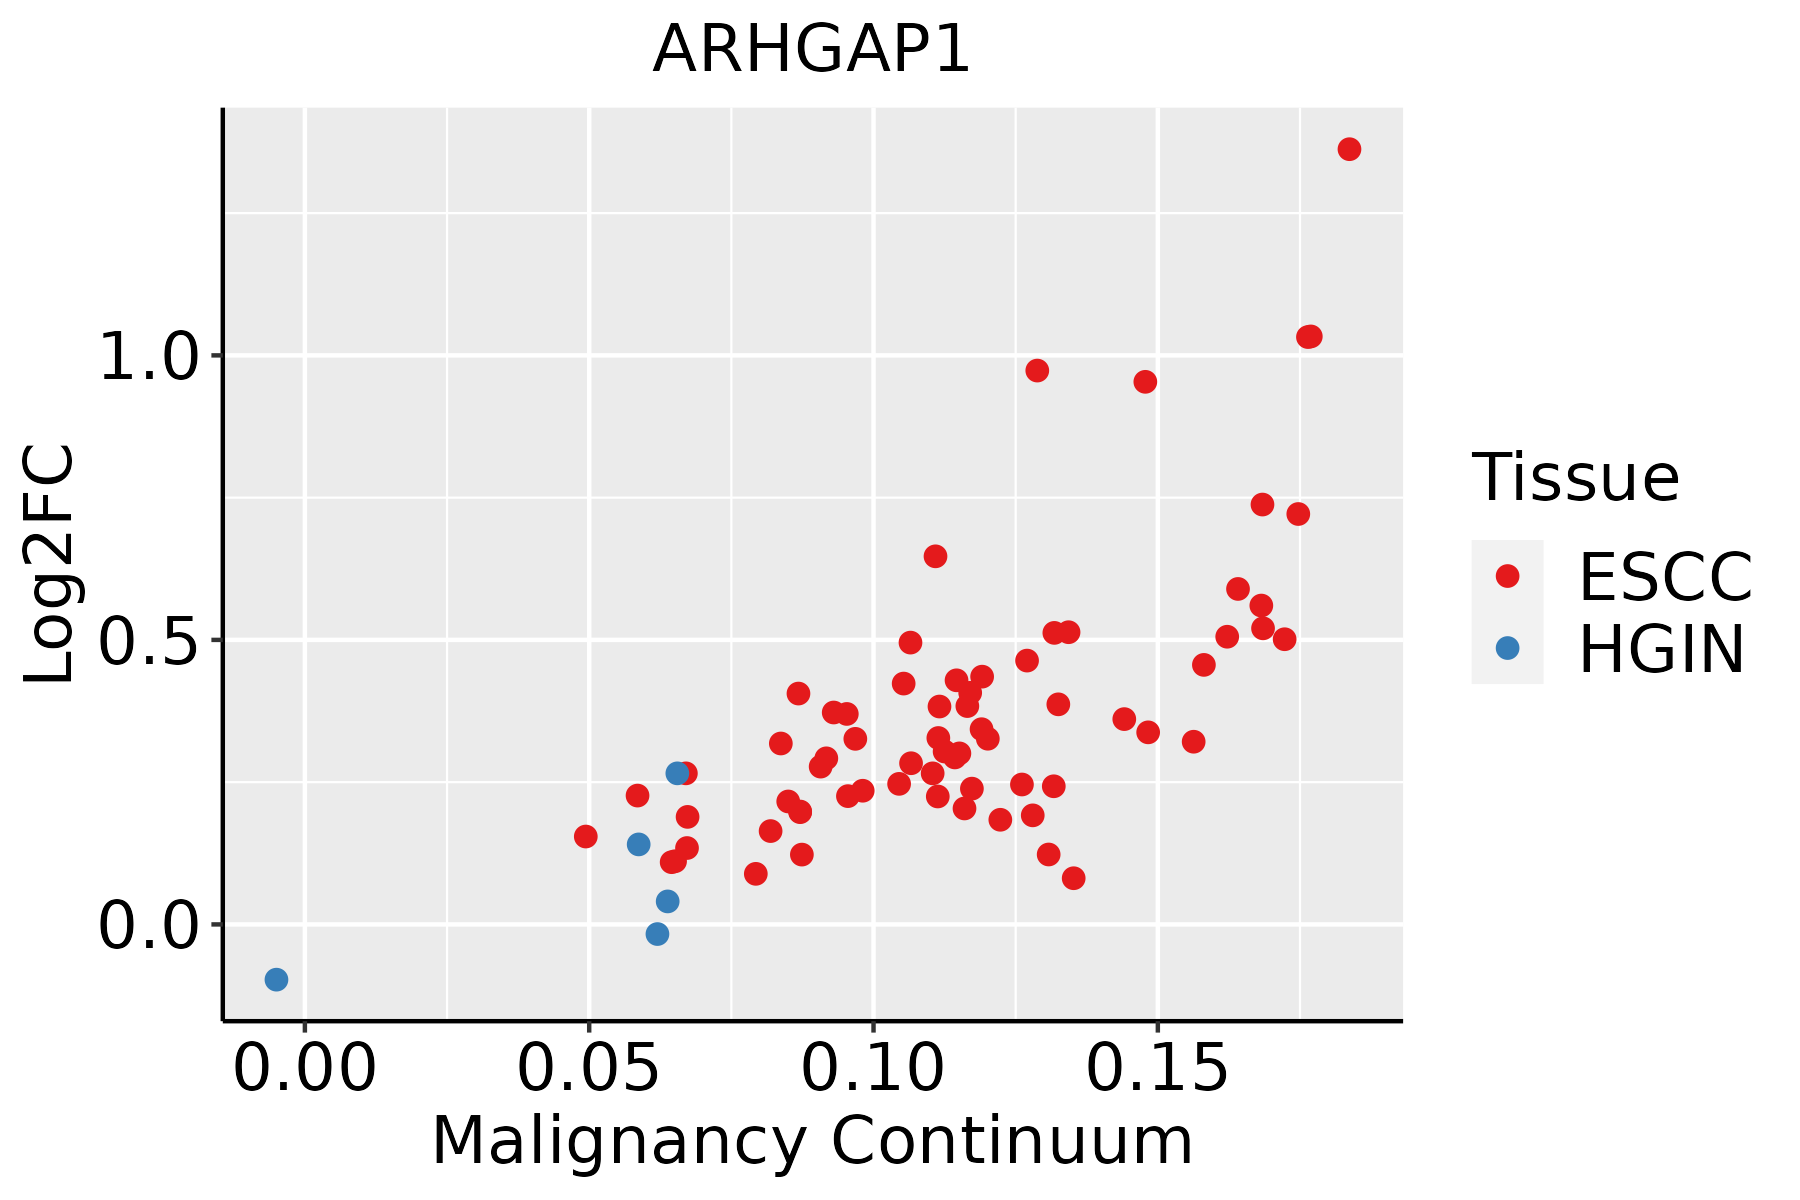 | ESCC: Esophageal squamous cell carcinoma |
| HGIN: High-grade intraepithelial neoplasias | ||
| LGIN: Low-grade intraepithelial neoplasias | ||
| Liver | 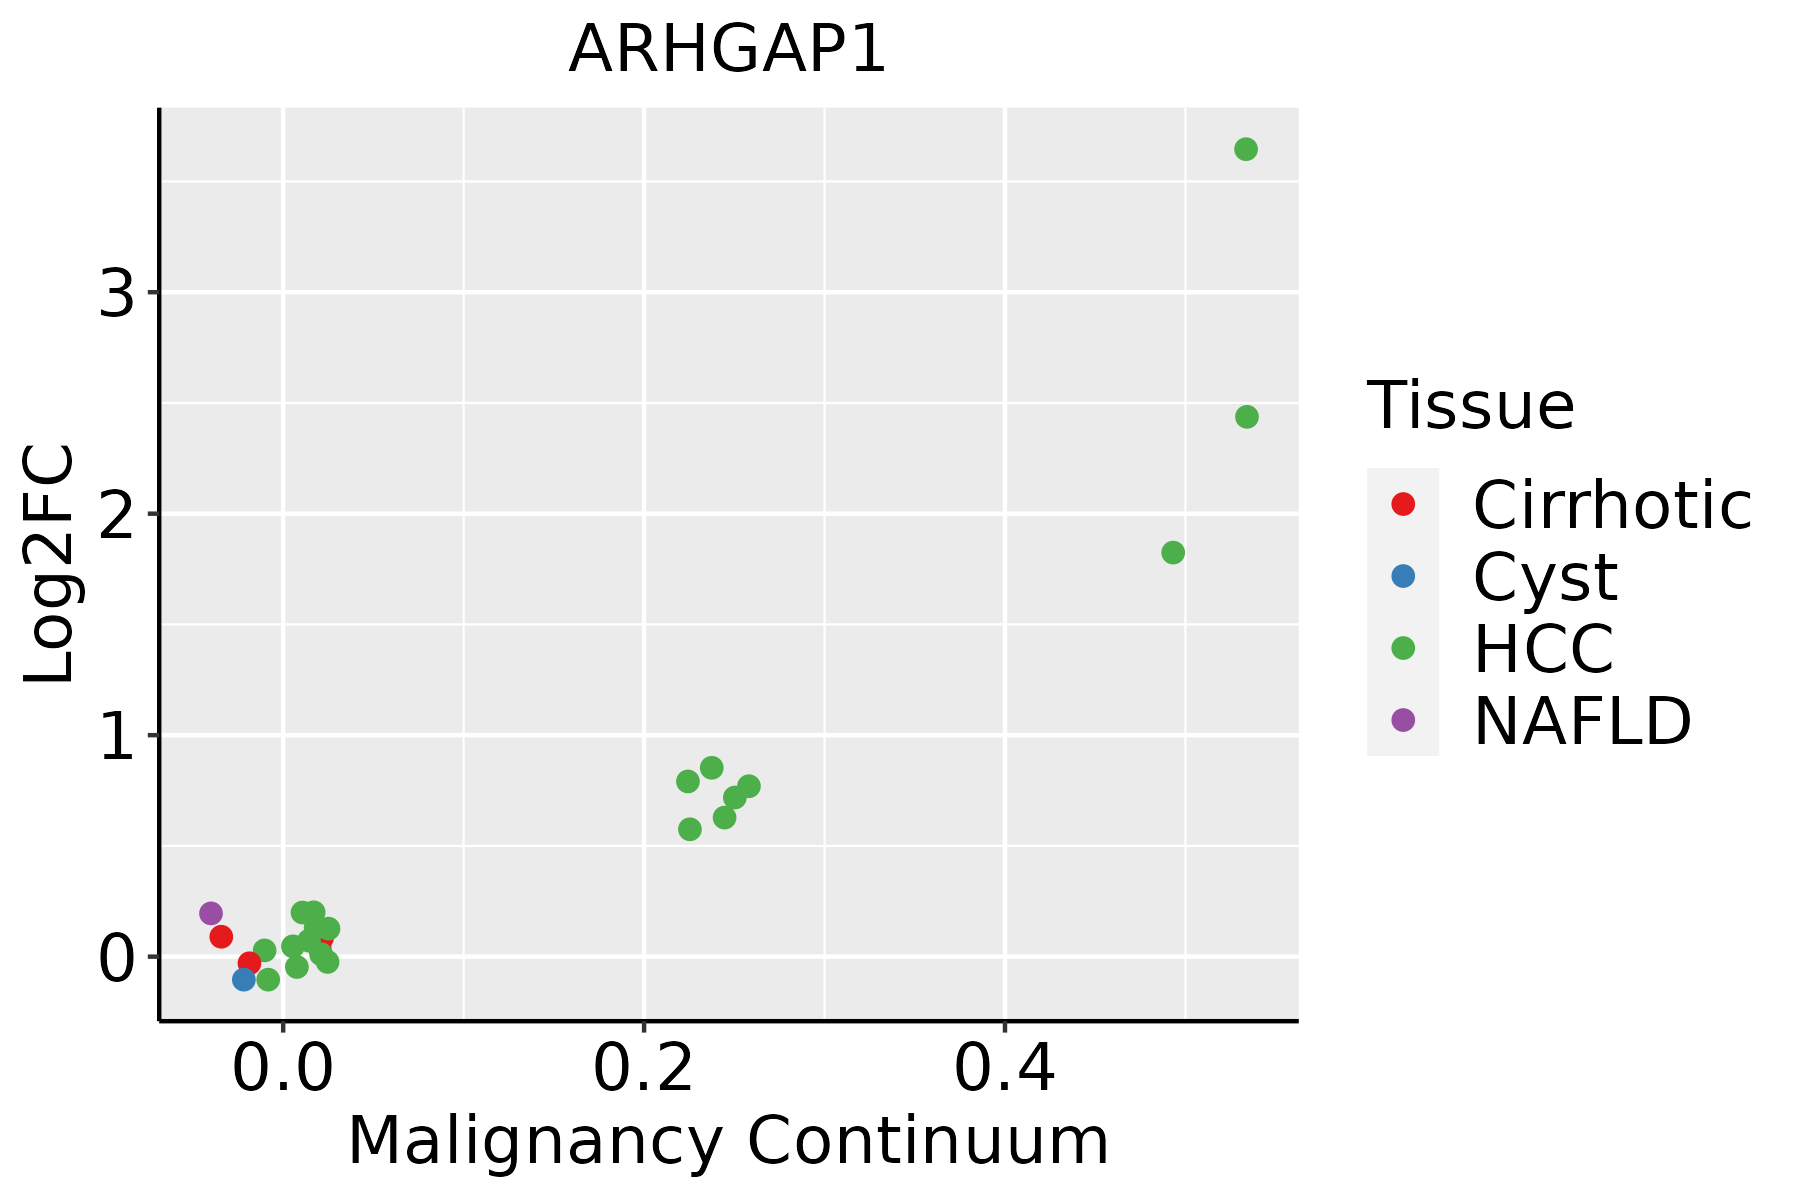 | HCC: Hepatocellular carcinoma |
| NAFLD: Non-alcoholic fatty liver disease | ||
| Oral Cavity | 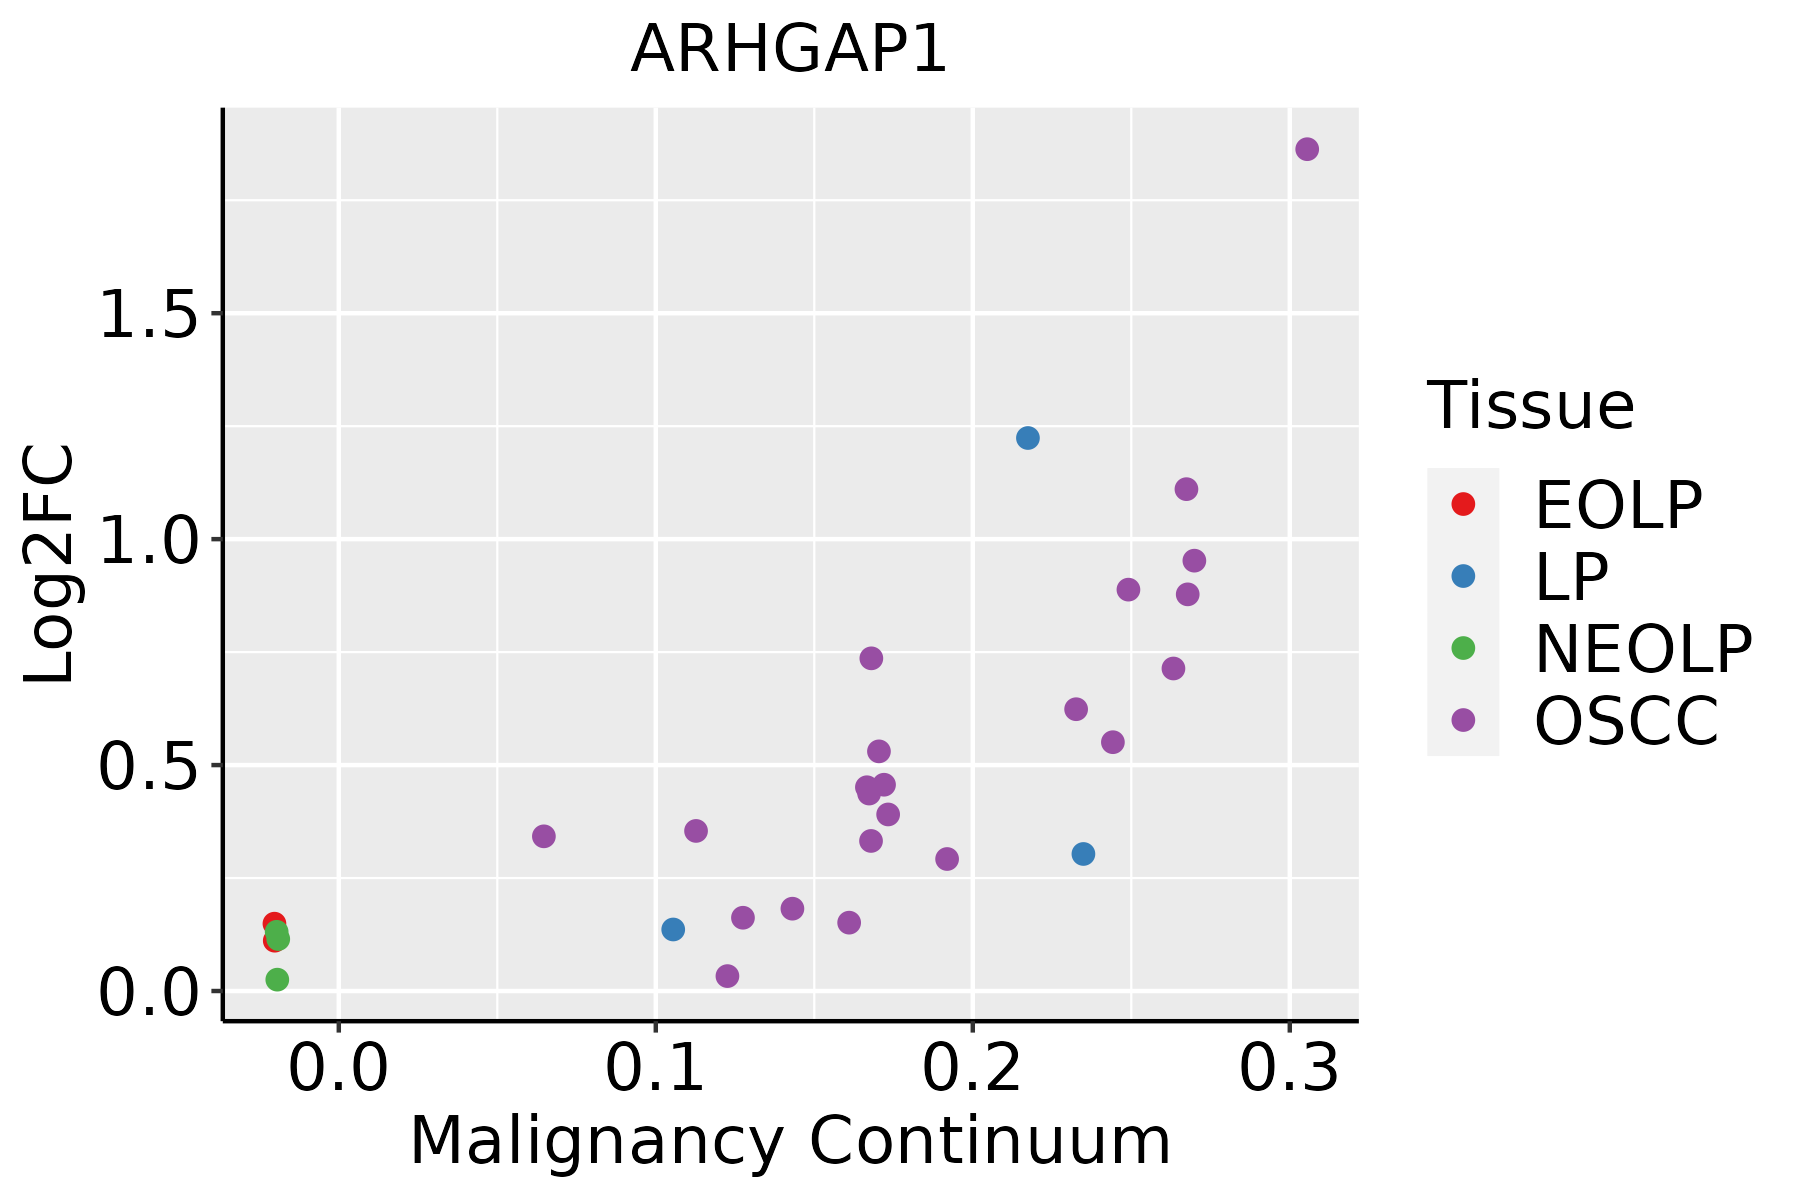 | EOLP: Erosive Oral lichen planus |
| LP: leukoplakia | ||
| NEOLP: Non-erosive oral lichen planus | ||
| OSCC: Oral squamous cell carcinoma | ||
| Skin | 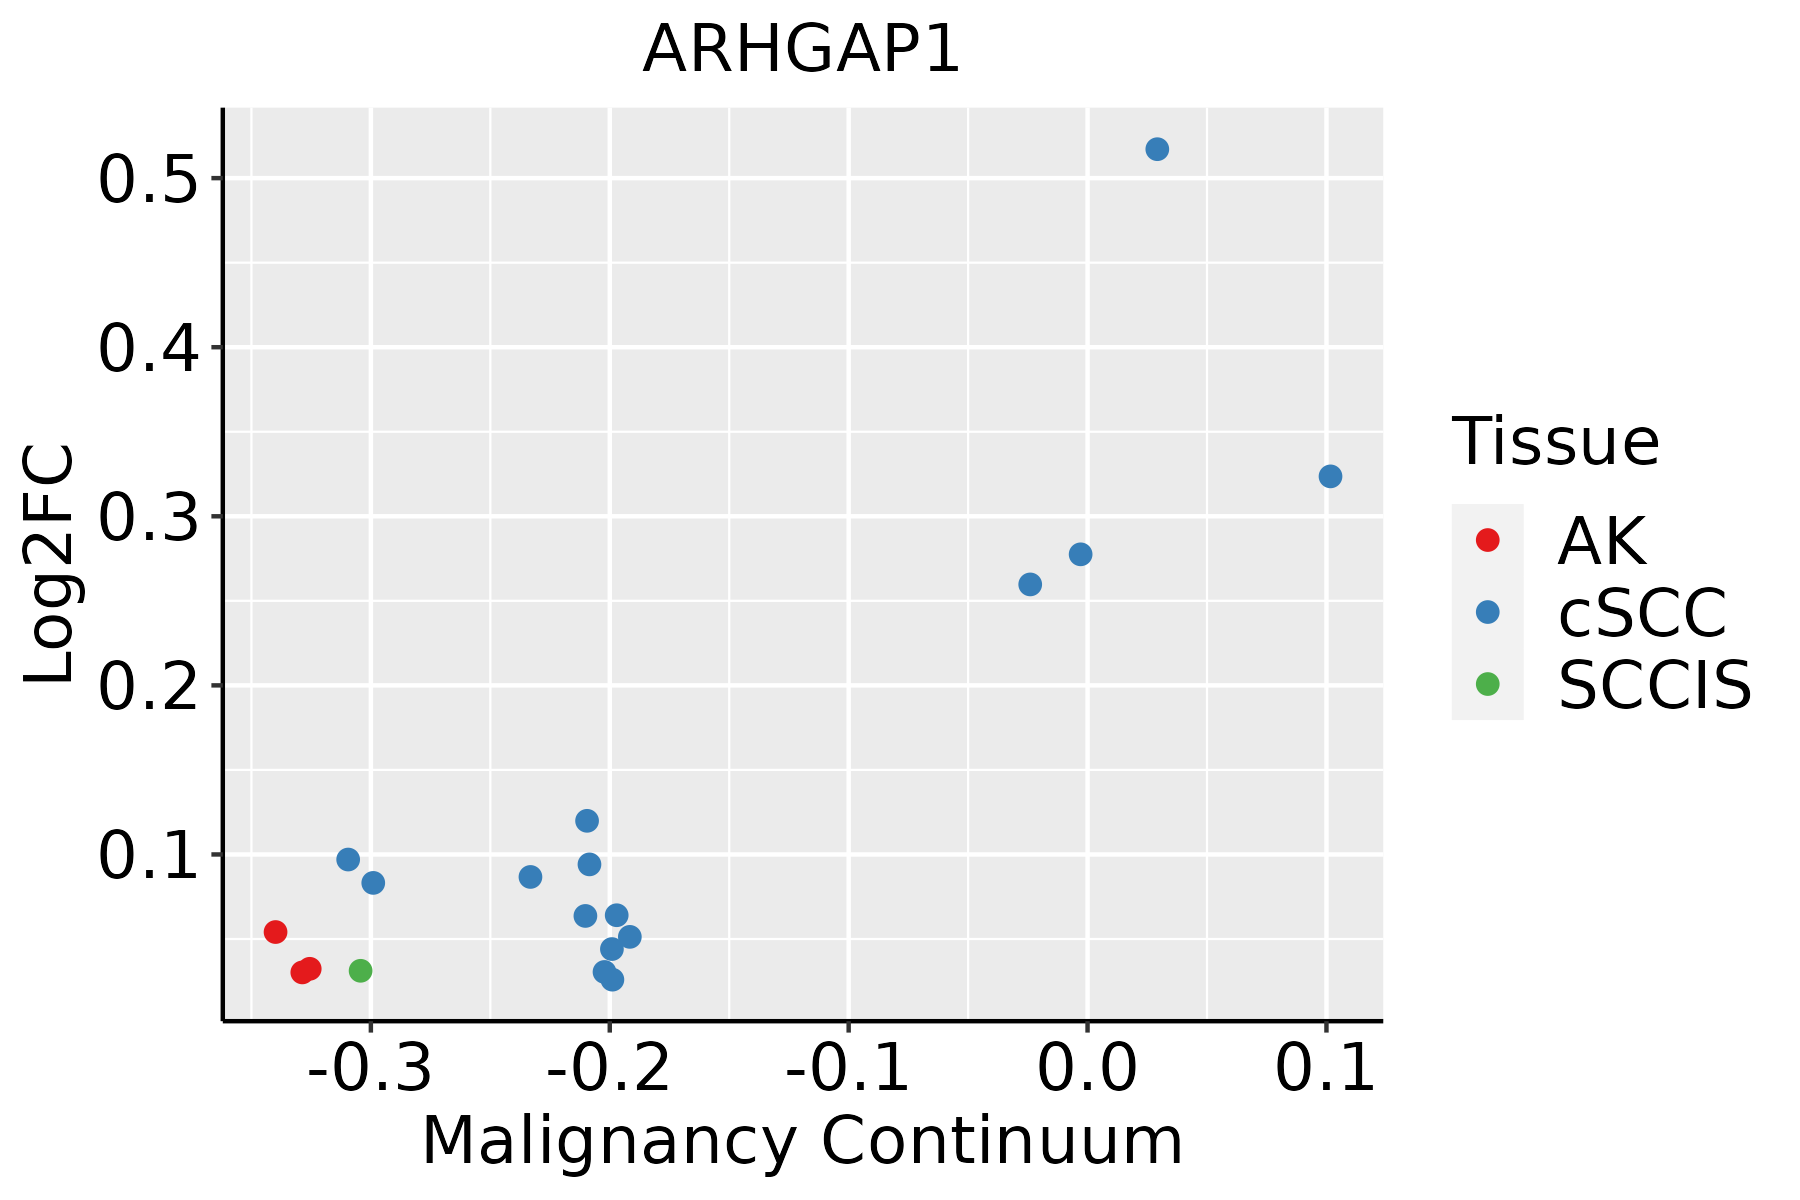 | AK: Actinic keratosis |
| cSCC: Cutaneous squamous cell carcinoma | ||
| SCCIS:squamous cell carcinoma in situ | ||
| Thyroid | 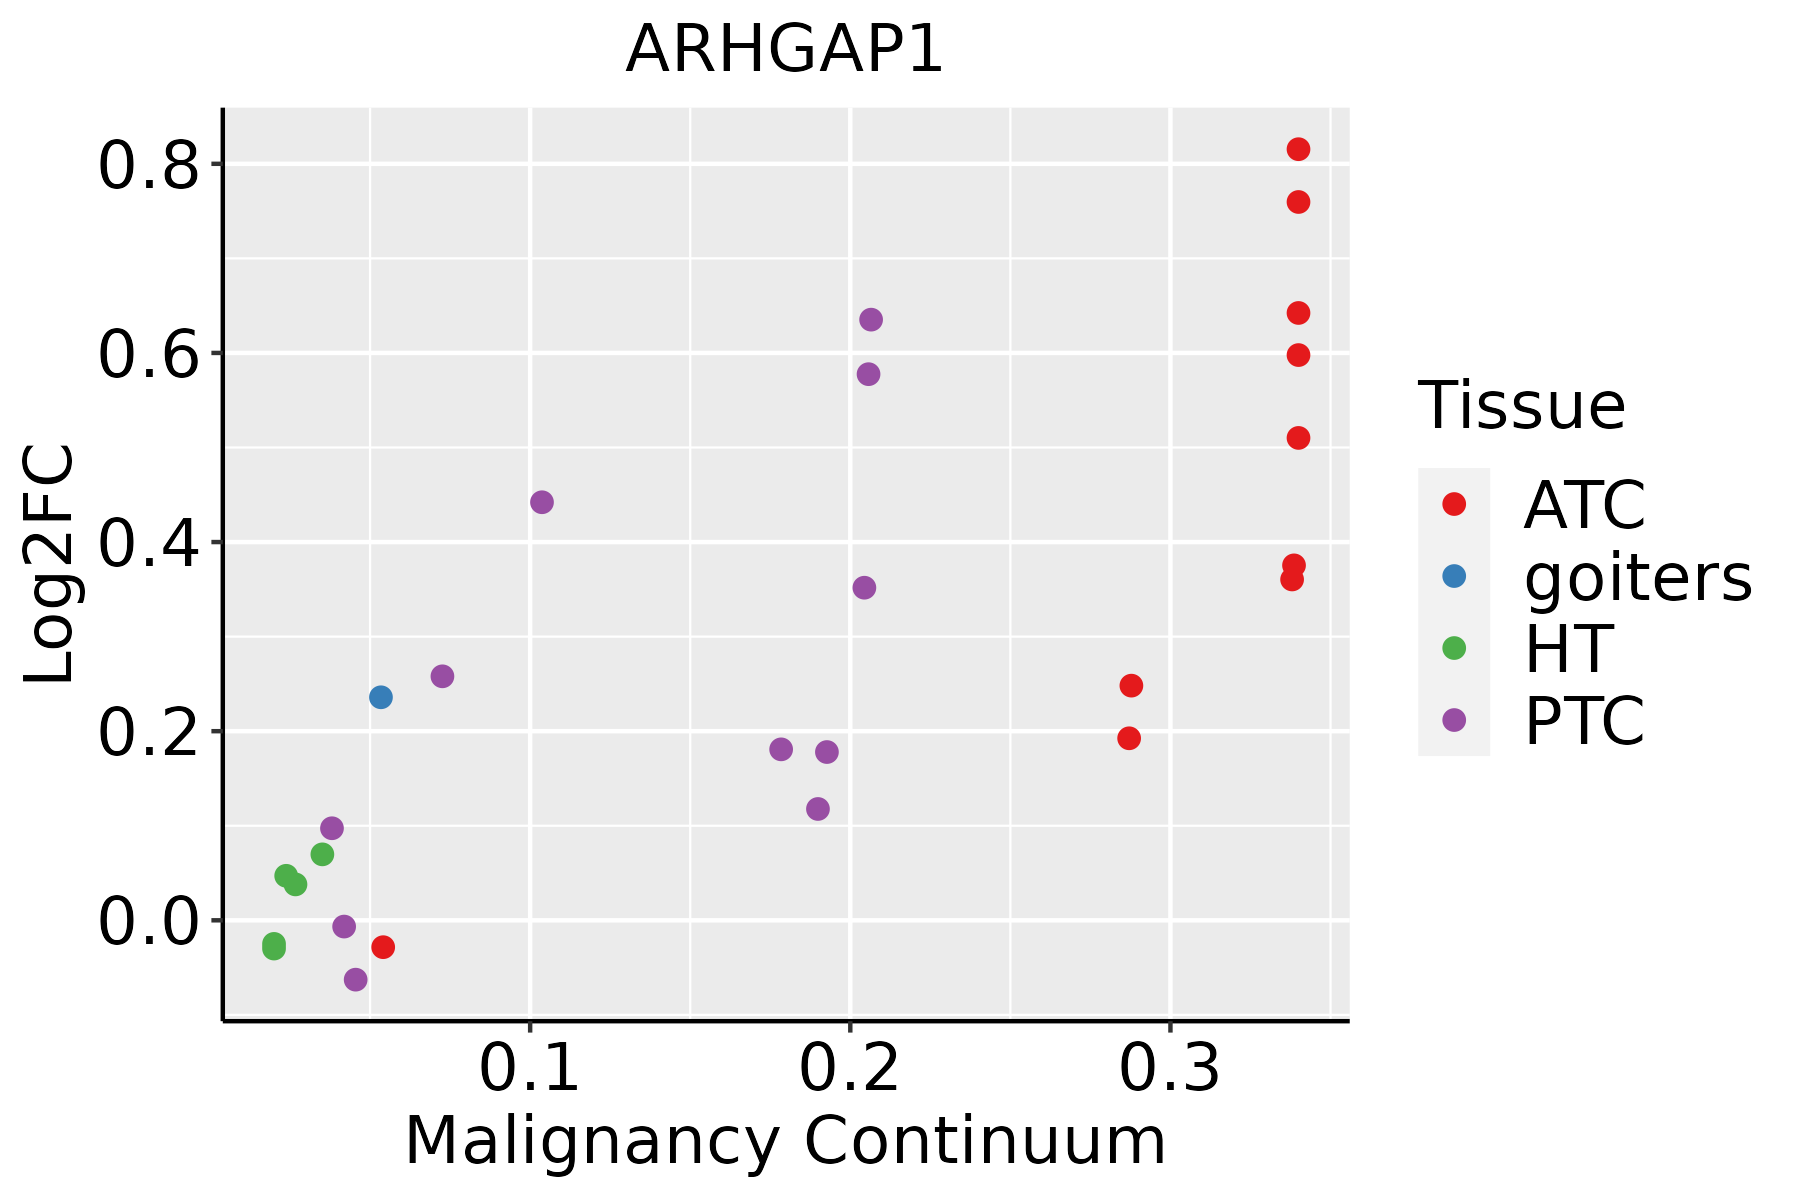 | ATC: Anaplastic thyroid cancer |
| HT: Hashimoto's thyroiditis | ||
| PTC: Papillary thyroid cancer |
| ∗log2FC in expression of this searched gene in stem-like cells from each diseased tissue sample relative to stem-like cells in normal samples in each tissue plotted against the malignancy continuum. Samples are colored based on if they are from different disease stage. |
Top |
Malignant transformation related pathway analysis |
| Find out the enriched GO biological processes and KEGG pathways involved in transition from healthy to precancer to cancer |
| Tissue | Disease Stage | Enriched GO biological Processes |
| Colorectum | AD |  |
| Colorectum | SER |  |
| Colorectum | MSS |  |
| Colorectum | MSI-H |  |
| Colorectum | FAP |  |
| ∗Top 15 enriched GO BP terms are showed in the bar plot of each disease state in each tissue. Each row represents a significant GO biological process which is colored according to the -log10(p.adjust). |
| Page: 1 2 3 4 5 6 7 8 9 |
| GO ID | Tissue | Disease Stage | Description | Gene Ratio | Bg Ratio | pvalue | p.adjust | Count |
| GO:190290315 | Cervix | HSIL_HPV | regulation of supramolecular fiber organization | 34/737 | 383/18723 | 9.14e-06 | 3.19e-04 | 34 |
| GO:004325415 | Cervix | HSIL_HPV | regulation of protein-containing complex assembly | 34/737 | 428/18723 | 8.79e-05 | 1.92e-03 | 34 |
| GO:002260414 | Cervix | HSIL_HPV | regulation of cell morphogenesis | 25/737 | 309/18723 | 5.58e-04 | 7.93e-03 | 25 |
| GO:011005315 | Cervix | HSIL_HPV | regulation of actin filament organization | 23/737 | 278/18723 | 6.73e-04 | 9.13e-03 | 23 |
| GO:003227115 | Cervix | HSIL_HPV | regulation of protein polymerization | 20/737 | 233/18723 | 9.38e-04 | 1.18e-02 | 20 |
| GO:003083314 | Cervix | HSIL_HPV | regulation of actin filament polymerization | 16/737 | 172/18723 | 1.28e-03 | 1.48e-02 | 16 |
| GO:003004114 | Cervix | HSIL_HPV | actin filament polymerization | 17/737 | 191/18723 | 1.49e-03 | 1.65e-02 | 17 |
| GO:005125815 | Cervix | HSIL_HPV | protein polymerization | 23/737 | 297/18723 | 1.63e-03 | 1.77e-02 | 23 |
| GO:000815414 | Cervix | HSIL_HPV | actin polymerization or depolymerization | 18/737 | 218/18723 | 2.53e-03 | 2.48e-02 | 18 |
| GO:003253515 | Cervix | HSIL_HPV | regulation of cellular component size | 27/737 | 383/18723 | 2.63e-03 | 2.54e-02 | 27 |
| GO:000806413 | Cervix | HSIL_HPV | regulation of actin polymerization or depolymerization | 16/737 | 188/18723 | 3.18e-03 | 2.89e-02 | 16 |
| GO:003083213 | Cervix | HSIL_HPV | regulation of actin filament length | 16/737 | 189/18723 | 3.35e-03 | 3.03e-02 | 16 |
| GO:0007015 | Colorectum | AD | actin filament organization | 167/3918 | 442/18723 | 1.65e-16 | 7.94e-14 | 167 |
| GO:0032970 | Colorectum | AD | regulation of actin filament-based process | 142/3918 | 397/18723 | 4.05e-12 | 5.90e-10 | 142 |
| GO:0032956 | Colorectum | AD | regulation of actin cytoskeleton organization | 127/3918 | 358/18723 | 1.03e-10 | 1.04e-08 | 127 |
| GO:0016197 | Colorectum | AD | endosomal transport | 90/3918 | 230/18723 | 1.88e-10 | 1.73e-08 | 90 |
| GO:0098876 | Colorectum | AD | vesicle-mediated transport to the plasma membrane | 57/3918 | 136/18723 | 2.30e-08 | 1.27e-06 | 57 |
| GO:0032386 | Colorectum | AD | regulation of intracellular transport | 109/3918 | 337/18723 | 5.33e-07 | 1.95e-05 | 109 |
| GO:0043087 | Colorectum | AD | regulation of GTPase activity | 110/3918 | 348/18723 | 1.64e-06 | 5.03e-05 | 110 |
| GO:0007265 | Colorectum | AD | Ras protein signal transduction | 104/3918 | 337/18723 | 1.01e-05 | 2.35e-04 | 104 |
| Page: 1 2 3 4 5 6 7 8 9 10 11 12 13 14 15 |
| Pathway ID | Tissue | Disease Stage | Description | Gene Ratio | Bg Ratio | pvalue | p.adjust | qvalue | Count |
| Page: 1 |
Top |
Cell-cell communication analysis |
| Identification of potential cell-cell interactions between two cell types and their ligand-receptor pairs for different disease states |
| Ligand | Receptor | LRpair | Pathway | Tissue | Disease Stage |
| Page: 1 |
Top |
Single-cell gene regulatory network inference analysis |
| Find out the significant the regulons (TFs) and the target genes of each regulon across cell types for different disease states |
| TF | Cell Type | Tissue | Disease Stage | Target Gene | RSS | Regulon Activity |
| ∗The dot plots of a searched regulon are shown for all cell subpopulations in each disease state of each tissue based on the regulon specific score inferred using pySCENIC and by calculating the average expression. |
| Page: 1 |
Top |
Somatic mutation of malignant transformation related genes |
| Annotation of somatic variants for genes involved in malignant transformation |
| Hugo Symbol | Variant Class | Variant Classification | dbSNP RS | HGVSc | HGVSp | HGVSp Short | SWISSPROT | BIOTYPE | SIFT | PolyPhen | Tumor Sample Barcode | Tissue | Histology | Sex | Age | Stage | Therapy Types | Drugs | Outcome |
| ARHGAP1 | SNV | Missense_Mutation | c.730N>T | p.Val244Phe | p.V244F | Q07960 | protein_coding | deleterious(0) | possibly_damaging(0.713) | TCGA-AD-5900-01 | Colorectum | colon adenocarcinoma | Male | >=65 | I/II | Unknown | Unknown | SD | |
| ARHGAP1 | SNV | Missense_Mutation | rs760960194 | c.205N>T | p.Arg69Trp | p.R69W | Q07960 | protein_coding | deleterious(0.01) | benign(0.049) | TCGA-AG-3592-01 | Colorectum | rectum adenocarcinoma | Male | >=65 | I/II | Unknown | Unknown | SD |
| ARHGAP1 | deletion | Frame_Shift_Del | novel | c.178_179delNN | p.Trp60GlyfsTer2 | p.W60Gfs*2 | Q07960 | protein_coding | TCGA-AA-3821-01 | Colorectum | colon adenocarcinoma | Female | >=65 | I/II | Unknown | Unknown | SD | ||
| ARHGAP1 | SNV | Missense_Mutation | rs764362910 | c.394N>A | p.Asp132Asn | p.D132N | Q07960 | protein_coding | tolerated(0.16) | benign(0.01) | TCGA-A5-A0G2-01 | Endometrium | uterine corpus endometrioid carcinoma | Female | <65 | III/IV | Unknown | Unknown | SD |
| ARHGAP1 | SNV | Missense_Mutation | novel | c.421N>T | p.Arg141Cys | p.R141C | Q07960 | protein_coding | deleterious(0.02) | probably_damaging(0.985) | TCGA-A5-A1OF-01 | Endometrium | uterine corpus endometrioid carcinoma | Female | <65 | I/II | Unknown | Unknown | SD |
| ARHGAP1 | SNV | Missense_Mutation | novel | c.232N>T | p.Asp78Tyr | p.D78Y | Q07960 | protein_coding | deleterious(0) | probably_damaging(0.992) | TCGA-AX-A05Z-01 | Endometrium | uterine corpus endometrioid carcinoma | Female | <65 | III/IV | Chemotherapy | adriamycin | SD |
| ARHGAP1 | SNV | Missense_Mutation | novel | c.1253C>T | p.Thr418Ile | p.T418I | Q07960 | protein_coding | tolerated(0.43) | benign(0.023) | TCGA-AX-A0J1-01 | Endometrium | uterine corpus endometrioid carcinoma | Female | >=65 | I/II | Unknown | Unknown | SD |
| ARHGAP1 | SNV | Missense_Mutation | c.1222A>G | p.Ile408Val | p.I408V | Q07960 | protein_coding | tolerated(1) | benign(0.003) | TCGA-B5-A0JY-01 | Endometrium | uterine corpus endometrioid carcinoma | Female | <65 | III/IV | Chemotherapy | doxorubicin | SD | |
| ARHGAP1 | SNV | Missense_Mutation | rs754102804 | c.872N>A | p.Arg291Gln | p.R291Q | Q07960 | protein_coding | tolerated(0.07) | benign(0.173) | TCGA-D1-A167-01 | Endometrium | uterine corpus endometrioid carcinoma | Female | >=65 | I/II | Unknown | Unknown | SD |
| ARHGAP1 | SNV | Missense_Mutation | novel | c.1145N>A | p.Ser382Asn | p.S382N | Q07960 | protein_coding | deleterious(0.02) | benign(0.019) | TCGA-E6-A1LX-01 | Endometrium | uterine corpus endometrioid carcinoma | Female | <65 | I/II | Unknown | Unknown | SD |
| Page: 1 2 3 4 |
Top |
Related drugs of malignant transformation related genes |
| Identification of chemicals and drugs interact with genes involved in malignant transfromation |
| (DGIdb 4.0) |
| Entrez ID | Symbol | Category | Interaction Types | Drug Claim Name | Drug Name | PMIDs |
| Page: 1 |

Copyright 2023-Present -The University of Texas Health Science Center at Houston |