Schematic overview of the cellular and molecular mechanisms involved in the cancer progression, including the proposed cellular and molecular mechanisms in cancer cells trajectory. AT1: alveolar type 1 cells; AT2: alveolar type 2 cells; AAH: atypical adenomatous hyperplasia; AIS: adenocarcinoma in situ; MIA: minimally invasive adenocarcinoma; IA: invasive adenocarcinoma; EMT: epithelial-mesenchymal transition

Home

Download

Statistics

Help

Contact

Center for Computational Systems Medicine
leaf

Gene summary

leaf

Malignant transformation analysis

leaf

Malignant transformation related pathway analysis

leaf

Cell-cell communication analysis

leaf

Single-cell gene regulatory network inference analysis

leaf

Somatic mutation of malignant transformation related genes

leaf

Related drugs of malignant transformation related genes

Gene: AQP5

Gene summary for AQP5

check button Gene summary.

Gene informationSpeciesHuman
Gene symbol

AQP5

Gene ID

362

Gene nameaquaporin 5
Gene AliasAQP-5
Cytomap12q13.12
Gene Typeprotein-coding
GO ID

GO:0001654

UniProtAcc

P55064


Top

Malignant transformation analysis

check button Identification of the aberrant gene expression in precancerous and cancerous lesions by comparing the gene expression of stem-like cells in diseased tissues with normal stem cells
check button Malignant transformation involving gene list.
Entrez IDSymbolReplicatesSpeciesOrganTissueAdj P-valueLog2FCMalignancy
362AQP5GSM4909286HumanBreastIDC5.46e-235.25e-010.1081
362AQP5GSM4909290HumanBreastIDC1.71e-339.46e-010.2096
362AQP5GSM4909291HumanBreastIDC3.22e-03-2.12e-010.1753
362AQP5GSM4909293HumanBreastIDC1.06e-03-1.93e-010.1581
362AQP5GSM4909297HumanBreastIDC1.84e-03-2.03e-010.1517
362AQP5GSM4909298HumanBreastIDC3.19e-05-2.09e-010.1551
362AQP5GSM4909301HumanBreastIDC8.30e-08-2.12e-010.1577
362AQP5GSM4909302HumanBreastIDC5.94e-07-2.12e-010.1545
362AQP5GSM4909304HumanBreastIDC3.84e-07-2.06e-010.1636
362AQP5GSM4909306HumanBreastIDC1.51e-02-1.96e-010.1564
362AQP5GSM4909307HumanBreastIDC1.21e-05-2.09e-010.1569
362AQP5GSM4909308HumanBreastIDC5.80e-06-2.12e-010.158
362AQP5GSM4909309HumanBreastIDC5.43e-06-2.12e-010.0483
362AQP5GSM4909311HumanBreastIDC8.30e-08-2.12e-010.1534
362AQP5GSM4909312HumanBreastIDC1.31e-04-1.98e-010.1552
362AQP5GSM4909315HumanBreastIDC1.77e-06-2.12e-010.21
362AQP5GSM4909319HumanBreastIDC1.77e-06-2.12e-010.1563
362AQP5GSM4909321HumanBreastIDC3.85e-08-2.12e-010.1559
362AQP5brca10HumanBreastPrecancer1.05e-05-2.12e-01-0.0029
362AQP5M1HumanBreastIDC5.20e-03-2.12e-010.1577
Page: 1 2 3 

check button Transcriptomic changes along malignancy continuum.
TissueExpression DynamicsAbbreviation
BreastThe image shows the transcriptomic changes along malignancy continuum.log2FC in expression of this searched gene in stem-like cells from each diseased tissue sample relative to stem-like cells in normal samples in each tissue plotted against the malignancy continuum. Samples are colored based on if they are from different disease stage.
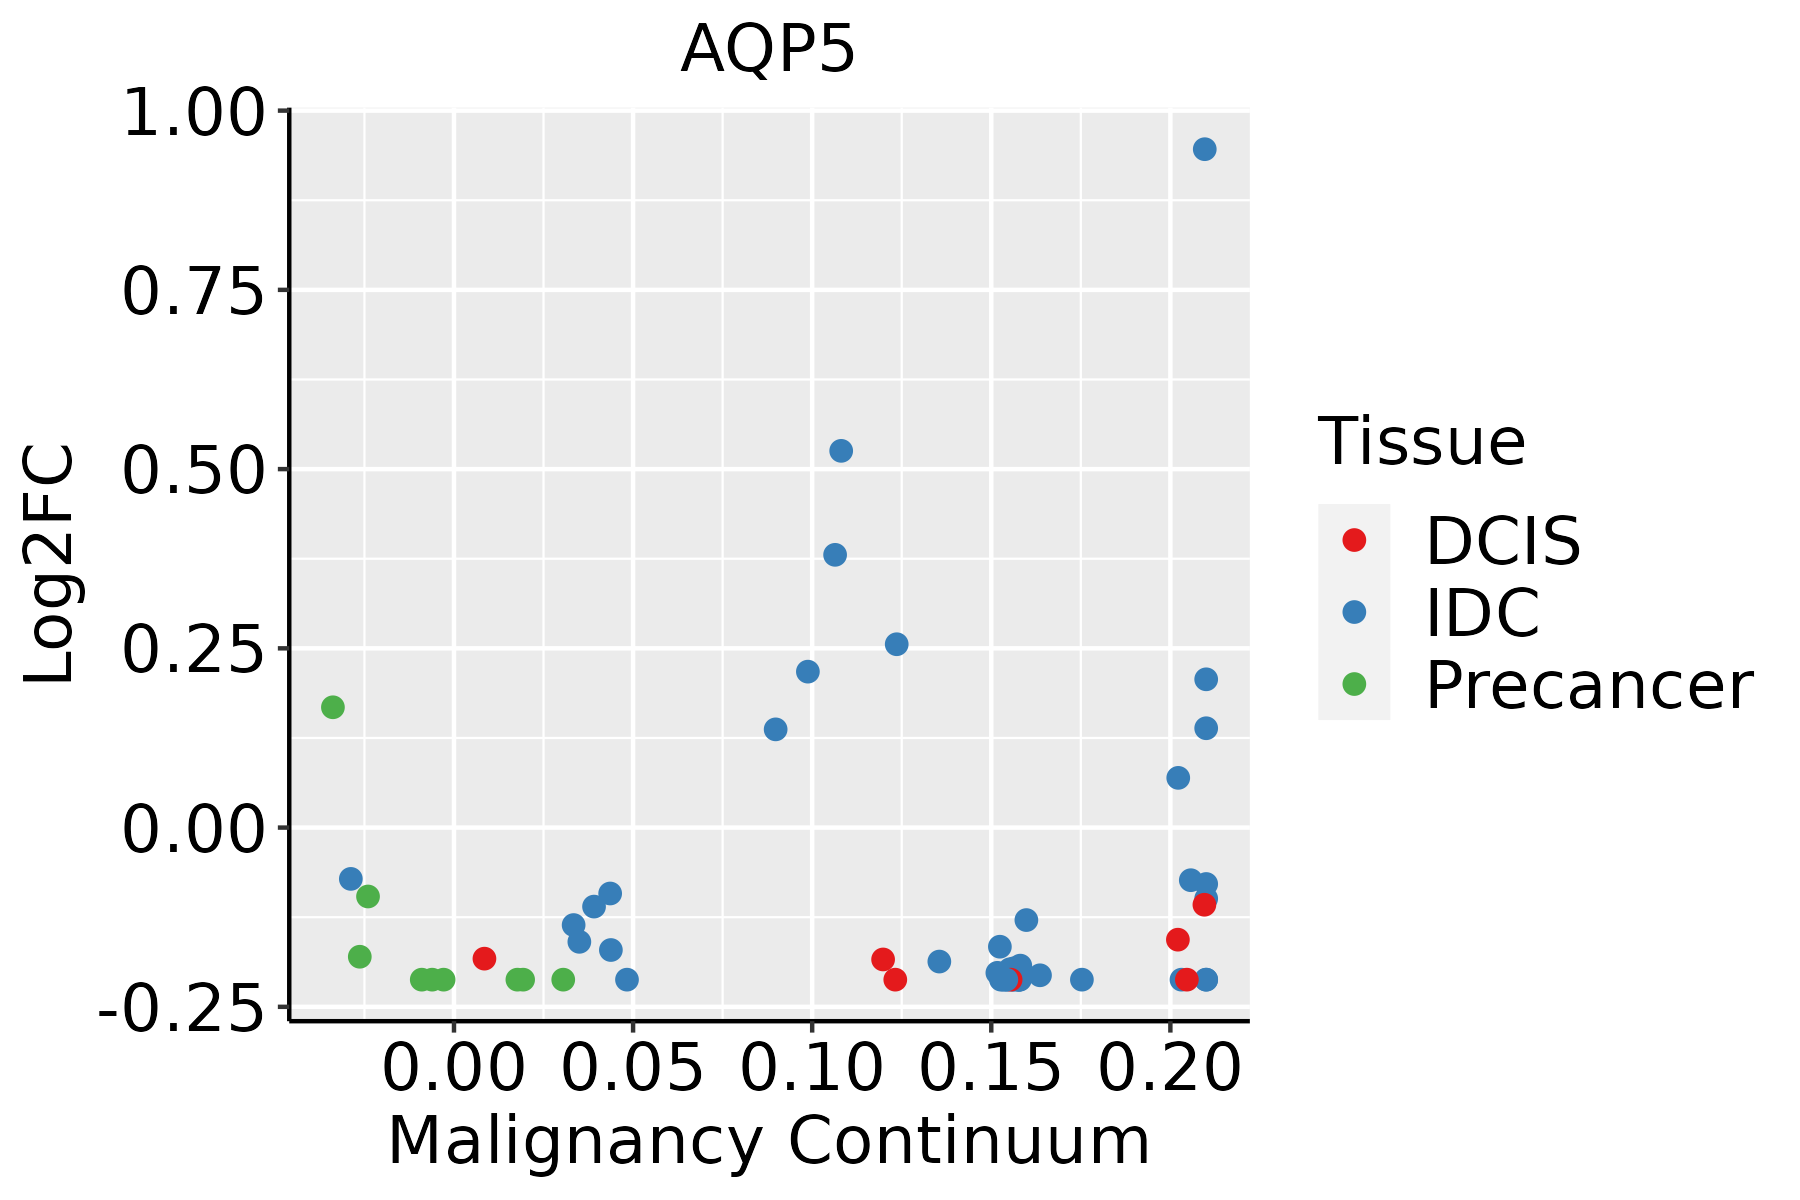
IDC: Invasive ductal carcinoma
DCIS: Ductal carcinoma in situ
Precancer(BRCA1-mut): Precancerous lesion from BRCA1 mutation carriers
CervixThe image shows the transcriptomic changes along malignancy continuum.log2FC in expression of this searched gene in stem-like cells from each diseased tissue sample relative to stem-like cells in normal samples in each tissue plotted against the malignancy continuum. Samples are colored based on if they are from different disease stage.CC: Cervix cancer
HSIL_HPV: HPV-infected high-grade squamous intraepithelial lesions
N_HPV: HPV-infected normal cervix
Colorectum (GSE201348)The image shows the transcriptomic changes along malignancy continuum.log2FC in expression of this searched gene in stem-like cells from each diseased tissue sample relative to stem-like cells in normal samples in each tissue plotted against the malignancy continuum. Samples are colored based on if they are from different disease stage.
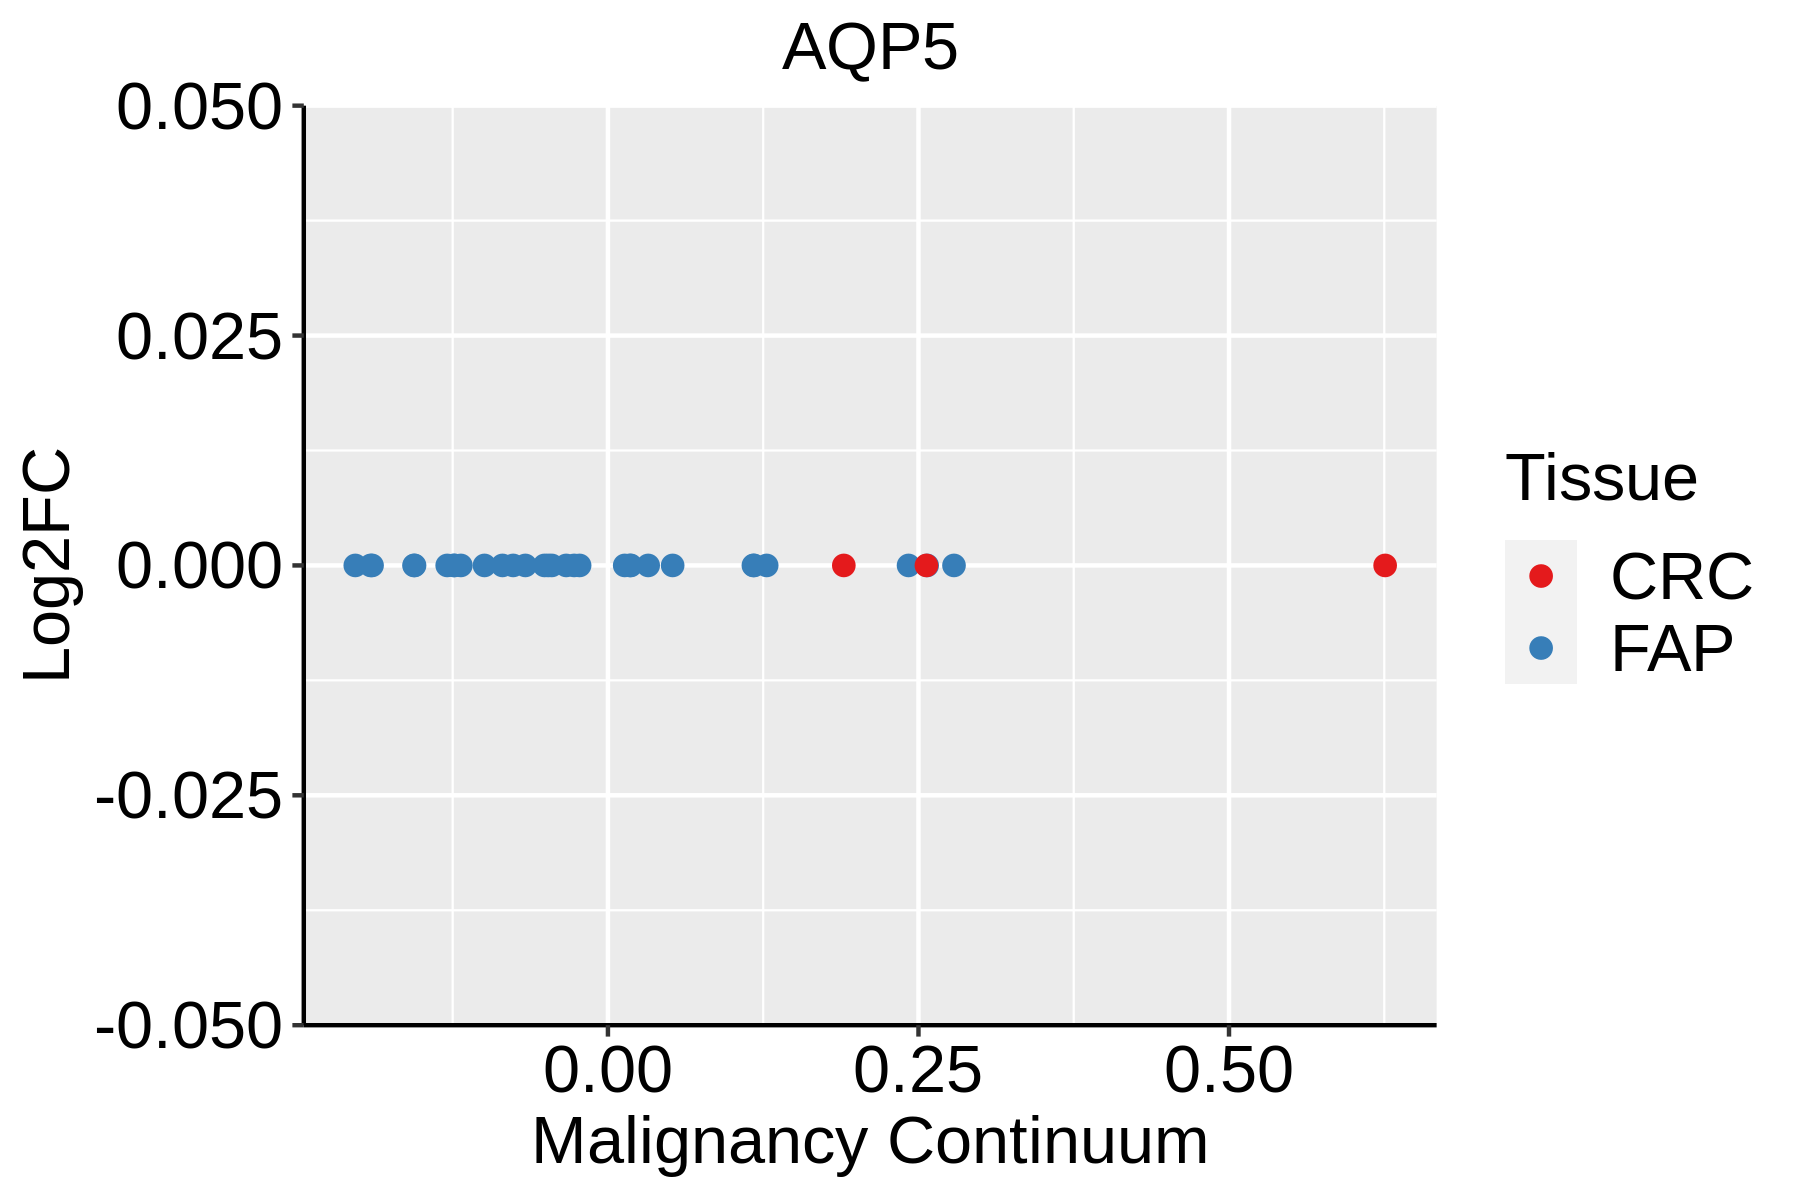
FAP: Familial adenomatous polyposis
CRC: Colorectal cancer
Colorectum (HTA11)The image shows the transcriptomic changes along malignancy continuum.log2FC in expression of this searched gene in stem-like cells from each diseased tissue sample relative to stem-like cells in normal samples in each tissue plotted against the malignancy continuum. Samples are colored based on if they are from different disease stage.AD: Adenomas
SER: Sessile serrated lesions
MSI-H: Microsatellite-high colorectal cancer
MSS: Microsatellite stable colorectal cancer
EsophagusThe image shows the transcriptomic changes along malignancy continuum.log2FC in expression of this searched gene in stem-like cells from each diseased tissue sample relative to stem-like cells in normal samples in each tissue plotted against the malignancy continuum. Samples are colored based on if they are from different disease stage.
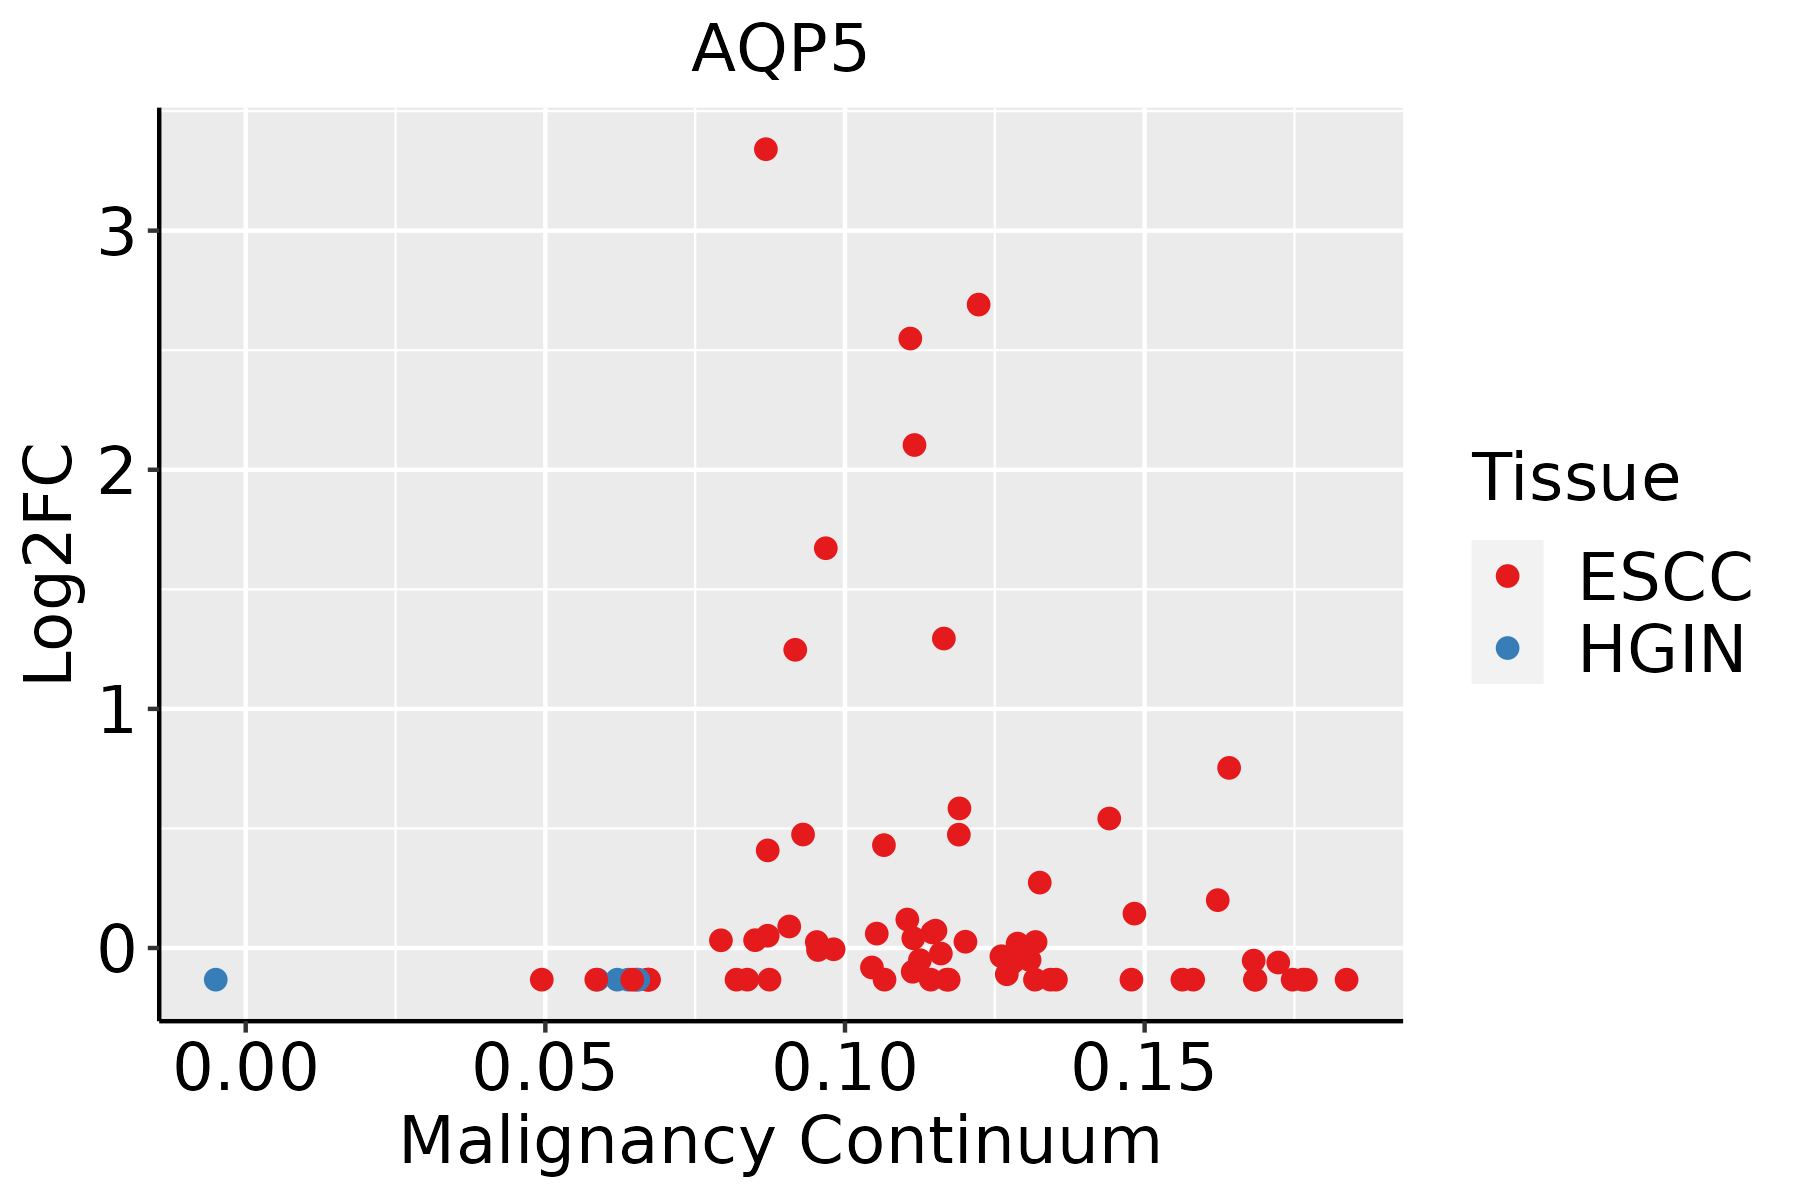
ESCC: Esophageal squamous cell carcinoma
HGIN: High-grade intraepithelial neoplasias
LGIN: Low-grade intraepithelial neoplasias
GCThe image shows the transcriptomic changes along malignancy continuum.log2FC in expression of this searched gene in stem-like cells from each diseased tissue sample relative to stem-like cells in normal samples in each tissue plotted against the malignancy continuum. Samples are colored based on if they are from different disease stage.CAG: Chronic atrophic gastritis
CAG with IM: Chronic atrophic gastritis with intestinal metaplasia
CSG: Chronic superficial gastritis
GC: Gastric cancer
SIM: Severe intestinal metaplasia
WIM: Wild intestinal metaplasia
Oral CavityThe image shows the transcriptomic changes along malignancy continuum.log2FC in expression of this searched gene in stem-like cells from each diseased tissue sample relative to stem-like cells in normal samples in each tissue plotted against the malignancy continuum. Samples are colored based on if they are from different disease stage.EOLP: Erosive Oral lichen planus
LP: leukoplakia
NEOLP: Non-erosive oral lichen planus
OSCC: Oral squamous cell carcinoma
∗log2FC in expression of this searched gene in stem-like cells from each diseased tissue sample relative to stem-like cells in normal samples in each tissue plotted against the malignancy continuum. Samples are colored based on if they are from different disease stage.

Top

Malignant transformation related pathway analysis

check buttonFind out the enriched GO biological processes and KEGG pathways involved in transition from healthy to precancer to cancer
check button Figure of enriched GO biological processes.
TissueDisease StageEnriched GO biological Processes
ColorectumADGO analysis - Figure of enriched GO biological processes: Top 15 enriched GO BP terms are showed in the bar plot of each disease state in each tissue. Each row represents a significant GO biological process which is colored according to the -log10(p.adjust).
ColorectumSERGO analysis - Figure of enriched GO biological processes: Top 15 enriched GO BP terms are showed in the bar plot of each disease state in each tissue. Each row represents a significant GO biological process which is colored according to the -log10(p.adjust).
ColorectumMSSGO analysis - Figure of enriched GO biological processes: Top 15 enriched GO BP terms are showed in the bar plot of each disease state in each tissue. Each row represents a significant GO biological process which is colored according to the -log10(p.adjust).
ColorectumMSI-HGO analysis - Figure of enriched GO biological processes: Top 15 enriched GO BP terms are showed in the bar plot of each disease state in each tissue. Each row represents a significant GO biological process which is colored according to the -log10(p.adjust).
ColorectumFAPGO analysis - Figure of enriched GO biological processes: Top 15 enriched GO BP terms are showed in the bar plot of each disease state in each tissue. Each row represents a significant GO biological process which is colored according to the -log10(p.adjust).
∗Top 15 enriched GO BP terms are showed in the bar plot of each disease state in each tissue. Each row represents a significant GO biological process which is colored according to the -log10(p.adjust).
Page: 1 2 3 4 5 6 7 8 9 

check button Enriched GO biological processes.
GO IDTissueDisease StageDescriptionGene RatioBg Ratiopvaluep.adjustCount
GO:0001654CervixCCeye development62/2311371/187237.83e-034.13e-0262
GO:0048880CervixCCsensory system development63/2311381/187239.29e-034.66e-0263
GO:005087814CervixHSIL_HPVregulation of body fluid levels37/737379/187233.81e-072.06e-0537
GO:006219715CervixHSIL_HPVcellular response to chemical stress29/737337/187237.17e-051.65e-0329
GO:00621971ColorectumSERcellular response to chemical stress87/2897337/187235.33e-072.59e-0587
GO:0022600ColorectumSERdigestive system process29/2897104/187238.57e-041.05e-0229
GO:00508781ColorectumSERregulation of body fluid levels81/2897379/187231.28e-031.43e-0281
GO:00075891ColorectumSERbody fluid secretion26/289793/187231.49e-031.60e-0226
GO:0032941ColorectumSERsecretion by tissue13/289738/187233.40e-032.90e-0213
GO:0006970ColorectumSERresponse to osmotic stress23/289784/187233.61e-033.03e-0223
GO:0062197111EsophagusESCCcellular response to chemical stress234/8552337/187235.37e-195.97e-17234
GO:007121419EsophagusESCCcellular response to abiotic stimulus206/8552331/187237.52e-101.88e-08206
GO:010400419EsophagusESCCcellular response to environmental stimulus206/8552331/187237.52e-101.88e-08206
GO:00069707EsophagusESCCresponse to osmotic stress57/855284/187233.26e-052.70e-0457
GO:00714707EsophagusESCCcellular response to osmotic stress31/855241/187239.32e-056.68e-0431
GO:00512623EsophagusESCCprotein tetramerization54/855287/187231.50e-037.06e-0354
GO:0006971EsophagusESCChypotonic response10/855211/187232.54e-031.08e-0210
GO:00512592EsophagusESCCprotein complex oligomerization130/8552238/187233.29e-031.36e-02130
GO:006219720Oral cavityOSCCcellular response to chemical stress204/7305337/187236.89e-165.19e-14204
GO:007121416Oral cavityOSCCcellular response to abiotic stimulus186/7305331/187231.38e-104.10e-09186
Page: 1 2 3 4 

check button Enriched KEGG pathways.
Pathway IDTissueDisease StageDescriptionGene RatioBg Ratiopvaluep.adjustqvalueCount
hsa049704BreastIDCSalivary secretion18/86793/84655.69e-033.13e-022.34e-0218
hsa0497011BreastIDCSalivary secretion18/86793/84655.69e-033.13e-022.34e-0218
Page: 1 

Top

Cell-cell communication analysis

check buttonIdentification of potential cell-cell interactions between two cell types and their ligand-receptor pairs for different disease states
LigandReceptorLRpairPathwayTissueDisease Stage
Page: 1 

Top

Single-cell gene regulatory network inference analysis

check buttonFind out the significant the regulons (TFs) and the target genes of each regulon across cell types for different disease states
TFCell TypeTissueDisease StageTarget GeneRSSRegulon Activity
∗The dot plots of a searched regulon are shown for all cell subpopulations in each disease state of each tissue based on the regulon specific score inferred using pySCENIC and by calculating the average expression.
Page: 1 

Top

Somatic mutation of malignant transformation related genes

check buttonAnnotation of somatic variants for genes involved in malignant transformation
Hugo SymbolVariant ClassVariant ClassificationdbSNP RSHGVScHGVSpHGVSp ShortSWISSPROTBIOTYPESIFTPolyPhenTumor Sample BarcodeTissueHistologySexAgeStageTherapy TypesDrugsOutcome
AQP5SNVMissense_Mutationc.301G>Ap.Gly101Argp.G101RP55064protein_codingdeleterious(0.03)probably_damaging(0.998)TCGA-A7-A26H-01Breastbreast invasive carcinomaFemale>=65I/IIHormone TherapyanastrozolePD
AQP5SNVMissense_Mutationc.92N>Gp.Ser31Trpp.S31WP55064protein_codingdeleterious(0)probably_damaging(1)TCGA-E2-A152-01Breastbreast invasive carcinomaFemale<65I/IITargeted Molecular therapytrastuzumabPD
AQP5insertionIn_Frame_Insnovelc.702_703insGTGp.Glu234_Arg235insValp.E234_R235insVP55064protein_codingTCGA-A8-A09D-01Breastbreast invasive carcinomaFemale<65I/IIChemotherapydoxorubicinCR
AQP5insertionNonsense_Mutationnovelc.730_731insCACTTCAGATGGATGAGTCCAGCAGAGTTTAp.Glu244AlafsTer11p.E244Afs*11P55064protein_codingTCGA-A8-A0A4-01Breastbreast invasive carcinomaFemale>=65I/IIHormone TherapytamoxiphenCR
AQP5SNVMissense_Mutationc.226C>Tp.Leu76Phep.L76FP55064protein_codingtolerated(1)benign(0.035)TCGA-EA-A6QX-01Cervixcervical & endocervical cancerFemale<65III/IVUnknownUnknownSD
AQP5SNVMissense_Mutationnovelc.197G>Tp.Gly66Valp.G66VP55064protein_codingdeleterious(0.01)probably_damaging(0.977)TCGA-ZJ-AAX4-01Cervixcervical & endocervical cancerFemale>=65I/IIUnknownUnknownSD
AQP5SNVMissense_Mutationnovelc.46N>Ap.Ala16Thrp.A16TP55064protein_codingtolerated(0.05)probably_damaging(0.925)TCGA-CA-6717-01Colorectumcolon adenocarcinomaMale<65I/IIChemotherapyoxaliplatinCR
AQP5SNVMissense_Mutationc.766N>Tp.Arg256Trpp.R256WP55064protein_codingdeleterious(0)possibly_damaging(0.857)TCGA-AP-A051-01Endometriumuterine corpus endometrioid carcinomaFemale>=65I/IIUnknownUnknownSD
AQP5SNVMissense_Mutationnovelc.161N>Ap.Gly54Aspp.G54DP55064protein_codingdeleterious(0)possibly_damaging(0.684)TCGA-AP-A1DK-01Endometriumuterine corpus endometrioid carcinomaFemale<65I/IIUnknownUnknownSD
AQP5SNVMissense_Mutationnovelc.286G>Ap.Val96Metp.V96MP55064protein_codingdeleterious(0.01)benign(0.438)TCGA-B5-A1MX-01Endometriumuterine corpus endometrioid carcinomaFemale<65I/IIHormone TherapymegaceSD
Page: 1 2 3 

Top

Related drugs of malignant transformation related genes

check buttonIdentification of chemicals and drugs interact with genes involved in malignant transfromation
(DGIdb 4.0)
Entrez IDSymbolCategoryInteraction TypesDrug Claim NameDrug NamePMIDs
362AQP5ION CHANNEL, TRANSPORTERinhibitor178101032
Page: 1