
|
|||||
|
 | |
| |
| |
| |
| |
| |
|
Gene: APIP |
Gene summary for APIP |
| Gene information | Species | Human | Gene symbol | APIP | Gene ID | 51074 |
| Gene name | APAF1 interacting protein | |
| Gene Alias | APIP2 | |
| Cytomap | 11p13 | |
| Gene Type | protein-coding | GO ID | GO:0000096 | UniProtAcc | Q96GX9 |
Top |
Malignant transformation analysis |
| Identification of the aberrant gene expression in precancerous and cancerous lesions by comparing the gene expression of stem-like cells in diseased tissues with normal stem cells |
| Entrez ID | Symbol | Replicates | Species | Organ | Tissue | Adj P-value | Log2FC | Malignancy |
| 51074 | APIP | LZE7T | Human | Esophagus | ESCC | 2.88e-06 | 4.18e-01 | 0.0667 |
| 51074 | APIP | LZE8T | Human | Esophagus | ESCC | 7.89e-09 | 2.69e-01 | 0.067 |
| 51074 | APIP | LZE24T | Human | Esophagus | ESCC | 1.96e-14 | 3.87e-01 | 0.0596 |
| 51074 | APIP | LZE6T | Human | Esophagus | ESCC | 1.01e-03 | 2.23e-01 | 0.0845 |
| 51074 | APIP | P1T-E | Human | Esophagus | ESCC | 1.73e-04 | 1.03e-01 | 0.0875 |
| 51074 | APIP | P2T-E | Human | Esophagus | ESCC | 2.94e-23 | 4.66e-01 | 0.1177 |
| 51074 | APIP | P4T-E | Human | Esophagus | ESCC | 1.51e-21 | 4.60e-01 | 0.1323 |
| 51074 | APIP | P5T-E | Human | Esophagus | ESCC | 2.92e-12 | 1.17e-01 | 0.1327 |
| 51074 | APIP | P8T-E | Human | Esophagus | ESCC | 5.58e-30 | 7.02e-01 | 0.0889 |
| 51074 | APIP | P9T-E | Human | Esophagus | ESCC | 2.93e-13 | 1.40e-01 | 0.1131 |
| 51074 | APIP | P10T-E | Human | Esophagus | ESCC | 2.24e-20 | 2.91e-01 | 0.116 |
| 51074 | APIP | P11T-E | Human | Esophagus | ESCC | 7.55e-15 | 7.19e-01 | 0.1426 |
| 51074 | APIP | P12T-E | Human | Esophagus | ESCC | 9.06e-22 | 3.20e-01 | 0.1122 |
| 51074 | APIP | P15T-E | Human | Esophagus | ESCC | 2.23e-19 | 4.96e-01 | 0.1149 |
| 51074 | APIP | P16T-E | Human | Esophagus | ESCC | 1.50e-13 | 1.55e-01 | 0.1153 |
| 51074 | APIP | P17T-E | Human | Esophagus | ESCC | 1.91e-07 | 4.11e-01 | 0.1278 |
| 51074 | APIP | P19T-E | Human | Esophagus | ESCC | 9.45e-04 | 3.71e-01 | 0.1662 |
| 51074 | APIP | P20T-E | Human | Esophagus | ESCC | 4.45e-15 | 2.79e-01 | 0.1124 |
| 51074 | APIP | P21T-E | Human | Esophagus | ESCC | 2.47e-27 | 6.89e-01 | 0.1617 |
| 51074 | APIP | P22T-E | Human | Esophagus | ESCC | 1.33e-22 | 3.14e-01 | 0.1236 |
| Page: 1 2 3 4 5 6 |
| Tissue | Expression Dynamics | Abbreviation |
| Esophagus | 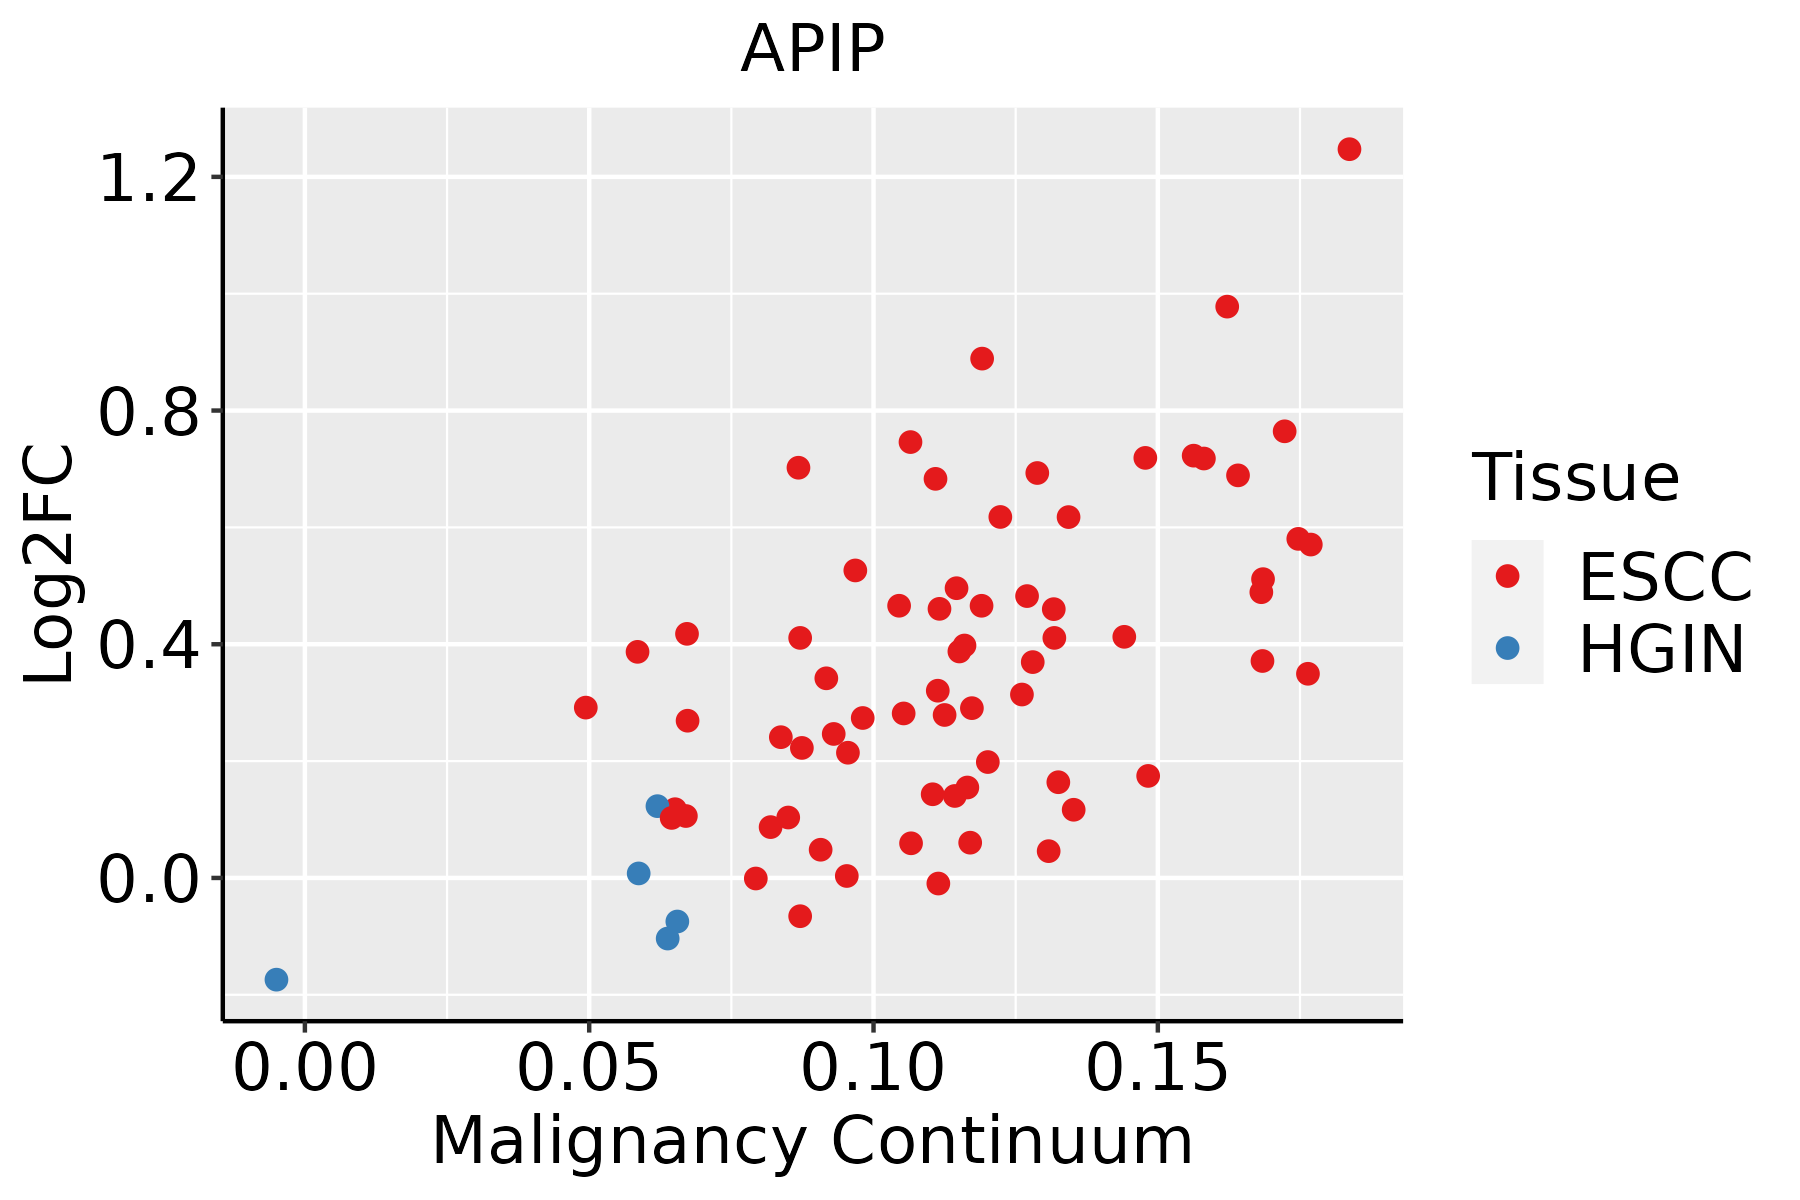 | ESCC: Esophageal squamous cell carcinoma |
| HGIN: High-grade intraepithelial neoplasias | ||
| LGIN: Low-grade intraepithelial neoplasias | ||
| Liver | 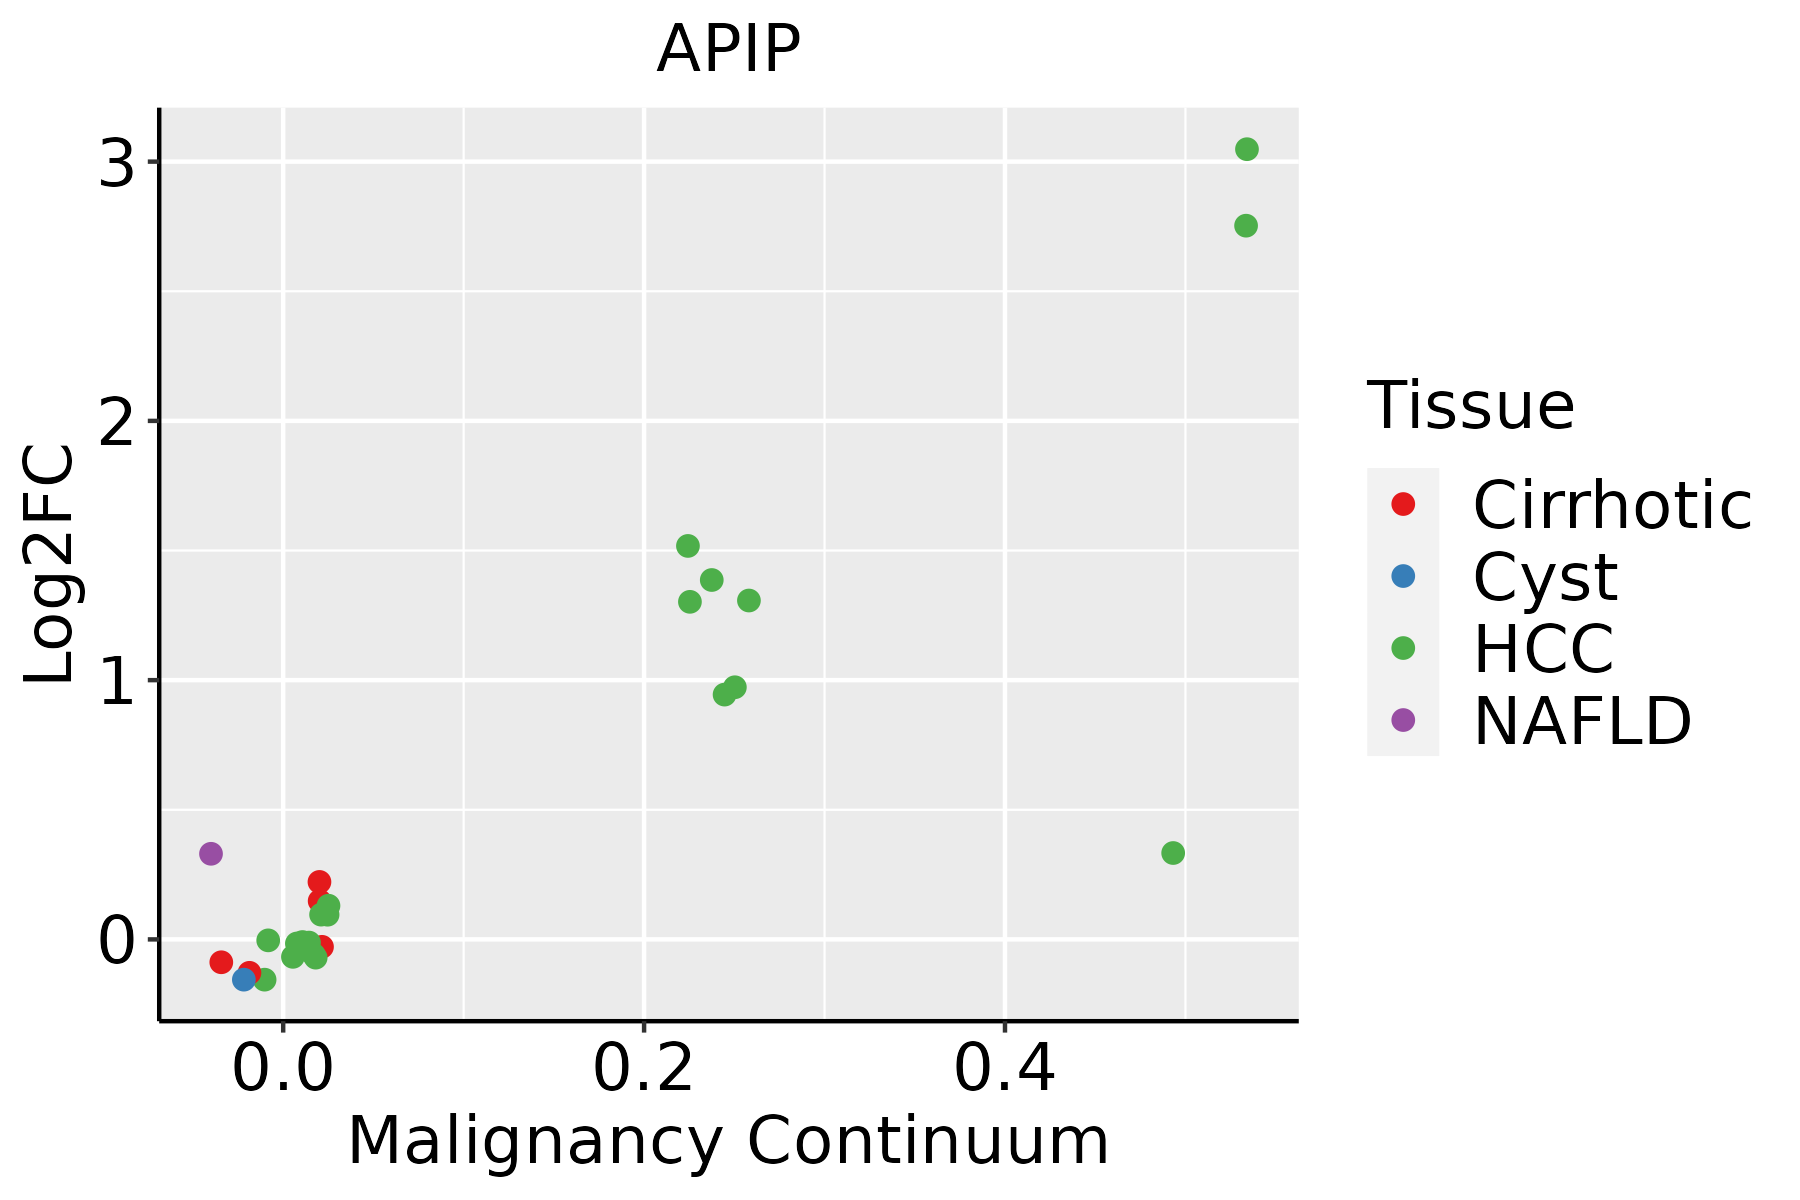 | HCC: Hepatocellular carcinoma |
| NAFLD: Non-alcoholic fatty liver disease | ||
| Oral Cavity | 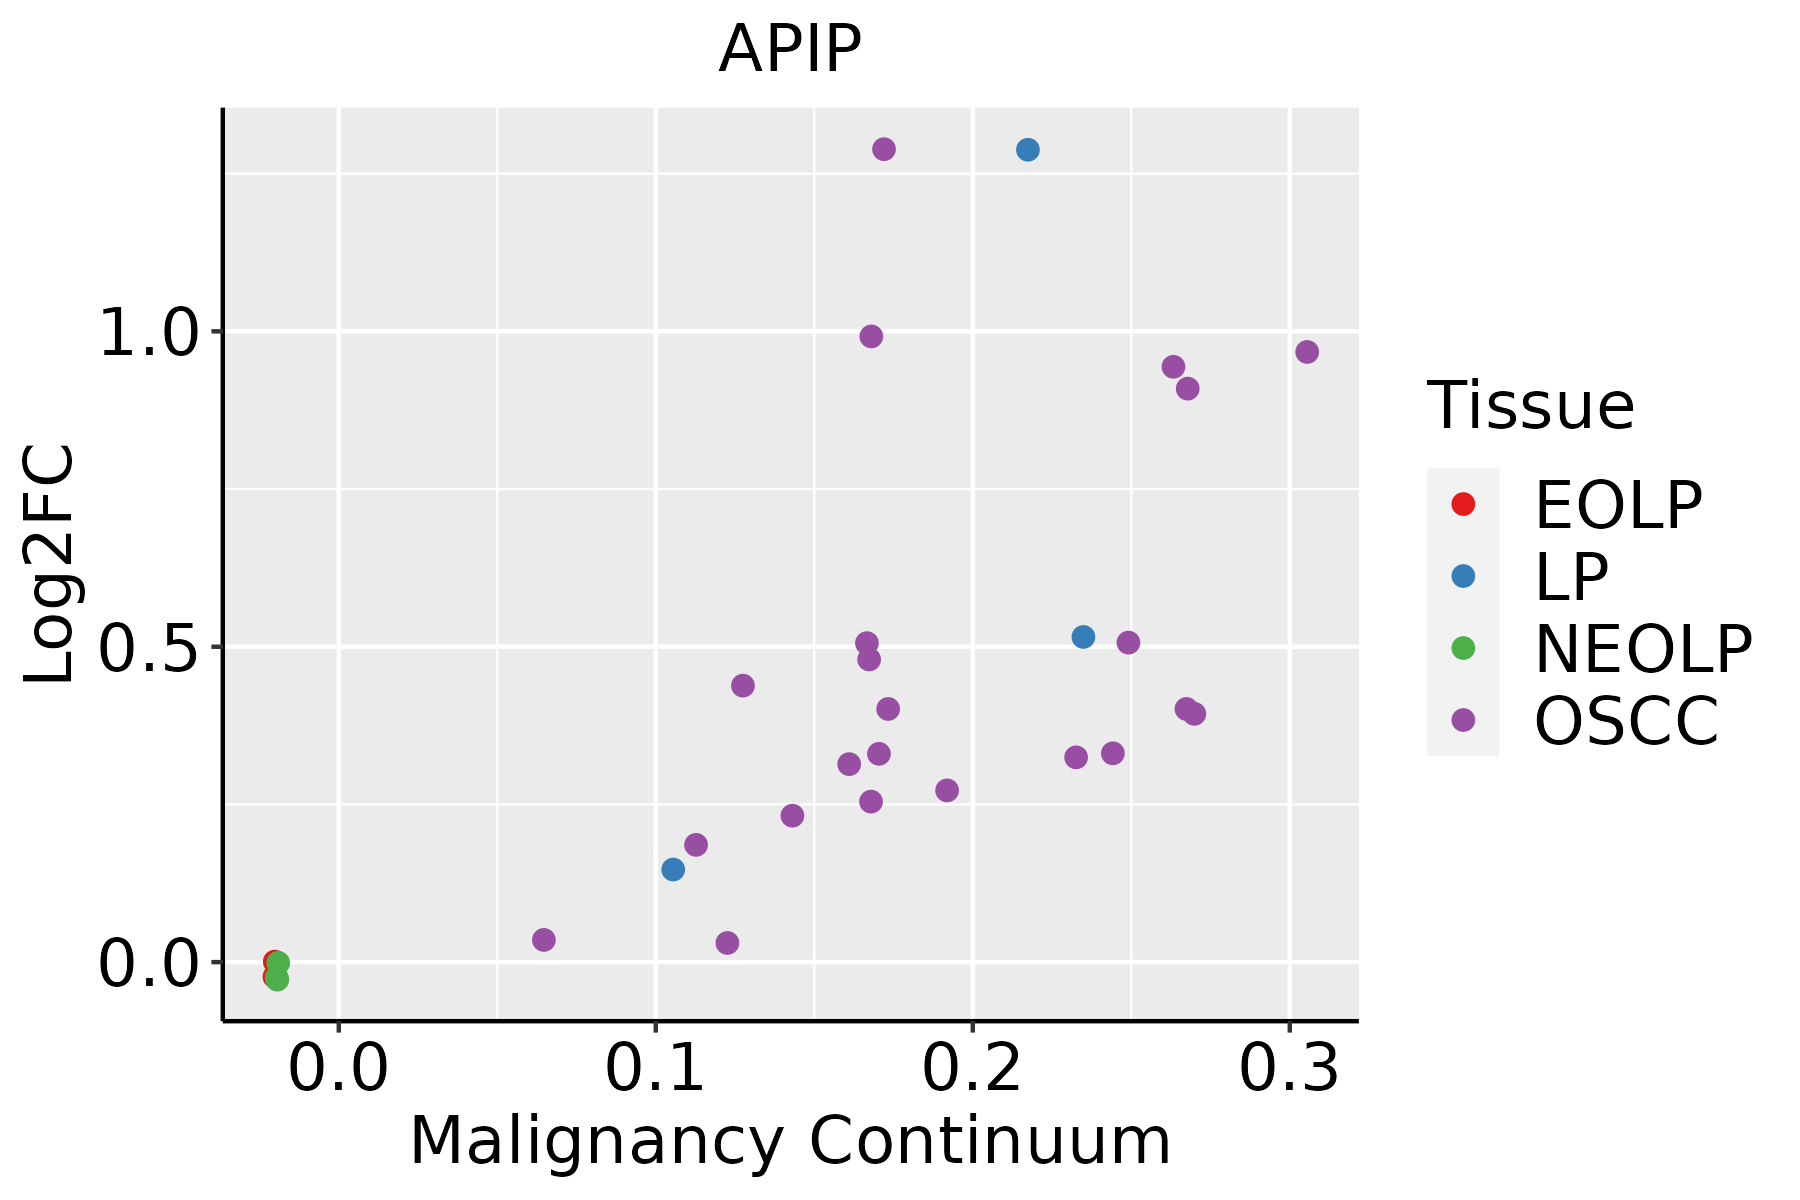 | EOLP: Erosive Oral lichen planus |
| LP: leukoplakia | ||
| NEOLP: Non-erosive oral lichen planus | ||
| OSCC: Oral squamous cell carcinoma | ||
| Prostate | 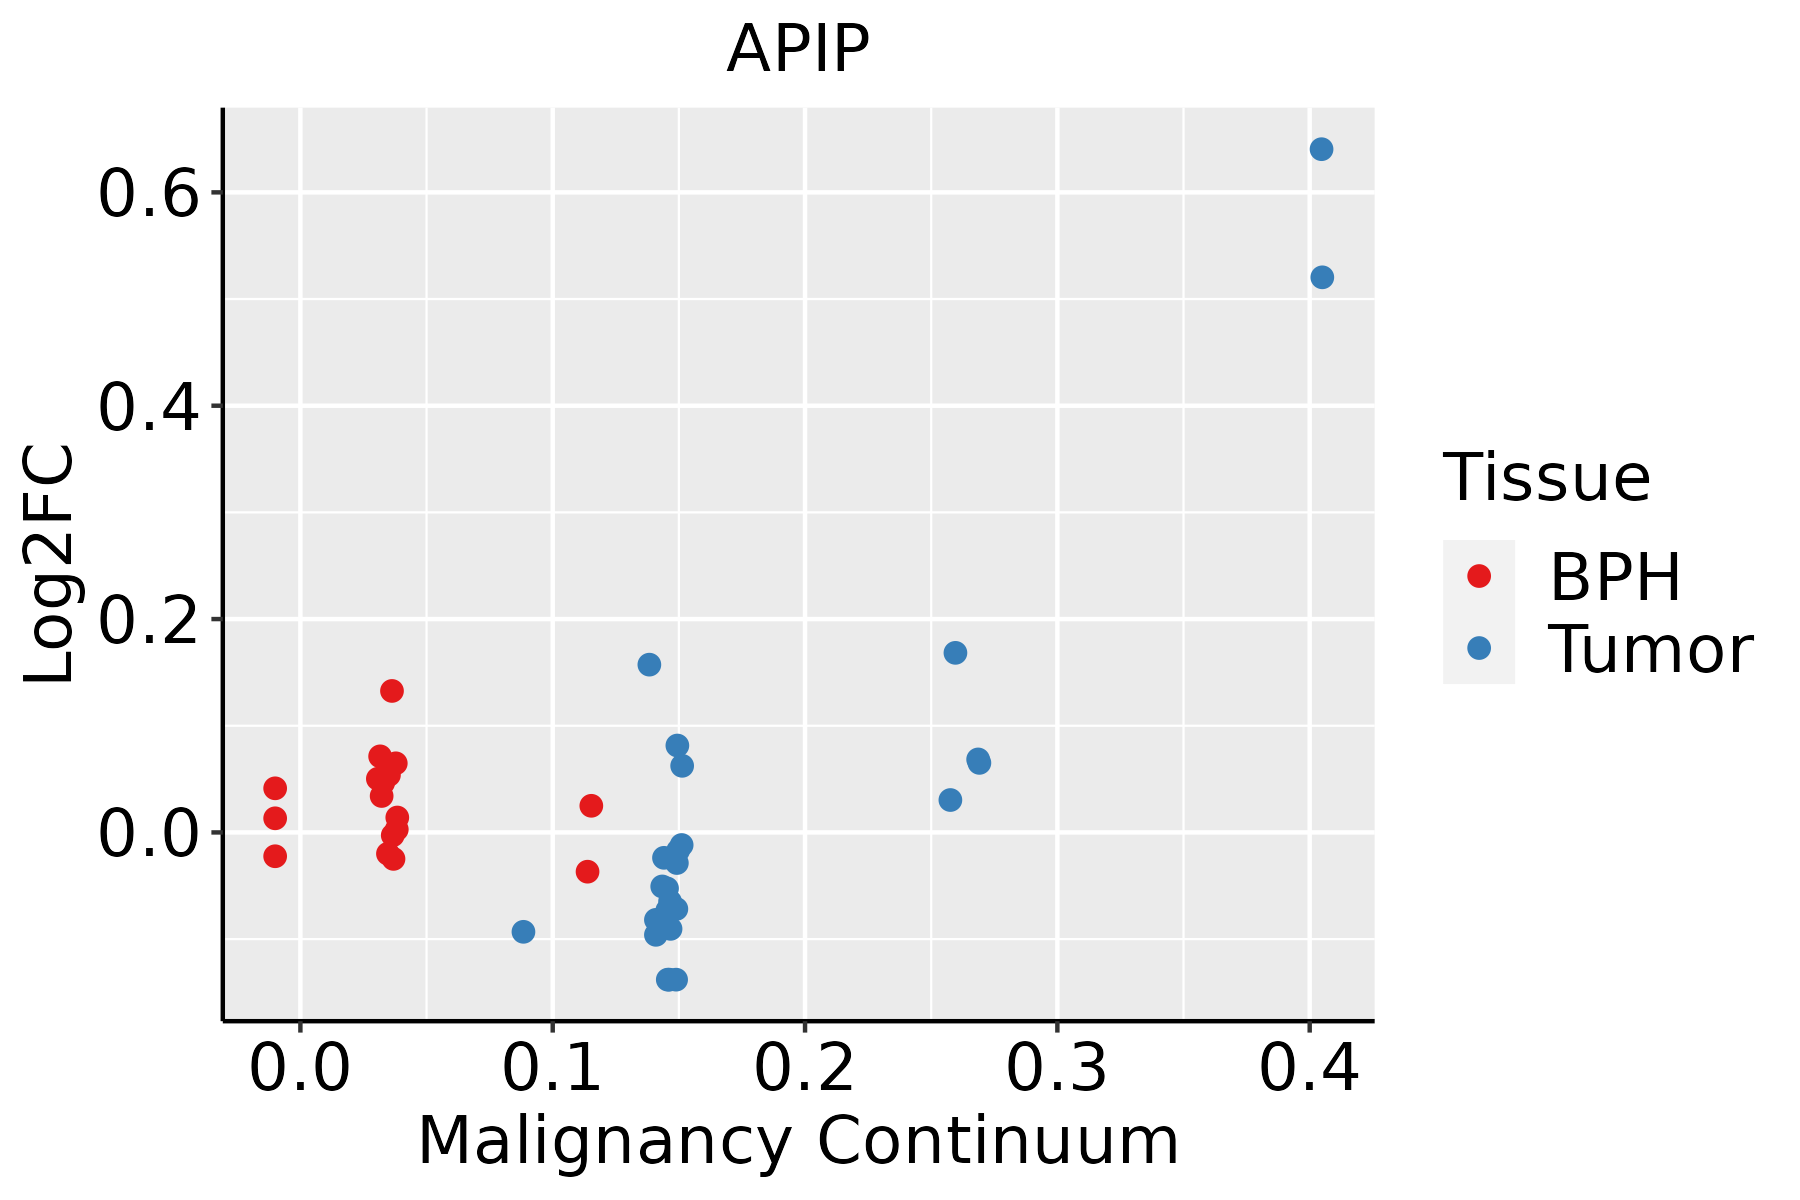 | BPH: Benign Prostatic Hyperplasia |
| Skin |  | AK: Actinic keratosis |
| cSCC: Cutaneous squamous cell carcinoma | ||
| SCCIS:squamous cell carcinoma in situ | ||
| Thyroid | 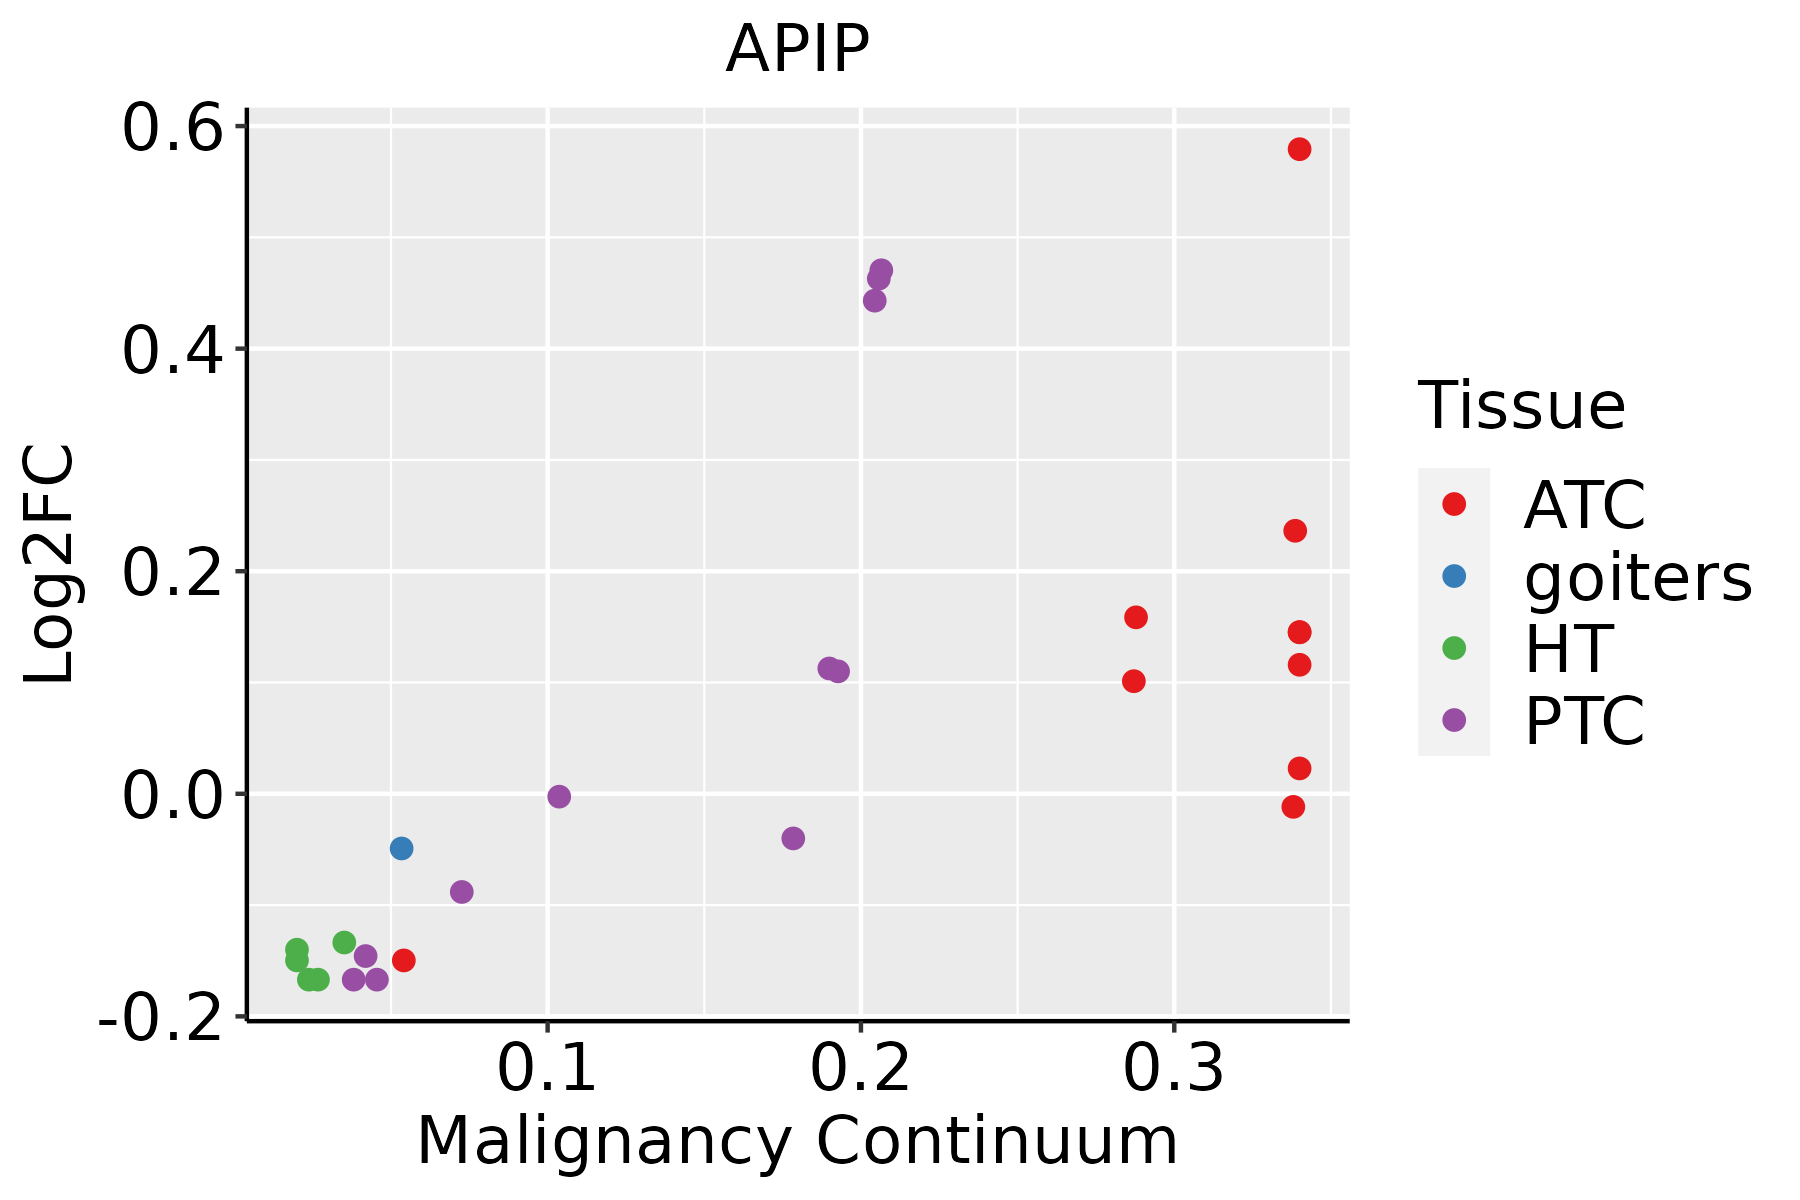 | ATC: Anaplastic thyroid cancer |
| HT: Hashimoto's thyroiditis | ||
| PTC: Papillary thyroid cancer |
| ∗log2FC in expression of this searched gene in stem-like cells from each diseased tissue sample relative to stem-like cells in normal samples in each tissue plotted against the malignancy continuum. Samples are colored based on if they are from different disease stage. |
Top |
Malignant transformation related pathway analysis |
| Find out the enriched GO biological processes and KEGG pathways involved in transition from healthy to precancer to cancer |
| Tissue | Disease Stage | Enriched GO biological Processes |
| Colorectum | AD |  |
| Colorectum | SER |  |
| Colorectum | MSS |  |
| Colorectum | MSI-H |  |
| Colorectum | FAP |  |
| ∗Top 15 enriched GO BP terms are showed in the bar plot of each disease state in each tissue. Each row represents a significant GO biological process which is colored according to the -log10(p.adjust). |
| Page: 1 2 3 4 5 6 7 8 9 |
| GO ID | Tissue | Disease Stage | Description | Gene Ratio | Bg Ratio | pvalue | p.adjust | Count |
| GO:00090661 | Liver | Cirrhotic | aspartate family amino acid metabolic process | 21/4634 | 49/18723 | 4.13e-03 | 2.21e-02 | 21 |
| GO:00090671 | Liver | Cirrhotic | aspartate family amino acid biosynthetic process | 11/4634 | 21/18723 | 5.89e-03 | 2.95e-02 | 11 |
| GO:001605321 | Liver | HCC | organic acid biosynthetic process | 200/7958 | 316/18723 | 5.24e-14 | 3.22e-12 | 200 |
| GO:000679021 | Liver | HCC | sulfur compound metabolic process | 212/7958 | 339/18723 | 5.60e-14 | 3.39e-12 | 212 |
| GO:004639421 | Liver | HCC | carboxylic acid biosynthetic process | 198/7958 | 314/18723 | 1.19e-13 | 6.78e-12 | 198 |
| GO:00086522 | Liver | HCC | cellular amino acid biosynthetic process | 58/7958 | 76/18723 | 1.98e-09 | 5.63e-08 | 58 |
| GO:19016052 | Liver | HCC | alpha-amino acid metabolic process | 124/7958 | 195/18723 | 2.07e-09 | 5.79e-08 | 124 |
| GO:19016072 | Liver | HCC | alpha-amino acid biosynthetic process | 53/7958 | 68/18723 | 2.62e-09 | 7.16e-08 | 53 |
| GO:00065202 | Liver | HCC | cellular amino acid metabolic process | 167/7958 | 284/18723 | 1.91e-08 | 4.56e-07 | 167 |
| GO:00442722 | Liver | HCC | sulfur compound biosynthetic process | 95/7958 | 148/18723 | 7.89e-08 | 1.58e-06 | 95 |
| GO:00000962 | Liver | HCC | sulfur amino acid metabolic process | 29/7958 | 34/18723 | 3.26e-07 | 5.62e-06 | 29 |
| GO:00090672 | Liver | HCC | aspartate family amino acid biosynthetic process | 19/7958 | 21/18723 | 6.44e-06 | 7.84e-05 | 19 |
| GO:00090861 | Liver | HCC | methionine biosynthetic process | 12/7958 | 12/18723 | 3.46e-05 | 3.45e-04 | 12 |
| GO:00090662 | Liver | HCC | aspartate family amino acid metabolic process | 34/7958 | 49/18723 | 1.28e-04 | 1.06e-03 | 34 |
| GO:00000971 | Liver | HCC | sulfur amino acid biosynthetic process | 15/7958 | 17/18723 | 1.31e-04 | 1.07e-03 | 15 |
| GO:00065551 | Liver | HCC | methionine metabolic process | 14/7958 | 16/18723 | 2.73e-04 | 1.98e-03 | 14 |
| GO:0043094 | Liver | HCC | cellular metabolic compound salvage | 20/7958 | 26/18723 | 3.82e-04 | 2.61e-03 | 20 |
| GO:0046500 | Liver | HCC | S-adenosylmethionine metabolic process | 13/7958 | 15/18723 | 5.67e-04 | 3.61e-03 | 13 |
| GO:0051262 | Liver | HCC | protein tetramerization | 50/7958 | 87/18723 | 3.42e-03 | 1.55e-02 | 50 |
| GO:0051289 | Liver | HCC | protein homotetramerization | 33/7958 | 57/18723 | 1.37e-02 | 4.86e-02 | 33 |
| Page: 1 2 3 4 |
| Pathway ID | Tissue | Disease Stage | Description | Gene Ratio | Bg Ratio | pvalue | p.adjust | qvalue | Count |
| hsa00270 | Liver | Cirrhotic | Cysteine and methionine metabolism | 27/2530 | 52/8465 | 6.98e-04 | 4.15e-03 | 2.56e-03 | 27 |
| hsa002701 | Liver | Cirrhotic | Cysteine and methionine metabolism | 27/2530 | 52/8465 | 6.98e-04 | 4.15e-03 | 2.56e-03 | 27 |
| hsa002702 | Liver | HCC | Cysteine and methionine metabolism | 35/4020 | 52/8465 | 3.03e-03 | 9.94e-03 | 5.53e-03 | 35 |
| hsa002703 | Liver | HCC | Cysteine and methionine metabolism | 35/4020 | 52/8465 | 3.03e-03 | 9.94e-03 | 5.53e-03 | 35 |
| Page: 1 |
Top |
Cell-cell communication analysis |
| Identification of potential cell-cell interactions between two cell types and their ligand-receptor pairs for different disease states |
| Ligand | Receptor | LRpair | Pathway | Tissue | Disease Stage |
| Page: 1 |
Top |
Single-cell gene regulatory network inference analysis |
| Find out the significant the regulons (TFs) and the target genes of each regulon across cell types for different disease states |
| TF | Cell Type | Tissue | Disease Stage | Target Gene | RSS | Regulon Activity |
| ∗The dot plots of a searched regulon are shown for all cell subpopulations in each disease state of each tissue based on the regulon specific score inferred using pySCENIC and by calculating the average expression. |
| Page: 1 |
Top |
Somatic mutation of malignant transformation related genes |
| Annotation of somatic variants for genes involved in malignant transformation |
| Hugo Symbol | Variant Class | Variant Classification | dbSNP RS | HGVSc | HGVSp | HGVSp Short | SWISSPROT | BIOTYPE | SIFT | PolyPhen | Tumor Sample Barcode | Tissue | Histology | Sex | Age | Stage | Therapy Types | Drugs | Outcome |
| APIP | SNV | Missense_Mutation | c.150G>C | p.Leu50Phe | p.L50F | Q96GX9 | protein_coding | deleterious(0) | benign(0.156) | TCGA-C5-A2LX-01 | Cervix | cervical & endocervical cancer | Female | <65 | I/II | Chemotherapy | cisplatin | SD | |
| APIP | SNV | Missense_Mutation | c.154N>T | p.His52Tyr | p.H52Y | Q96GX9 | protein_coding | tolerated(0.89) | benign(0.003) | TCGA-AZ-4682-01 | Colorectum | colon adenocarcinoma | Male | <65 | I/II | Chemotherapy | camptosar | PD | |
| APIP | SNV | Missense_Mutation | novel | c.572N>A | p.Leu191Gln | p.L191Q | Q96GX9 | protein_coding | deleterious(0) | probably_damaging(0.976) | TCGA-AG-3726-01 | Colorectum | rectum adenocarcinoma | Female | <65 | I/II | Unknown | Unknown | SD |
| APIP | deletion | Frame_Shift_Del | c.607delN | p.Thr203HisfsTer22 | p.T203Hfs*22 | Q96GX9 | protein_coding | TCGA-NH-A5IV-01 | Colorectum | colon adenocarcinoma | Female | >=65 | I/II | Unknown | Unknown | SD | |||
| APIP | SNV | Missense_Mutation | rs773115995 | c.589N>A | p.Val197Ile | p.V197I | Q96GX9 | protein_coding | tolerated(0.62) | benign(0.122) | TCGA-A5-A0G2-01 | Endometrium | uterine corpus endometrioid carcinoma | Female | <65 | III/IV | Unknown | Unknown | SD |
| APIP | SNV | Missense_Mutation | c.608N>A | p.Thr203Lys | p.T203K | Q96GX9 | protein_coding | deleterious(0.01) | possibly_damaging(0.772) | TCGA-B5-A0K4-01 | Endometrium | uterine corpus endometrioid carcinoma | Female | <65 | I/II | Chemotherapy | carboplatin | SD | |
| APIP | SNV | Missense_Mutation | c.298N>A | p.Leu100Ile | p.L100I | Q96GX9 | protein_coding | deleterious(0.02) | possibly_damaging(0.785) | TCGA-B5-A11E-01 | Endometrium | uterine corpus endometrioid carcinoma | Female | <65 | I/II | Unknown | Unknown | SD | |
| APIP | SNV | Missense_Mutation | novel | c.659N>C | p.Ile220Thr | p.I220T | Q96GX9 | protein_coding | tolerated(0.07) | benign(0.039) | TCGA-DF-A2KU-01 | Endometrium | uterine corpus endometrioid carcinoma | Female | Unknown | I/II | Unknown | Unknown | SD |
| APIP | SNV | Missense_Mutation | novel | c.236N>G | p.Asn79Ser | p.N79S | Q96GX9 | protein_coding | tolerated(0.6) | benign(0) | TCGA-DI-A1BU-01 | Endometrium | uterine corpus endometrioid carcinoma | Female | <65 | I/II | Chemotherapy | paclitaxel | SD |
| APIP | SNV | Missense_Mutation | novel | c.665T>C | p.Val222Ala | p.V222A | Q96GX9 | protein_coding | deleterious(0) | possibly_damaging(0.733) | TCGA-EO-A22U-01 | Endometrium | uterine corpus endometrioid carcinoma | Female | >=65 | I/II | Unknown | Unknown | SD |
| Page: 1 2 |
Top |
Related drugs of malignant transformation related genes |
| Identification of chemicals and drugs interact with genes involved in malignant transfromation |
| (DGIdb 4.0) |
| Entrez ID | Symbol | Category | Interaction Types | Drug Claim Name | Drug Name | PMIDs |
| Page: 1 |

Copyright 2023-Present -The University of Texas Health Science Center at Houston |