
|
|||||
|
 | |
| |
| |
| |
| |
| |
|
Gene: APBB1 |
Gene summary for APBB1 |
| Gene information | Species | Human | Gene symbol | APBB1 | Gene ID | 322 |
| Gene name | amyloid beta precursor protein binding family B member 1 | |
| Gene Alias | FE65 | |
| Cytomap | 11p15.4 | |
| Gene Type | protein-coding | GO ID | GO:0000122 | UniProtAcc | O00213 |
Top |
Malignant transformation analysis |
| Identification of the aberrant gene expression in precancerous and cancerous lesions by comparing the gene expression of stem-like cells in diseased tissues with normal stem cells |
| Entrez ID | Symbol | Replicates | Species | Organ | Tissue | Adj P-value | Log2FC | Malignancy |
| 322 | APBB1 | HCC1_Meng | Human | Liver | HCC | 2.77e-09 | -4.56e-02 | 0.0246 |
| 322 | APBB1 | S014 | Human | Liver | HCC | 1.44e-16 | 6.08e-01 | 0.2254 |
| 322 | APBB1 | S015 | Human | Liver | HCC | 6.33e-09 | 5.27e-01 | 0.2375 |
| 322 | APBB1 | S016 | Human | Liver | HCC | 4.40e-17 | 5.19e-01 | 0.2243 |
| Page: 1 |
| Tissue | Expression Dynamics | Abbreviation |
| Liver | 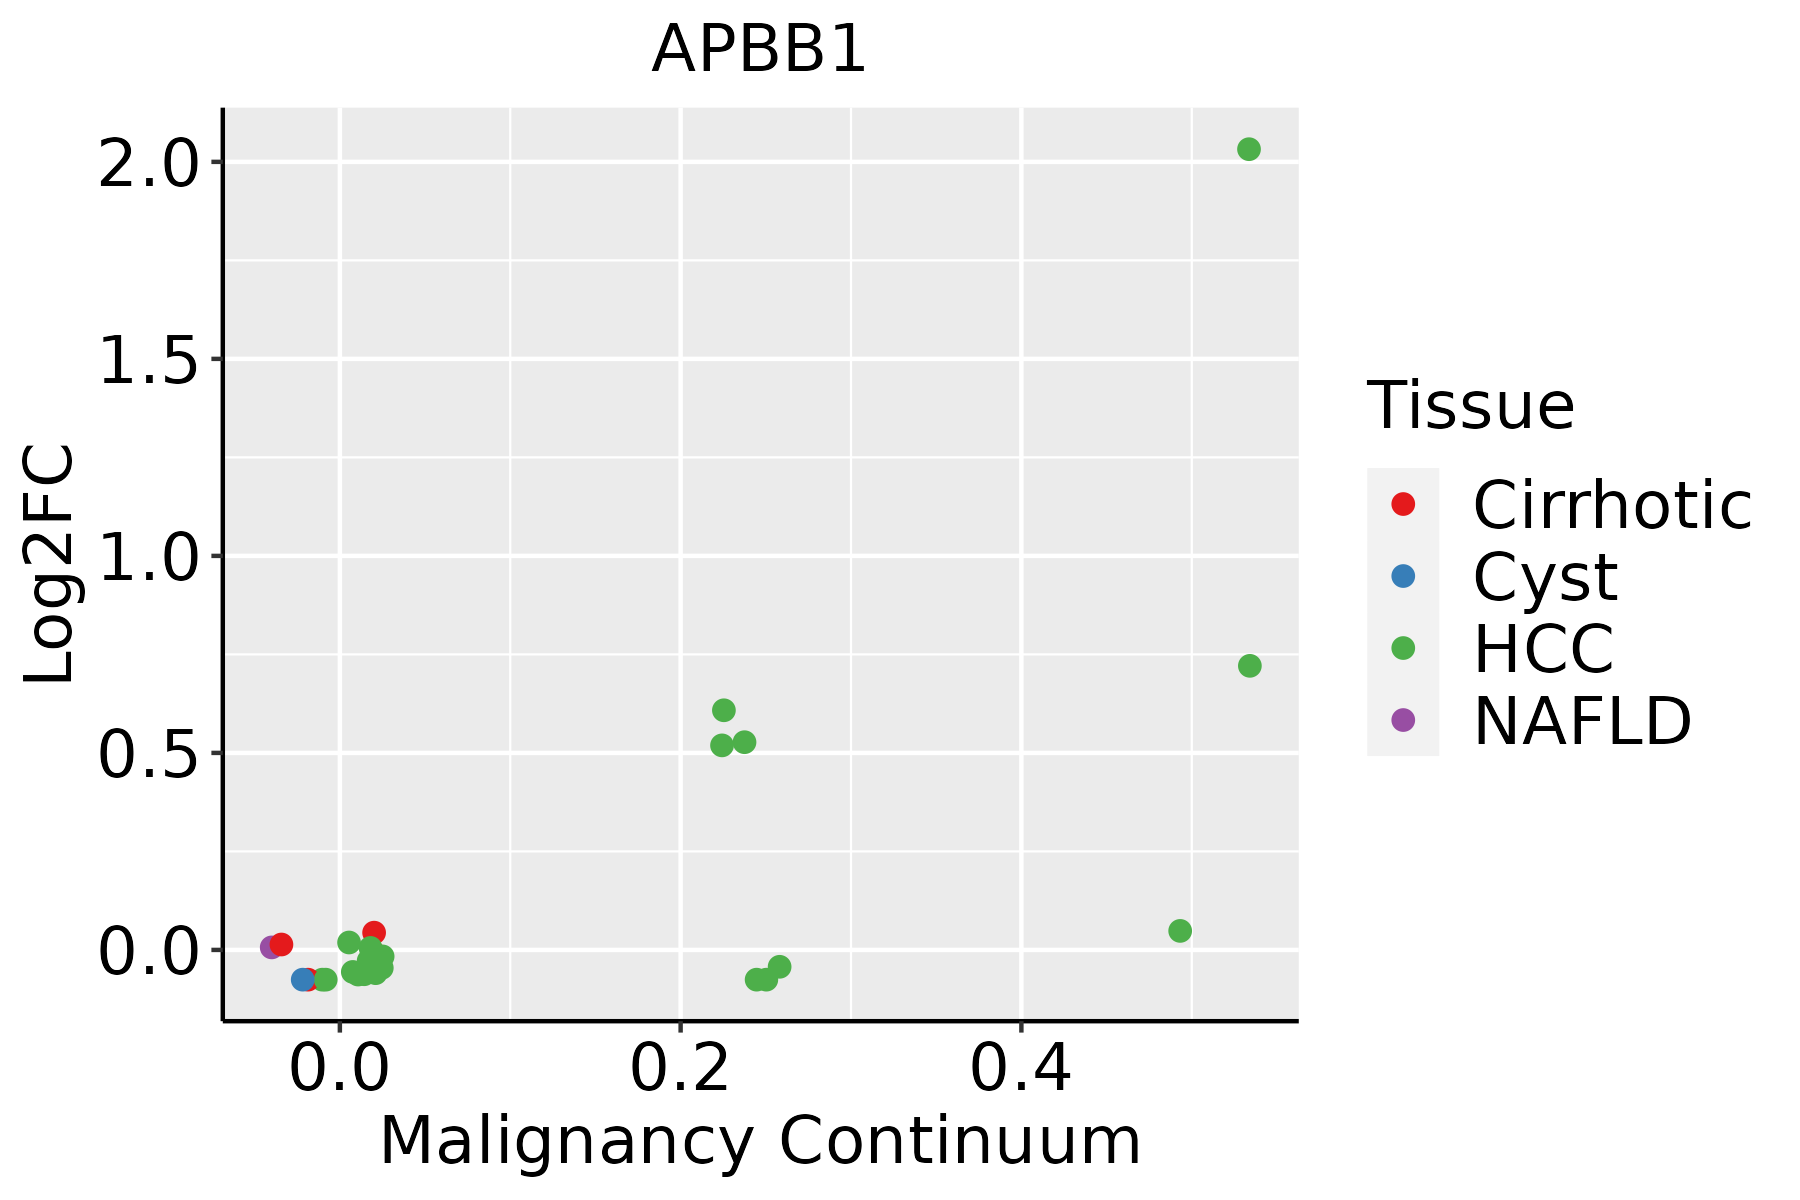 | HCC: Hepatocellular carcinoma |
| NAFLD: Non-alcoholic fatty liver disease |
| ∗log2FC in expression of this searched gene in stem-like cells from each diseased tissue sample relative to stem-like cells in normal samples in each tissue plotted against the malignancy continuum. Samples are colored based on if they are from different disease stage. |
Top |
Malignant transformation related pathway analysis |
| Find out the enriched GO biological processes and KEGG pathways involved in transition from healthy to precancer to cancer |
| Tissue | Disease Stage | Enriched GO biological Processes |
| Colorectum | AD |  |
| Colorectum | SER |  |
| Colorectum | MSS |  |
| Colorectum | MSI-H |  |
| Colorectum | FAP |  |
| ∗Top 15 enriched GO BP terms are showed in the bar plot of each disease state in each tissue. Each row represents a significant GO biological process which is colored according to the -log10(p.adjust). |
| Page: 1 2 3 4 5 6 7 8 9 |
| GO ID | Tissue | Disease Stage | Description | Gene Ratio | Bg Ratio | pvalue | p.adjust | Count |
| GO:200102211 | Liver | HCC | positive regulation of response to DNA damage stimulus | 64/7958 | 105/18723 | 1.03e-04 | 8.88e-04 | 64 |
| GO:1901988 | Liver | HCC | negative regulation of cell cycle phase transition | 132/7958 | 249/18723 | 4.97e-04 | 3.25e-03 | 132 |
| GO:00062824 | Liver | HCC | regulation of DNA repair | 74/7958 | 130/18723 | 6.27e-04 | 3.89e-03 | 74 |
| GO:0010948 | Liver | HCC | negative regulation of cell cycle process | 152/7958 | 294/18723 | 8.50e-04 | 5.08e-03 | 152 |
| GO:00063021 | Liver | HCC | double-strand break repair | 131/7958 | 251/18723 | 1.17e-03 | 6.54e-03 | 131 |
| GO:1902806 | Liver | HCC | regulation of cell cycle G1/S phase transition | 91/7958 | 168/18723 | 1.47e-03 | 7.79e-03 | 91 |
| GO:001097511 | Liver | HCC | regulation of neuron projection development | 220/7958 | 445/18723 | 1.68e-03 | 8.78e-03 | 220 |
| GO:0010976 | Liver | HCC | positive regulation of neuron projection development | 88/7958 | 163/18723 | 1.98e-03 | 1.00e-02 | 88 |
| GO:004578512 | Liver | HCC | positive regulation of cell adhesion | 215/7958 | 437/18723 | 2.53e-03 | 1.22e-02 | 215 |
| GO:00457393 | Liver | HCC | positive regulation of DNA repair | 43/7958 | 73/18723 | 3.43e-03 | 1.55e-02 | 43 |
| GO:003559212 | Liver | HCC | establishment of protein localization to extracellular region | 176/7958 | 360/18723 | 7.96e-03 | 3.15e-02 | 176 |
| GO:000930612 | Liver | HCC | protein secretion | 175/7958 | 359/18723 | 9.32e-03 | 3.57e-02 | 175 |
| Page: 1 2 |
| Pathway ID | Tissue | Disease Stage | Description | Gene Ratio | Bg Ratio | pvalue | p.adjust | qvalue | Count |
| hsa0501022 | Liver | HCC | Alzheimer disease | 254/4020 | 384/8465 | 3.75e-14 | 8.97e-13 | 4.99e-13 | 254 |
| hsa0501032 | Liver | HCC | Alzheimer disease | 254/4020 | 384/8465 | 3.75e-14 | 8.97e-13 | 4.99e-13 | 254 |
| Page: 1 |
Top |
Cell-cell communication analysis |
| Identification of potential cell-cell interactions between two cell types and their ligand-receptor pairs for different disease states |
| Ligand | Receptor | LRpair | Pathway | Tissue | Disease Stage |
| Page: 1 |
Top |
Single-cell gene regulatory network inference analysis |
| Find out the significant the regulons (TFs) and the target genes of each regulon across cell types for different disease states |
| TF | Cell Type | Tissue | Disease Stage | Target Gene | RSS | Regulon Activity |
| ∗The dot plots of a searched regulon are shown for all cell subpopulations in each disease state of each tissue based on the regulon specific score inferred using pySCENIC and by calculating the average expression. |
| Page: 1 |
Top |
Somatic mutation of malignant transformation related genes |
| Annotation of somatic variants for genes involved in malignant transformation |
| Hugo Symbol | Variant Class | Variant Classification | dbSNP RS | HGVSc | HGVSp | HGVSp Short | SWISSPROT | BIOTYPE | SIFT | PolyPhen | Tumor Sample Barcode | Tissue | Histology | Sex | Age | Stage | Therapy Types | Drugs | Outcome |
| APBB1 | SNV | Missense_Mutation | rs373569914 | c.1081N>T | p.Arg361Trp | p.R361W | O00213 | protein_coding | tolerated(0.18) | benign(0.442) | TCGA-A2-A3KD-01 | Breast | breast invasive carcinoma | Female | <65 | III/IV | Chemotherapy | taxotere | SD |
| APBB1 | SNV | Missense_Mutation | novel | c.1195N>T | p.Arg399Cys | p.R399C | O00213 | protein_coding | deleterious(0) | probably_damaging(0.979) | TCGA-AN-A046-01 | Breast | breast invasive carcinoma | Female | >=65 | I/II | Unknown | Unknown | SD |
| APBB1 | SNV | Missense_Mutation | rs144100830 | c.1757N>T | p.Ala586Val | p.A586V | O00213 | protein_coding | deleterious(0) | probably_damaging(0.998) | TCGA-C8-A26W-01 | Breast | breast invasive carcinoma | Female | <65 | I/II | Chemotherapy | doxorubicin | CR |
| APBB1 | insertion | Frame_Shift_Ins | novel | c.120_121insAGCTCTTGGCCCCGTGTTATGCTGCCGCCAATGCATA | p.Gln41SerfsTer33 | p.Q41Sfs*33 | O00213 | protein_coding | TCGA-BH-A0B8-01 | Breast | breast invasive carcinoma | Female | <65 | I/II | Hormone Therapy | arimidex | SD | ||
| APBB1 | SNV | Missense_Mutation | rs781050131 | c.1144N>A | p.Glu382Lys | p.E382K | O00213 | protein_coding | deleterious(0) | probably_damaging(0.992) | TCGA-2W-A8YY-01 | Cervix | cervical & endocervical cancer | Female | <65 | I/II | Chemotherapy | cisplatin | CR |
| APBB1 | SNV | Missense_Mutation | novel | c.863N>T | p.Pro288Leu | p.P288L | O00213 | protein_coding | tolerated(0.09) | benign(0) | TCGA-2W-A8YY-01 | Cervix | cervical & endocervical cancer | Female | <65 | I/II | Chemotherapy | cisplatin | CR |
| APBB1 | SNV | Missense_Mutation | rs781050131 | c.1144N>A | p.Glu382Lys | p.E382K | O00213 | protein_coding | deleterious(0) | probably_damaging(0.992) | TCGA-C5-A1BL-01 | Cervix | cervical & endocervical cancer | Female | <65 | I/II | Unknown | Unknown | SD |
| APBB1 | SNV | Missense_Mutation | rs766162217 | c.637C>T | p.Arg213Trp | p.R213W | O00213 | protein_coding | deleterious(0.01) | possibly_damaging(0.853) | TCGA-EA-A410-01 | Cervix | cervical & endocervical cancer | Female | <65 | I/II | Unknown | Unknown | SD |
| APBB1 | SNV | Missense_Mutation | c.1415N>C | p.Lys472Thr | p.K472T | O00213 | protein_coding | deleterious(0.01) | possibly_damaging(0.837) | TCGA-FU-A3HZ-01 | Cervix | cervical & endocervical cancer | Female | <65 | I/II | Chemotherapy | cisplatin | CR | |
| APBB1 | SNV | Missense_Mutation | rs766381978 | c.152N>A | p.Arg51His | p.R51H | O00213 | protein_coding | tolerated(0.14) | benign(0.018) | TCGA-ZJ-AAXT-01 | Cervix | cervical & endocervical cancer | Female | <65 | III/IV | Unknown | Unknown | SD |
| Page: 1 2 3 4 5 6 7 8 9 10 |
Top |
Related drugs of malignant transformation related genes |
| Identification of chemicals and drugs interact with genes involved in malignant transfromation |
| (DGIdb 4.0) |
| Entrez ID | Symbol | Category | Interaction Types | Drug Claim Name | Drug Name | PMIDs |
| 322 | APBB1 | ENZYME, TRANSCRIPTION FACTOR, TRANSCRIPTION FACTOR BINDING | Trimidox | TRIMETHOPRIM/SULFADOXINE | ||
| 322 | APBB1 | ENZYME, TRANSCRIPTION FACTOR, TRANSCRIPTION FACTOR BINDING | G-207 virus construct | |||
| 322 | APBB1 | ENZYME, TRANSCRIPTION FACTOR, TRANSCRIPTION FACTOR BINDING | Clofarabine | CLOFARABINE | ||
| 322 | APBB1 | ENZYME, TRANSCRIPTION FACTOR, TRANSCRIPTION FACTOR BINDING | COH29 | COH-29 |
| Page: 1 |

Copyright 2023-Present -The University of Texas Health Science Center at Houston |