
|
|||||
|
 | |
| |
| |
| |
| |
| |
|
Gene: AIMP2 |
Gene summary for AIMP2 |
| Gene information | Species | Human | Gene symbol | AIMP2 | Gene ID | 7965 |
| Gene name | aminoacyl tRNA synthetase complex interacting multifunctional protein 2 | |
| Gene Alias | HLD17 | |
| Cytomap | 7p22.1 | |
| Gene Type | protein-coding | GO ID | GO:0006412 | UniProtAcc | F8W950 |
Top |
Malignant transformation analysis |
| Identification of the aberrant gene expression in precancerous and cancerous lesions by comparing the gene expression of stem-like cells in diseased tissues with normal stem cells |
| Entrez ID | Symbol | Replicates | Species | Organ | Tissue | Adj P-value | Log2FC | Malignancy |
| 7965 | AIMP2 | LZE2T | Human | Esophagus | ESCC | 3.36e-02 | 6.21e-01 | 0.082 |
| 7965 | AIMP2 | LZE4T | Human | Esophagus | ESCC | 8.93e-12 | 4.24e-01 | 0.0811 |
| 7965 | AIMP2 | LZE5T | Human | Esophagus | ESCC | 2.27e-02 | 3.41e-01 | 0.0514 |
| 7965 | AIMP2 | LZE7T | Human | Esophagus | ESCC | 3.09e-07 | 4.17e-01 | 0.0667 |
| 7965 | AIMP2 | LZE8T | Human | Esophagus | ESCC | 2.09e-03 | 1.37e-01 | 0.067 |
| 7965 | AIMP2 | LZE20T | Human | Esophagus | ESCC | 3.14e-06 | 1.55e-01 | 0.0662 |
| 7965 | AIMP2 | LZE22D1 | Human | Esophagus | HGIN | 1.57e-02 | 1.08e-01 | 0.0595 |
| 7965 | AIMP2 | LZE22T | Human | Esophagus | ESCC | 3.55e-03 | 5.99e-01 | 0.068 |
| 7965 | AIMP2 | LZE24T | Human | Esophagus | ESCC | 3.15e-19 | 6.77e-01 | 0.0596 |
| 7965 | AIMP2 | LZE21T | Human | Esophagus | ESCC | 1.60e-05 | 4.92e-01 | 0.0655 |
| 7965 | AIMP2 | LZE6T | Human | Esophagus | ESCC | 7.57e-03 | 4.55e-01 | 0.0845 |
| 7965 | AIMP2 | P1T-E | Human | Esophagus | ESCC | 7.64e-17 | 8.70e-01 | 0.0875 |
| 7965 | AIMP2 | P2T-E | Human | Esophagus | ESCC | 8.24e-32 | 6.16e-01 | 0.1177 |
| 7965 | AIMP2 | P4T-E | Human | Esophagus | ESCC | 8.69e-41 | 1.22e+00 | 0.1323 |
| 7965 | AIMP2 | P5T-E | Human | Esophagus | ESCC | 3.41e-54 | 8.62e-01 | 0.1327 |
| 7965 | AIMP2 | P8T-E | Human | Esophagus | ESCC | 2.86e-23 | 4.58e-01 | 0.0889 |
| 7965 | AIMP2 | P9T-E | Human | Esophagus | ESCC | 1.92e-36 | 9.44e-01 | 0.1131 |
| 7965 | AIMP2 | P10T-E | Human | Esophagus | ESCC | 8.42e-33 | 5.66e-01 | 0.116 |
| 7965 | AIMP2 | P11T-E | Human | Esophagus | ESCC | 1.53e-17 | 8.37e-01 | 0.1426 |
| 7965 | AIMP2 | P12T-E | Human | Esophagus | ESCC | 1.04e-58 | 9.75e-01 | 0.1122 |
| Page: 1 2 3 4 5 6 |
| Tissue | Expression Dynamics | Abbreviation |
| Esophagus | 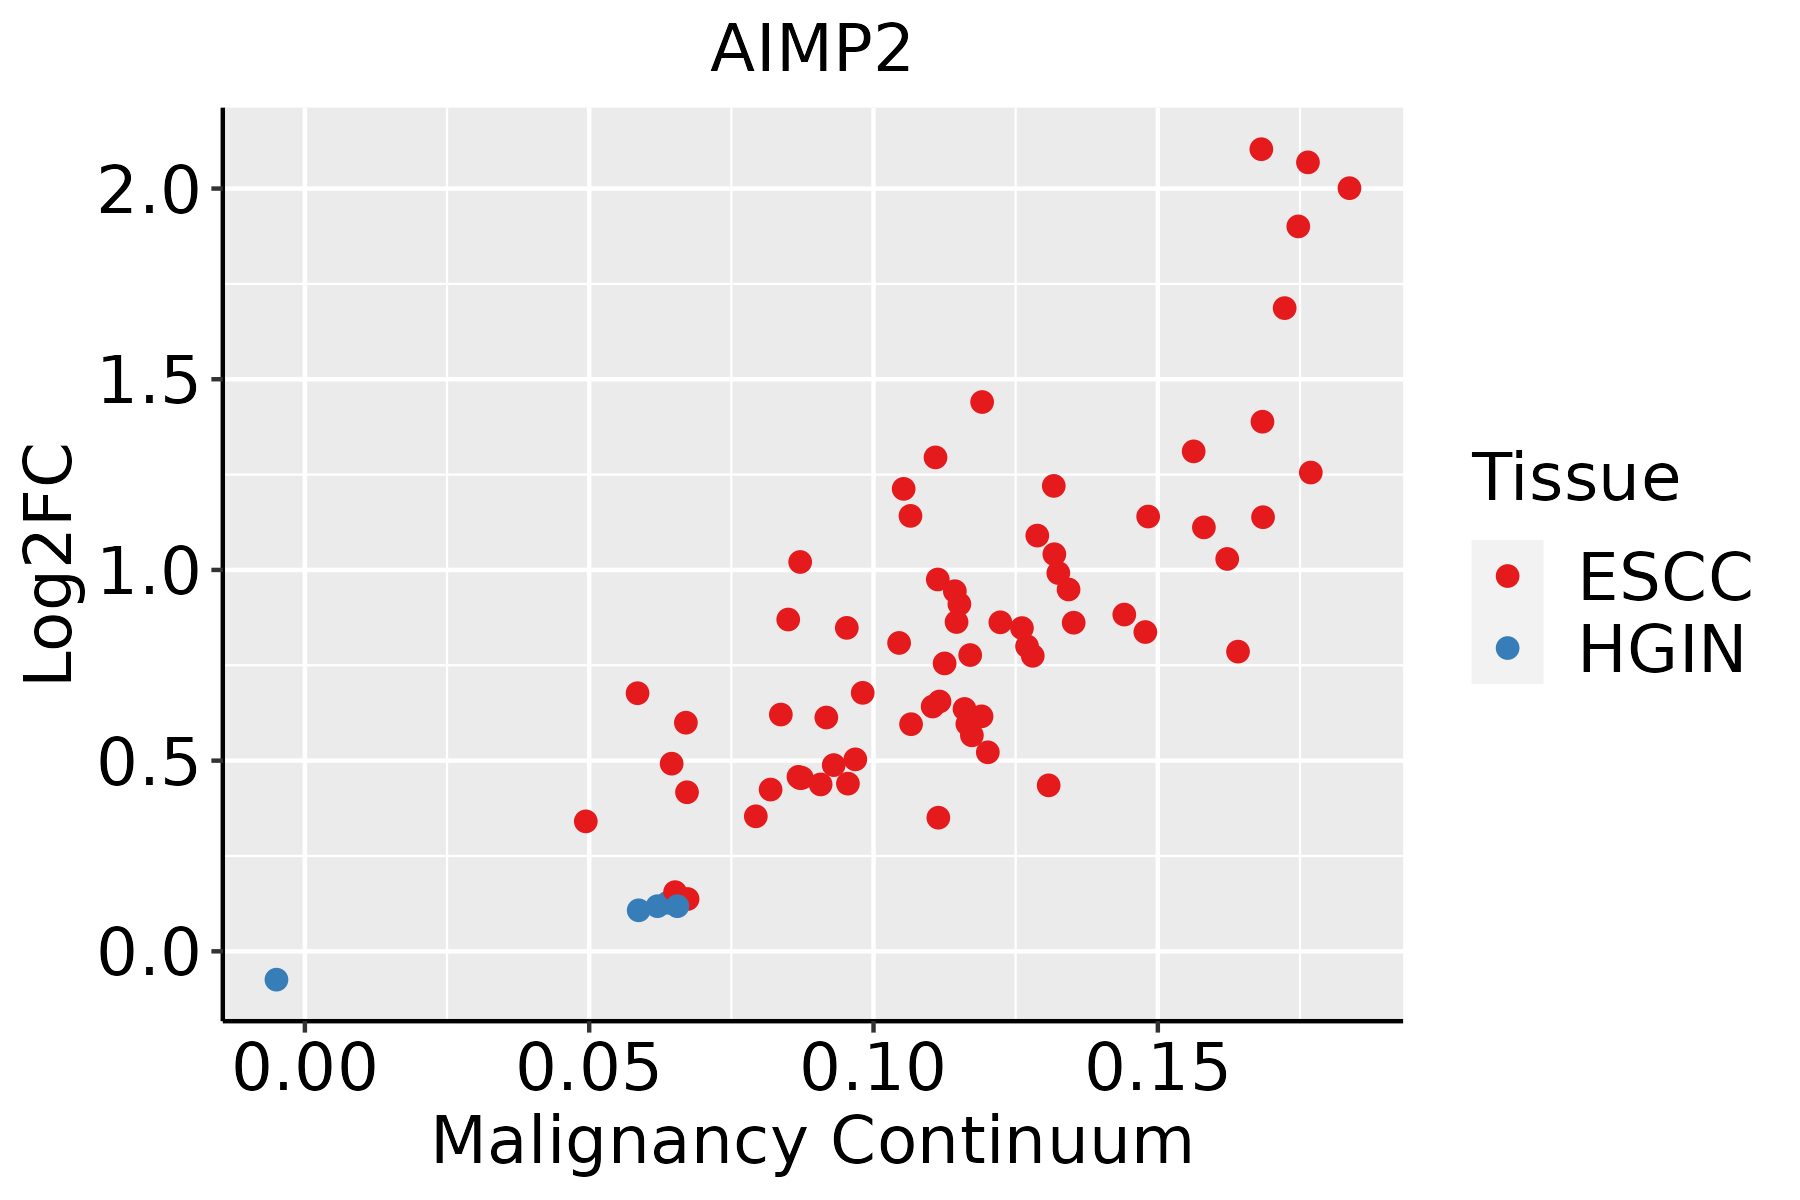 | ESCC: Esophageal squamous cell carcinoma |
| HGIN: High-grade intraepithelial neoplasias | ||
| LGIN: Low-grade intraepithelial neoplasias | ||
| Liver |  | HCC: Hepatocellular carcinoma |
| NAFLD: Non-alcoholic fatty liver disease | ||
| Oral Cavity |  | EOLP: Erosive Oral lichen planus |
| LP: leukoplakia | ||
| NEOLP: Non-erosive oral lichen planus | ||
| OSCC: Oral squamous cell carcinoma | ||
| Skin | 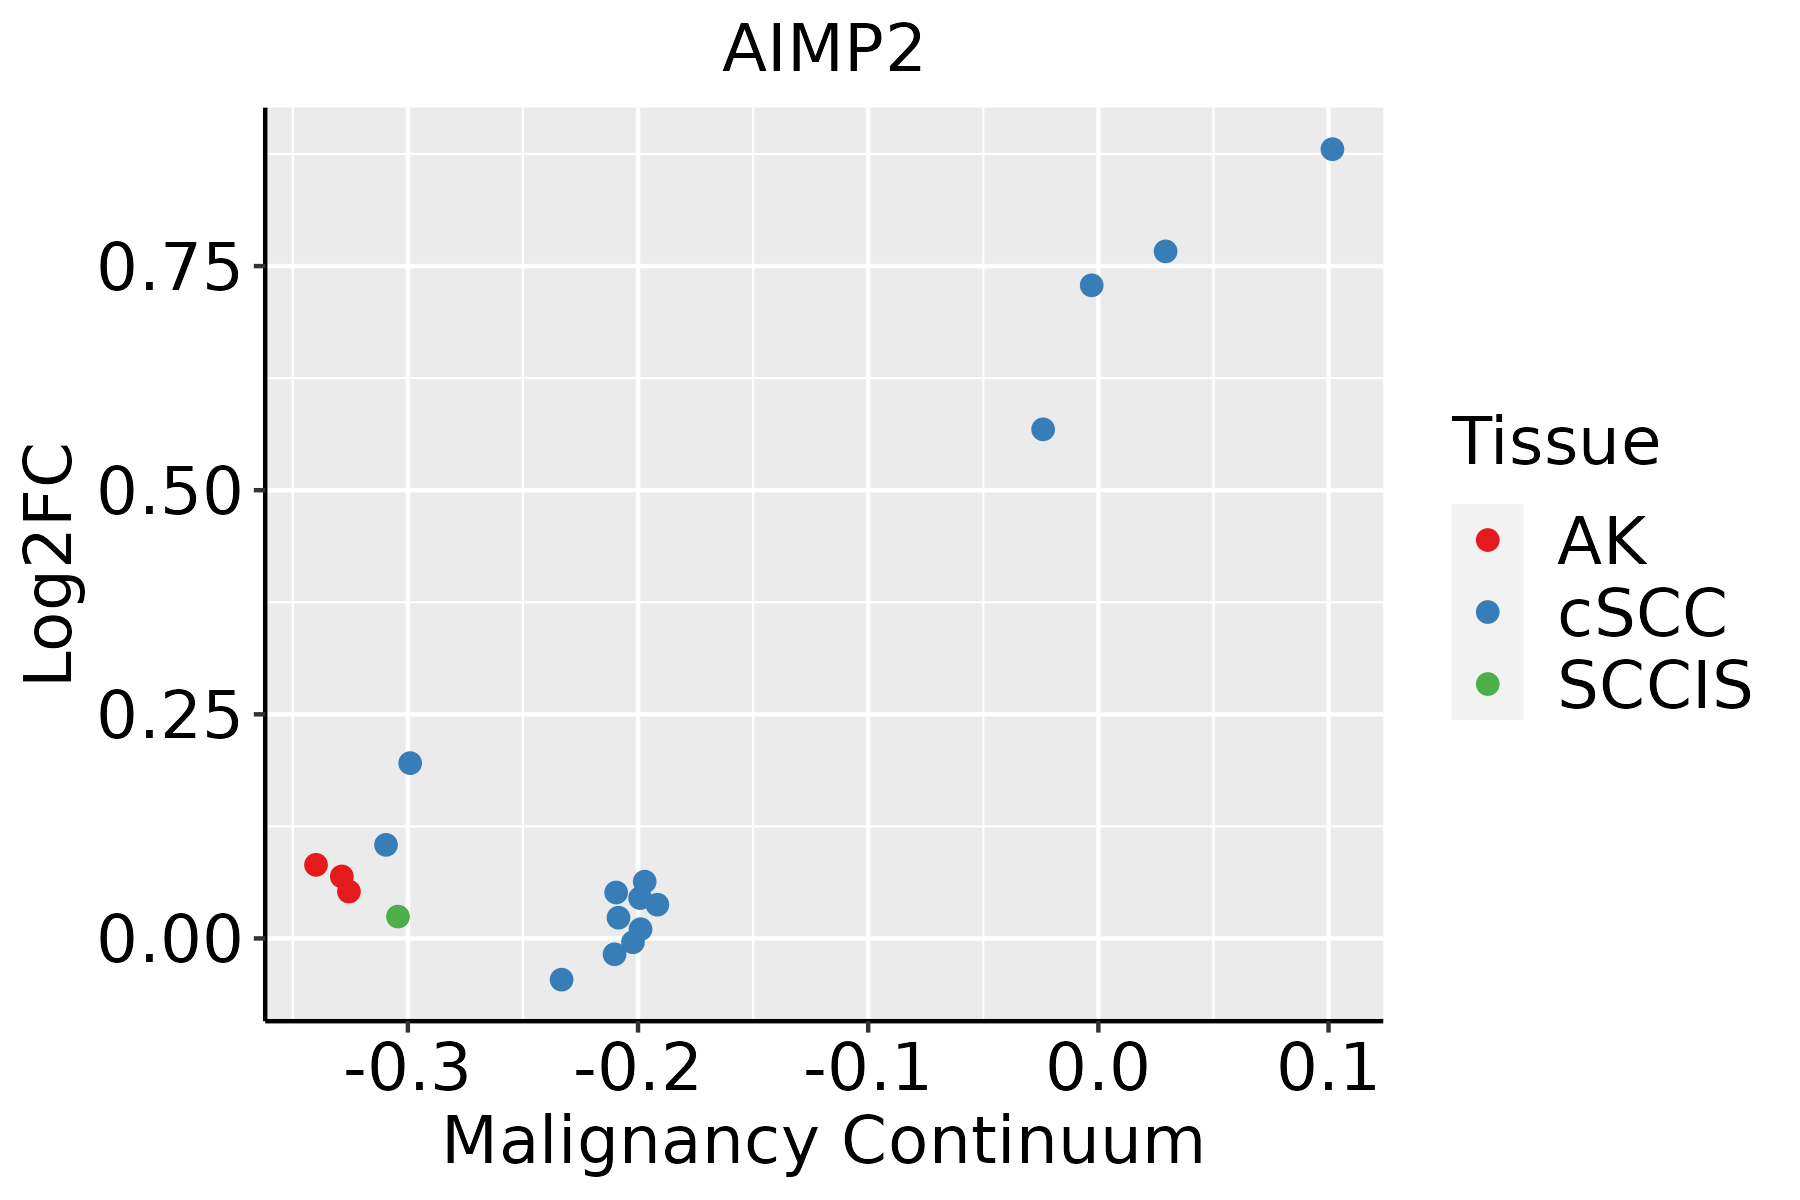 | AK: Actinic keratosis |
| cSCC: Cutaneous squamous cell carcinoma | ||
| SCCIS:squamous cell carcinoma in situ | ||
| Thyroid |  | ATC: Anaplastic thyroid cancer |
| HT: Hashimoto's thyroiditis | ||
| PTC: Papillary thyroid cancer |
| ∗log2FC in expression of this searched gene in stem-like cells from each diseased tissue sample relative to stem-like cells in normal samples in each tissue plotted against the malignancy continuum. Samples are colored based on if they are from different disease stage. |
Top |
Malignant transformation related pathway analysis |
| Find out the enriched GO biological processes and KEGG pathways involved in transition from healthy to precancer to cancer |
| Tissue | Disease Stage | Enriched GO biological Processes |
| Colorectum | AD |  |
| Colorectum | SER |  |
| Colorectum | MSS |  |
| Colorectum | MSI-H |  |
| Colorectum | FAP |  |
| ∗Top 15 enriched GO BP terms are showed in the bar plot of each disease state in each tissue. Each row represents a significant GO biological process which is colored according to the -log10(p.adjust). |
| Page: 1 2 3 4 5 6 7 8 9 |
| GO ID | Tissue | Disease Stage | Description | Gene Ratio | Bg Ratio | pvalue | p.adjust | Count |
| GO:00604872 | Esophagus | ESCC | lung epithelial cell differentiation | 17/8552 | 23/18723 | 5.73e-03 | 2.13e-02 | 17 |
| GO:190332012 | Liver | Cirrhotic | regulation of protein modification by small protein conjugation or removal | 105/4634 | 242/18723 | 1.43e-10 | 7.43e-09 | 105 |
| GO:007099712 | Liver | Cirrhotic | neuron death | 141/4634 | 361/18723 | 9.56e-10 | 4.38e-08 | 141 |
| GO:003139612 | Liver | Cirrhotic | regulation of protein ubiquitination | 89/4634 | 210/18723 | 1.40e-08 | 5.30e-07 | 89 |
| GO:19012147 | Liver | Cirrhotic | regulation of neuron death | 122/4634 | 319/18723 | 5.17e-08 | 1.62e-06 | 122 |
| GO:19012167 | Liver | Cirrhotic | positive regulation of neuron death | 41/4634 | 97/18723 | 1.13e-04 | 1.14e-03 | 41 |
| GO:00303242 | Liver | Cirrhotic | lung development | 65/4634 | 177/18723 | 2.49e-04 | 2.25e-03 | 65 |
| GO:00303232 | Liver | Cirrhotic | respiratory tube development | 66/4634 | 181/18723 | 2.82e-04 | 2.49e-03 | 66 |
| GO:19033222 | Liver | Cirrhotic | positive regulation of protein modification by small protein conjugation or removal | 52/4634 | 138/18723 | 4.91e-04 | 3.94e-03 | 52 |
| GO:0031398 | Liver | Cirrhotic | positive regulation of protein ubiquitination | 44/4634 | 119/18723 | 1.98e-03 | 1.23e-02 | 44 |
| GO:00605411 | Liver | Cirrhotic | respiratory system development | 67/4634 | 203/18723 | 4.81e-03 | 2.52e-02 | 67 |
| GO:190332022 | Liver | HCC | regulation of protein modification by small protein conjugation or removal | 167/7958 | 242/18723 | 4.99e-17 | 4.72e-15 | 167 |
| GO:003139622 | Liver | HCC | regulation of protein ubiquitination | 142/7958 | 210/18723 | 1.39e-13 | 7.81e-12 | 142 |
| GO:19033221 | Liver | HCC | positive regulation of protein modification by small protein conjugation or removal | 94/7958 | 138/18723 | 9.87e-10 | 3.01e-08 | 94 |
| GO:00313981 | Liver | HCC | positive regulation of protein ubiquitination | 79/7958 | 119/18723 | 1.18e-07 | 2.26e-06 | 79 |
| GO:007099722 | Liver | HCC | neuron death | 202/7958 | 361/18723 | 1.44e-07 | 2.70e-06 | 202 |
| GO:190121412 | Liver | HCC | regulation of neuron death | 179/7958 | 319/18723 | 5.65e-07 | 9.01e-06 | 179 |
| GO:190121612 | Liver | HCC | positive regulation of neuron death | 62/7958 | 97/18723 | 1.67e-05 | 1.81e-04 | 62 |
| GO:003032311 | Liver | HCC | respiratory tube development | 95/7958 | 181/18723 | 4.15e-03 | 1.81e-02 | 95 |
| GO:003032411 | Liver | HCC | lung development | 91/7958 | 177/18723 | 1.01e-02 | 3.80e-02 | 91 |
| Page: 1 2 3 4 5 |
| Pathway ID | Tissue | Disease Stage | Description | Gene Ratio | Bg Ratio | pvalue | p.adjust | qvalue | Count |
| Page: 1 |
Top |
Cell-cell communication analysis |
| Identification of potential cell-cell interactions between two cell types and their ligand-receptor pairs for different disease states |
| Ligand | Receptor | LRpair | Pathway | Tissue | Disease Stage |
| Page: 1 |
Top |
Single-cell gene regulatory network inference analysis |
| Find out the significant the regulons (TFs) and the target genes of each regulon across cell types for different disease states |
| TF | Cell Type | Tissue | Disease Stage | Target Gene | RSS | Regulon Activity |
| ∗The dot plots of a searched regulon are shown for all cell subpopulations in each disease state of each tissue based on the regulon specific score inferred using pySCENIC and by calculating the average expression. |
| Page: 1 |
Top |
Somatic mutation of malignant transformation related genes |
| Annotation of somatic variants for genes involved in malignant transformation |
| Hugo Symbol | Variant Class | Variant Classification | dbSNP RS | HGVSc | HGVSp | HGVSp Short | SWISSPROT | BIOTYPE | SIFT | PolyPhen | Tumor Sample Barcode | Tissue | Histology | Sex | Age | Stage | Therapy Types | Drugs | Outcome |
| AIMP2 | SNV | Missense_Mutation | novel | c.170C>T | p.Ser57Phe | p.S57F | Q13155 | protein_coding | tolerated(0.11) | benign(0.307) | TCGA-AN-A046-01 | Breast | breast invasive carcinoma | Female | >=65 | I/II | Unknown | Unknown | SD |
| AIMP2 | SNV | Missense_Mutation | novel | c.392C>T | p.Pro131Leu | p.P131L | Q13155 | protein_coding | deleterious(0.01) | probably_damaging(0.938) | TCGA-2W-A8YY-01 | Cervix | cervical & endocervical cancer | Female | <65 | I/II | Chemotherapy | cisplatin | CR |
| AIMP2 | SNV | Missense_Mutation | rs368275022 | c.154N>G | p.Leu52Val | p.L52V | Q13155 | protein_coding | tolerated(0.55) | benign(0.056) | TCGA-C5-A1BQ-01 | Cervix | cervical & endocervical cancer | Female | >=65 | III/IV | Chemotherapy | cisplatin | CR |
| AIMP2 | SNV | Missense_Mutation | c.241C>G | p.Gln81Glu | p.Q81E | Q13155 | protein_coding | tolerated(0.13) | benign(0.073) | TCGA-C5-A1MK-01 | Cervix | cervical & endocervical cancer | Female | >=65 | III/IV | Chemotherapy | carboplatin | PD | |
| AIMP2 | SNV | Missense_Mutation | rs368275022 | c.154C>G | p.Leu52Val | p.L52V | Q13155 | protein_coding | tolerated(0.55) | benign(0.056) | TCGA-C5-A3HL-01 | Cervix | cervical & endocervical cancer | Female | >=65 | I/II | Unknown | Unknown | SD |
| AIMP2 | SNV | Missense_Mutation | rs764368950 | c.365N>C | p.Ile122Thr | p.I122T | Q13155 | protein_coding | deleterious(0) | possibly_damaging(0.858) | TCGA-AA-3715-01 | Colorectum | colon adenocarcinoma | Male | >=65 | I/II | Unknown | Unknown | PD |
| AIMP2 | SNV | Missense_Mutation | rs75895975 | c.461N>T | p.Thr154Met | p.T154M | Q13155 | protein_coding | tolerated(0.14) | benign(0.237) | TCGA-AA-3715-01 | Colorectum | colon adenocarcinoma | Male | >=65 | I/II | Unknown | Unknown | PD |
| AIMP2 | SNV | Missense_Mutation | rs764843355 | c.457N>T | p.His153Tyr | p.H153Y | Q13155 | protein_coding | tolerated(0.05) | probably_damaging(0.999) | TCGA-CM-4743-01 | Colorectum | colon adenocarcinoma | Male | >=65 | I/II | Chemotherapy | capecitabine | SD |
| AIMP2 | SNV | Missense_Mutation | rs747974072 | c.383N>T | p.Pro128Leu | p.P128L | Q13155 | protein_coding | deleterious(0) | probably_damaging(1) | TCGA-DM-A1HA-01 | Colorectum | colon adenocarcinoma | Male | >=65 | III/IV | Unknown | Unknown | SD |
| AIMP2 | SNV | Missense_Mutation | c.542N>T | p.Tyr181Phe | p.Y181F | Q13155 | protein_coding | tolerated(0.53) | benign(0.006) | TCGA-DM-A1HB-01 | Colorectum | colon adenocarcinoma | Male | >=65 | III/IV | Unknown | Unknown | SD |
| Page: 1 2 3 4 5 |
Top |
Related drugs of malignant transformation related genes |
| Identification of chemicals and drugs interact with genes involved in malignant transfromation |
| (DGIdb 4.0) |
| Entrez ID | Symbol | Category | Interaction Types | Drug Claim Name | Drug Name | PMIDs |
| Page: 1 |

Copyright 2023-Present -The University of Texas Health Science Center at Houston |