
|
|||||
|
 | |
| |
| |
| |
| |
| |
|
Gene: ACAA2 |
Gene summary for ACAA2 |
| Gene information | Species | Human | Gene symbol | ACAA2 | Gene ID | 10449 |
| Gene name | acetyl-CoA acyltransferase 2 | |
| Gene Alias | DSAEC | |
| Cytomap | 18q21.1 | |
| Gene Type | protein-coding | GO ID | GO:0001666 | UniProtAcc | B3KNP8 |
Top |
Malignant transformation analysis |
| Identification of the aberrant gene expression in precancerous and cancerous lesions by comparing the gene expression of stem-like cells in diseased tissues with normal stem cells |
| Entrez ID | Symbol | Replicates | Species | Organ | Tissue | Adj P-value | Log2FC | Malignancy |
| 10449 | ACAA2 | HTA11_3410_2000001011 | Human | Colorectum | AD | 5.46e-03 | 2.07e-01 | 0.0155 |
| 10449 | ACAA2 | HTA11_2487_2000001011 | Human | Colorectum | SER | 5.99e-13 | 6.37e-01 | -0.1808 |
| 10449 | ACAA2 | HTA11_1938_2000001011 | Human | Colorectum | AD | 6.30e-11 | 6.39e-01 | -0.0811 |
| 10449 | ACAA2 | HTA11_78_2000001011 | Human | Colorectum | AD | 1.88e-05 | 5.01e-01 | -0.1088 |
| 10449 | ACAA2 | HTA11_347_2000001011 | Human | Colorectum | AD | 3.30e-32 | 8.03e-01 | -0.1954 |
| 10449 | ACAA2 | HTA11_3361_2000001011 | Human | Colorectum | AD | 2.85e-03 | 3.71e-01 | -0.1207 |
| 10449 | ACAA2 | HTA11_83_2000001011 | Human | Colorectum | SER | 1.83e-08 | 5.75e-01 | -0.1526 |
| 10449 | ACAA2 | HTA11_696_2000001011 | Human | Colorectum | AD | 5.36e-06 | 3.87e-01 | -0.1464 |
| 10449 | ACAA2 | HTA11_866_2000001011 | Human | Colorectum | AD | 1.06e-06 | 4.10e-01 | -0.1001 |
| 10449 | ACAA2 | HTA11_1391_2000001011 | Human | Colorectum | AD | 1.67e-15 | 7.09e-01 | -0.059 |
| 10449 | ACAA2 | HTA11_2992_2000001011 | Human | Colorectum | SER | 5.06e-04 | 6.26e-01 | -0.1706 |
| 10449 | ACAA2 | HTA11_5212_2000001011 | Human | Colorectum | AD | 4.52e-12 | 7.53e-01 | -0.2061 |
| 10449 | ACAA2 | HTA11_5216_2000001011 | Human | Colorectum | SER | 2.27e-03 | 5.34e-01 | -0.1462 |
| 10449 | ACAA2 | HTA11_546_2000001011 | Human | Colorectum | AD | 3.85e-03 | 3.66e-01 | -0.0842 |
| 10449 | ACAA2 | HTA11_866_3004761011 | Human | Colorectum | AD | 7.19e-06 | 3.04e-01 | 0.096 |
| 10449 | ACAA2 | HTA11_7663_2000001011 | Human | Colorectum | SER | 2.24e-03 | 4.86e-01 | 0.0131 |
| 10449 | ACAA2 | HTA11_10623_2000001011 | Human | Colorectum | AD | 4.89e-02 | 3.46e-01 | -0.0177 |
| 10449 | ACAA2 | HTA11_7696_3000711011 | Human | Colorectum | AD | 1.56e-06 | 3.35e-01 | 0.0674 |
| 10449 | ACAA2 | HTA11_7469_2000001011 | Human | Colorectum | AD | 6.98e-04 | 5.65e-01 | -0.0124 |
| 10449 | ACAA2 | HTA11_99999970781_79442 | Human | Colorectum | MSS | 2.74e-03 | 3.50e-01 | 0.294 |
| Page: 1 2 3 4 5 6 |
| Tissue | Expression Dynamics | Abbreviation |
| Colorectum (GSE201348) |  | FAP: Familial adenomatous polyposis |
| CRC: Colorectal cancer | ||
| Colorectum (HTA11) |  | AD: Adenomas |
| SER: Sessile serrated lesions | ||
| MSI-H: Microsatellite-high colorectal cancer | ||
| MSS: Microsatellite stable colorectal cancer | ||
| Esophagus | 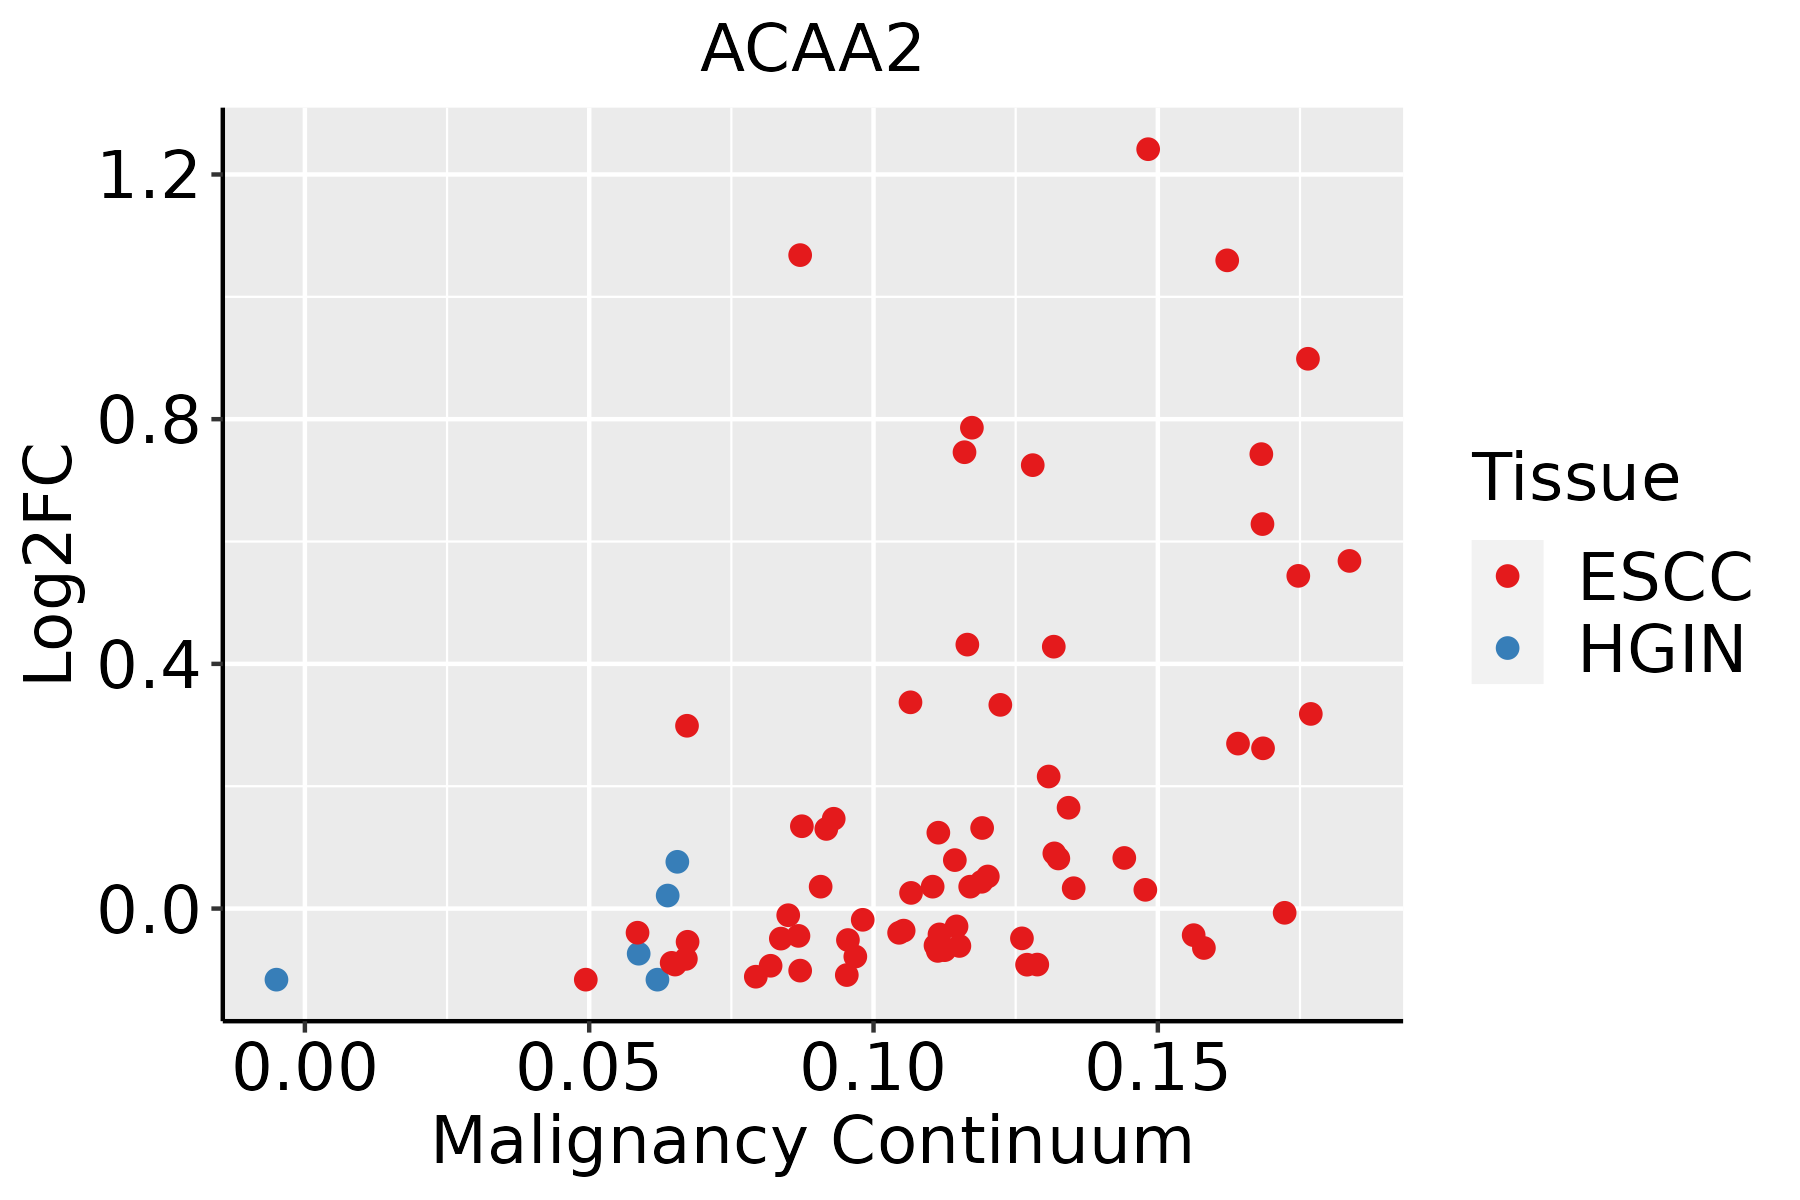 | ESCC: Esophageal squamous cell carcinoma |
| HGIN: High-grade intraepithelial neoplasias | ||
| LGIN: Low-grade intraepithelial neoplasias | ||
| GC |  | CAG: Chronic atrophic gastritis |
| CAG with IM: Chronic atrophic gastritis with intestinal metaplasia | ||
| CSG: Chronic superficial gastritis | ||
| GC: Gastric cancer | ||
| SIM: Severe intestinal metaplasia | ||
| WIM: Wild intestinal metaplasia | ||
| Liver | 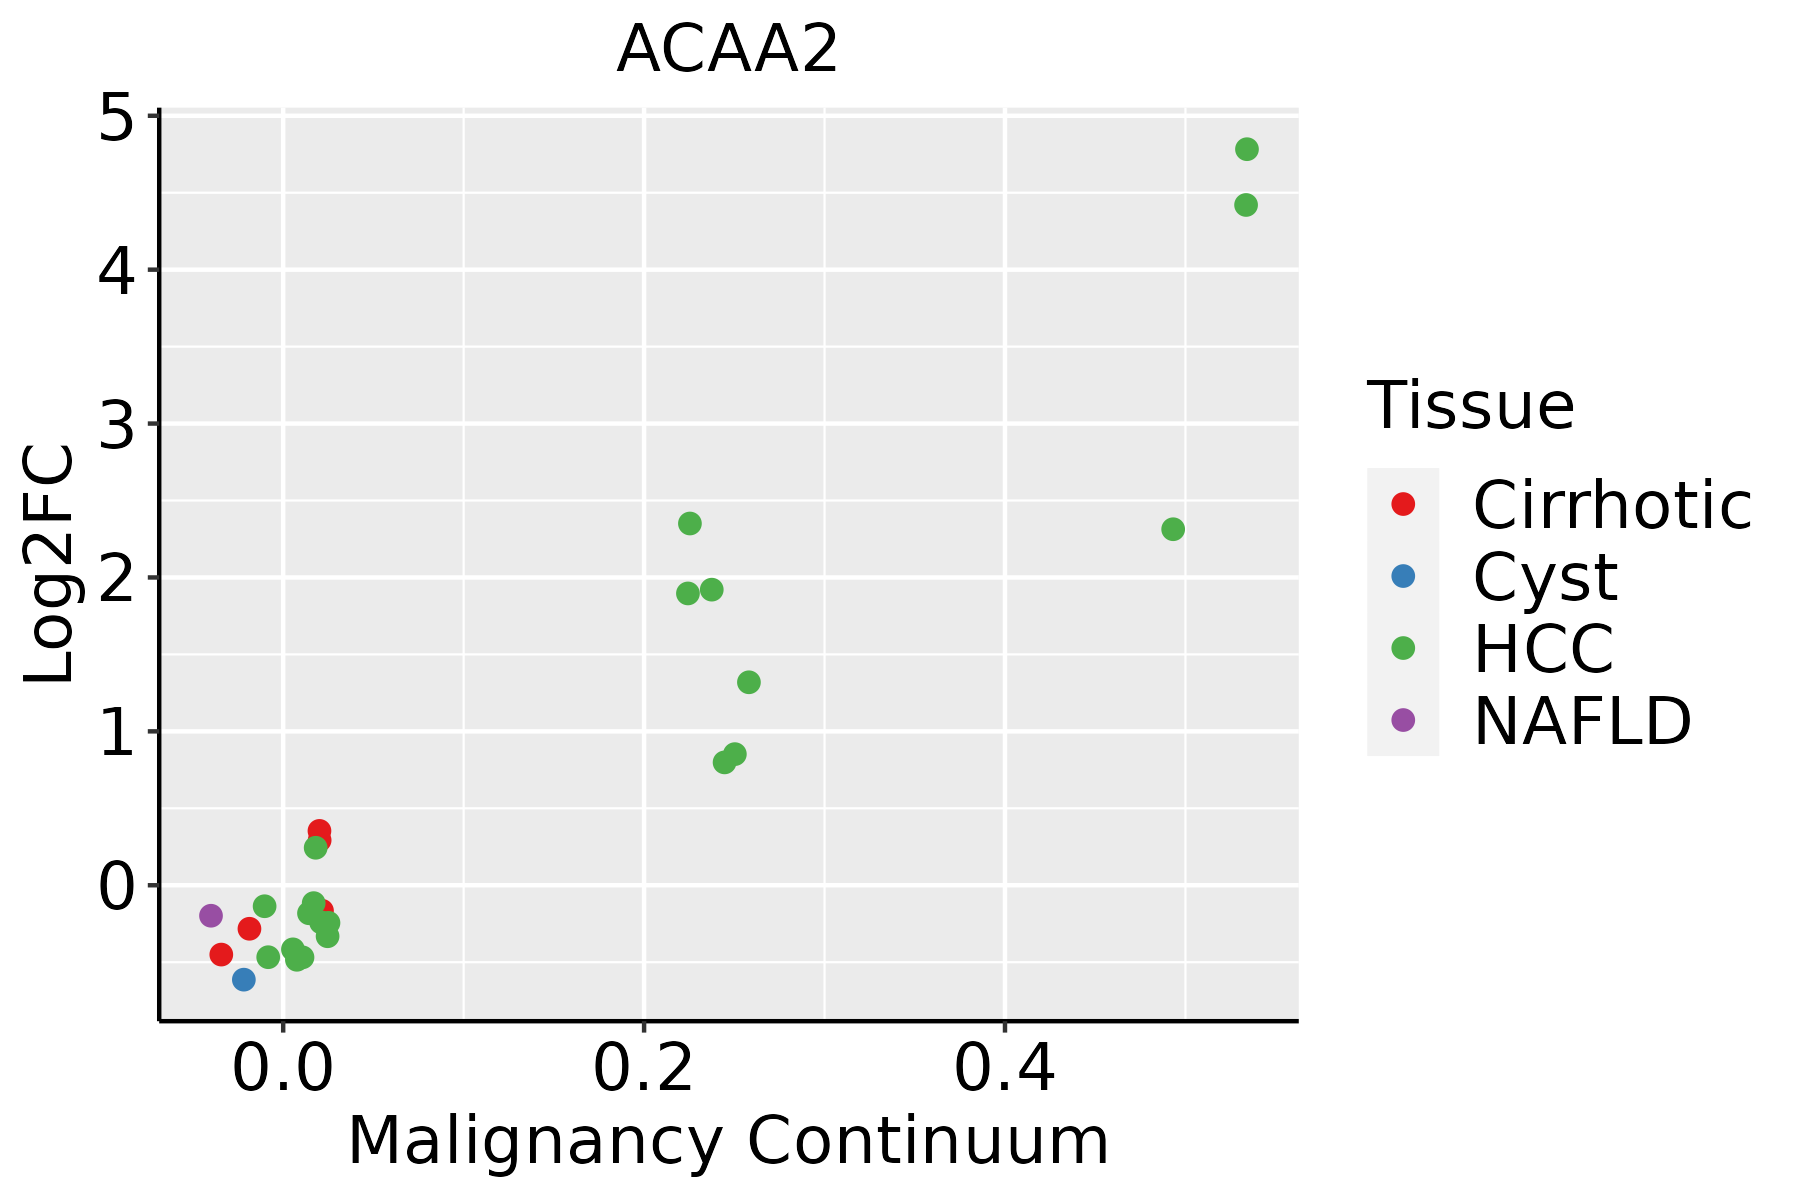 | HCC: Hepatocellular carcinoma |
| NAFLD: Non-alcoholic fatty liver disease | ||
| Thyroid |  | ATC: Anaplastic thyroid cancer |
| HT: Hashimoto's thyroiditis | ||
| PTC: Papillary thyroid cancer |
| ∗log2FC in expression of this searched gene in stem-like cells from each diseased tissue sample relative to stem-like cells in normal samples in each tissue plotted against the malignancy continuum. Samples are colored based on if they are from different disease stage. |
Top |
Malignant transformation related pathway analysis |
| Find out the enriched GO biological processes and KEGG pathways involved in transition from healthy to precancer to cancer |
| Tissue | Disease Stage | Enriched GO biological Processes |
| Colorectum | AD |  |
| Colorectum | SER |  |
| Colorectum | MSS |  |
| Colorectum | MSI-H |  |
| Colorectum | FAP |  |
| ∗Top 15 enriched GO BP terms are showed in the bar plot of each disease state in each tissue. Each row represents a significant GO biological process which is colored according to the -log10(p.adjust). |
| Page: 1 2 3 4 5 6 7 8 9 |
| GO ID | Tissue | Disease Stage | Description | Gene Ratio | Bg Ratio | pvalue | p.adjust | Count |
| GO:0070482 | Colorectum | AD | response to oxygen levels | 99/3918 | 347/18723 | 4.29e-04 | 4.82e-03 | 99 |
| GO:0046395 | Colorectum | AD | carboxylic acid catabolic process | 70/3918 | 236/18723 | 9.06e-04 | 8.71e-03 | 70 |
| GO:0071453 | Colorectum | AD | cellular response to oxygen levels | 55/3918 | 177/18723 | 9.48e-04 | 8.96e-03 | 55 |
| GO:0046902 | Colorectum | AD | regulation of mitochondrial membrane permeability | 24/3918 | 63/18723 | 1.34e-03 | 1.17e-02 | 24 |
| GO:0001666 | Colorectum | AD | response to hypoxia | 86/3918 | 307/18723 | 1.77e-03 | 1.46e-02 | 86 |
| GO:0036293 | Colorectum | AD | response to decreased oxygen levels | 88/3918 | 322/18723 | 3.42e-03 | 2.49e-02 | 88 |
| GO:0010823 | Colorectum | AD | negative regulation of mitochondrion organization | 18/3918 | 49/18723 | 7.93e-03 | 4.73e-02 | 18 |
| GO:0008202 | Colorectum | AD | steroid metabolic process | 85/3918 | 319/18723 | 8.07e-03 | 4.75e-02 | 85 |
| GO:00068391 | Colorectum | SER | mitochondrial transport | 87/2897 | 254/18723 | 7.91e-14 | 3.03e-11 | 87 |
| GO:20012331 | Colorectum | SER | regulation of apoptotic signaling pathway | 101/2897 | 356/18723 | 3.05e-10 | 4.07e-08 | 101 |
| GO:00108211 | Colorectum | SER | regulation of mitochondrion organization | 48/2897 | 144/18723 | 7.51e-08 | 4.70e-06 | 48 |
| GO:00106391 | Colorectum | SER | negative regulation of organelle organization | 90/2897 | 348/18723 | 3.14e-07 | 1.69e-05 | 90 |
| GO:20012341 | Colorectum | SER | negative regulation of apoptotic signaling pathway | 64/2897 | 224/18723 | 3.98e-07 | 2.06e-05 | 64 |
| GO:00070061 | Colorectum | SER | mitochondrial membrane organization | 38/2897 | 116/18723 | 2.66e-06 | 1.10e-04 | 38 |
| GO:00086371 | Colorectum | SER | apoptotic mitochondrial changes | 35/2897 | 107/18723 | 6.75e-06 | 2.35e-04 | 35 |
| GO:00160421 | Colorectum | SER | lipid catabolic process | 77/2897 | 320/18723 | 3.52e-05 | 9.18e-04 | 77 |
| GO:00442821 | Colorectum | SER | small molecule catabolic process | 87/2897 | 376/18723 | 5.31e-05 | 1.27e-03 | 87 |
| GO:00090621 | Colorectum | SER | fatty acid catabolic process | 31/2897 | 100/18723 | 7.09e-05 | 1.61e-03 | 31 |
| GO:00704821 | Colorectum | SER | response to oxygen levels | 79/2897 | 347/18723 | 1.99e-04 | 3.64e-03 | 79 |
| GO:00066351 | Colorectum | SER | fatty acid beta-oxidation | 24/2897 | 74/18723 | 2.09e-04 | 3.77e-03 | 24 |
| Page: 1 2 3 4 5 6 7 8 9 10 11 12 13 14 15 16 17 |
| Pathway ID | Tissue | Disease Stage | Description | Gene Ratio | Bg Ratio | pvalue | p.adjust | qvalue | Count |
| hsa012129 | Esophagus | ESCC | Fatty acid metabolism | 41/4205 | 57/8465 | 5.13e-04 | 1.75e-03 | 8.98e-04 | 41 |
| hsa0121214 | Esophagus | ESCC | Fatty acid metabolism | 41/4205 | 57/8465 | 5.13e-04 | 1.75e-03 | 8.98e-04 | 41 |
| hsa0028021 | Liver | Cirrhotic | Valine, leucine and isoleucine degradation | 32/2530 | 48/8465 | 1.45e-07 | 2.02e-06 | 1.24e-06 | 32 |
| hsa0007121 | Liver | Cirrhotic | Fatty acid degradation | 29/2530 | 43/8465 | 3.87e-07 | 4.95e-06 | 3.05e-06 | 29 |
| hsa012122 | Liver | Cirrhotic | Fatty acid metabolism | 32/2530 | 57/8465 | 3.12e-05 | 2.47e-04 | 1.52e-04 | 32 |
| hsa0028031 | Liver | Cirrhotic | Valine, leucine and isoleucine degradation | 32/2530 | 48/8465 | 1.45e-07 | 2.02e-06 | 1.24e-06 | 32 |
| hsa0007131 | Liver | Cirrhotic | Fatty acid degradation | 29/2530 | 43/8465 | 3.87e-07 | 4.95e-06 | 3.05e-06 | 29 |
| hsa012123 | Liver | Cirrhotic | Fatty acid metabolism | 32/2530 | 57/8465 | 3.12e-05 | 2.47e-04 | 1.52e-04 | 32 |
| hsa0028041 | Liver | HCC | Valine, leucine and isoleucine degradation | 41/4020 | 48/8465 | 4.84e-08 | 7.05e-07 | 3.92e-07 | 41 |
| hsa012124 | Liver | HCC | Fatty acid metabolism | 45/4020 | 57/8465 | 1.05e-06 | 1.10e-05 | 6.09e-06 | 45 |
| hsa0007141 | Liver | HCC | Fatty acid degradation | 33/4020 | 43/8465 | 8.41e-05 | 4.27e-04 | 2.37e-04 | 33 |
| hsa0028051 | Liver | HCC | Valine, leucine and isoleucine degradation | 41/4020 | 48/8465 | 4.84e-08 | 7.05e-07 | 3.92e-07 | 41 |
| hsa012125 | Liver | HCC | Fatty acid metabolism | 45/4020 | 57/8465 | 1.05e-06 | 1.10e-05 | 6.09e-06 | 45 |
| hsa0007151 | Liver | HCC | Fatty acid degradation | 33/4020 | 43/8465 | 8.41e-05 | 4.27e-04 | 2.37e-04 | 33 |
| Page: 1 |
Top |
Cell-cell communication analysis |
| Identification of potential cell-cell interactions between two cell types and their ligand-receptor pairs for different disease states |
| Ligand | Receptor | LRpair | Pathway | Tissue | Disease Stage |
| Page: 1 |
Top |
Single-cell gene regulatory network inference analysis |
| Find out the significant the regulons (TFs) and the target genes of each regulon across cell types for different disease states |
| TF | Cell Type | Tissue | Disease Stage | Target Gene | RSS | Regulon Activity |
| ∗The dot plots of a searched regulon are shown for all cell subpopulations in each disease state of each tissue based on the regulon specific score inferred using pySCENIC and by calculating the average expression. |
| Page: 1 |
Top |
Somatic mutation of malignant transformation related genes |
| Annotation of somatic variants for genes involved in malignant transformation |
| Hugo Symbol | Variant Class | Variant Classification | dbSNP RS | HGVSc | HGVSp | HGVSp Short | SWISSPROT | BIOTYPE | SIFT | PolyPhen | Tumor Sample Barcode | Tissue | Histology | Sex | Age | Stage | Therapy Types | Drugs | Outcome |
| ACAA2 | SNV | Missense_Mutation | c.807N>C | p.Lys269Asn | p.K269N | P42765 | protein_coding | tolerated(0.15) | benign(0.007) | TCGA-BH-A0C0-01 | Breast | breast invasive carcinoma | Female | <65 | I/II | Chemotherapy | carboplatin | SD | |
| ACAA2 | SNV | Missense_Mutation | c.41G>T | p.Arg14Leu | p.R14L | P42765 | protein_coding | deleterious(0) | probably_damaging(0.999) | TCGA-E2-A15M-01 | Breast | breast invasive carcinoma | Female | >=65 | I/II | Hormone Therapy | arimidex | SD | |
| ACAA2 | SNV | Missense_Mutation | c.1027N>A | p.Val343Met | p.V343M | P42765 | protein_coding | deleterious(0.05) | benign(0.257) | TCGA-EW-A1PB-01 | Breast | breast invasive carcinoma | Female | >=65 | III/IV | Unknown | Unknown | SD | |
| ACAA2 | SNV | Missense_Mutation | novel | c.17N>C | p.Gly6Ala | p.G6A | P42765 | protein_coding | tolerated(0.17) | benign(0.168) | TCGA-VS-A9U5-01 | Cervix | cervical & endocervical cancer | Female | <65 | I/II | Chemotherapy | cisplatin | CR |
| ACAA2 | SNV | Missense_Mutation | c.896N>T | p.Ala299Val | p.A299V | P42765 | protein_coding | deleterious(0) | probably_damaging(0.998) | TCGA-G4-6628-01 | Colorectum | colon adenocarcinoma | Male | >=65 | I/II | Unknown | Unknown | SD | |
| ACAA2 | SNV | Missense_Mutation | rs745865904 | c.1102N>A | p.Glu368Lys | p.E368K | P42765 | protein_coding | deleterious(0.02) | possibly_damaging(0.477) | TCGA-F5-6813-01 | Colorectum | rectum adenocarcinoma | Male | >=65 | III/IV | Unknown | Unknown | PD |
| ACAA2 | SNV | Missense_Mutation | novel | c.633N>T | p.Lys211Asn | p.K211N | P42765 | protein_coding | deleterious(0) | possibly_damaging(0.846) | TCGA-AJ-A3EK-01 | Endometrium | uterine corpus endometrioid carcinoma | Female | <65 | I/II | Chemotherapy | carboplatin | CR |
| ACAA2 | SNV | Missense_Mutation | novel | c.800C>A | p.Ala267Asp | p.A267D | P42765 | protein_coding | tolerated(0.09) | possibly_damaging(0.866) | TCGA-AP-A0LM-01 | Endometrium | uterine corpus endometrioid carcinoma | Female | <65 | III/IV | Chemotherapy | cisplatin | SD |
| ACAA2 | SNV | Missense_Mutation | novel | c.317T>A | p.Ile106Asn | p.I106N | P42765 | protein_coding | deleterious(0) | probably_damaging(0.997) | TCGA-AX-A0J1-01 | Endometrium | uterine corpus endometrioid carcinoma | Female | >=65 | I/II | Unknown | Unknown | SD |
| ACAA2 | SNV | Missense_Mutation | rs748770671 | c.752C>T | p.Ser251Leu | p.S251L | P42765 | protein_coding | deleterious(0) | probably_damaging(1) | TCGA-AX-A2HC-01 | Endometrium | uterine corpus endometrioid carcinoma | Female | <65 | III/IV | Chemotherapy | paclitaxel | PD |
| Page: 1 2 3 |
Top |
Related drugs of malignant transformation related genes |
| Identification of chemicals and drugs interact with genes involved in malignant transfromation |
| (DGIdb 4.0) |
| Entrez ID | Symbol | Category | Interaction Types | Drug Claim Name | Drug Name | PMIDs |
| Page: 1 |

Copyright 2023-Present -The University of Texas Health Science Center at Houston |