
|
|||||
|
 | |
| |
| |
| |
| |
| |
|
Gene: ABCD4 |
Gene summary for ABCD4 |
| Gene information | Species | Human | Gene symbol | ABCD4 | Gene ID | 5826 |
| Gene name | ATP binding cassette subfamily D member 4 | |
| Gene Alias | ABC41 | |
| Cytomap | 14q24.3 | |
| Gene Type | protein-coding | GO ID | GO:0000038 | UniProtAcc | A0A024R6B9 |
Top |
Malignant transformation analysis |
| Identification of the aberrant gene expression in precancerous and cancerous lesions by comparing the gene expression of stem-like cells in diseased tissues with normal stem cells |
| Entrez ID | Symbol | Replicates | Species | Organ | Tissue | Adj P-value | Log2FC | Malignancy |
| 5826 | ABCD4 | LZE4T | Human | Esophagus | ESCC | 2.34e-02 | 1.07e-01 | 0.0811 |
| 5826 | ABCD4 | LZE8T | Human | Esophagus | ESCC | 6.61e-08 | 1.77e-01 | 0.067 |
| 5826 | ABCD4 | LZE20T | Human | Esophagus | ESCC | 5.89e-03 | 2.36e-01 | 0.0662 |
| 5826 | ABCD4 | LZE22T | Human | Esophagus | ESCC | 5.68e-03 | 5.17e-01 | 0.068 |
| 5826 | ABCD4 | LZE24T | Human | Esophagus | ESCC | 2.71e-07 | 1.87e-01 | 0.0596 |
| 5826 | ABCD4 | LZE6T | Human | Esophagus | ESCC | 1.69e-06 | 2.36e-01 | 0.0845 |
| 5826 | ABCD4 | P1T-E | Human | Esophagus | ESCC | 4.22e-03 | 2.50e-01 | 0.0875 |
| 5826 | ABCD4 | P2T-E | Human | Esophagus | ESCC | 5.19e-21 | 3.81e-01 | 0.1177 |
| 5826 | ABCD4 | P4T-E | Human | Esophagus | ESCC | 2.76e-18 | 4.25e-01 | 0.1323 |
| 5826 | ABCD4 | P5T-E | Human | Esophagus | ESCC | 2.31e-08 | 1.98e-01 | 0.1327 |
| 5826 | ABCD4 | P8T-E | Human | Esophagus | ESCC | 1.34e-27 | 4.68e-01 | 0.0889 |
| 5826 | ABCD4 | P9T-E | Human | Esophagus | ESCC | 2.55e-14 | 1.63e-01 | 0.1131 |
| 5826 | ABCD4 | P10T-E | Human | Esophagus | ESCC | 1.27e-22 | 3.71e-01 | 0.116 |
| 5826 | ABCD4 | P11T-E | Human | Esophagus | ESCC | 2.21e-18 | 6.61e-01 | 0.1426 |
| 5826 | ABCD4 | P12T-E | Human | Esophagus | ESCC | 1.13e-31 | 6.08e-01 | 0.1122 |
| 5826 | ABCD4 | P15T-E | Human | Esophagus | ESCC | 1.18e-39 | 7.63e-01 | 0.1149 |
| 5826 | ABCD4 | P16T-E | Human | Esophagus | ESCC | 1.56e-24 | 3.35e-01 | 0.1153 |
| 5826 | ABCD4 | P17T-E | Human | Esophagus | ESCC | 3.03e-05 | 2.39e-01 | 0.1278 |
| 5826 | ABCD4 | P19T-E | Human | Esophagus | ESCC | 4.78e-02 | 3.00e-01 | 0.1662 |
| 5826 | ABCD4 | P20T-E | Human | Esophagus | ESCC | 5.74e-13 | 2.85e-01 | 0.1124 |
| Page: 1 2 3 4 5 6 |
| Tissue | Expression Dynamics | Abbreviation |
| Esophagus |  | ESCC: Esophageal squamous cell carcinoma |
| HGIN: High-grade intraepithelial neoplasias | ||
| LGIN: Low-grade intraepithelial neoplasias | ||
| Oral Cavity |  | EOLP: Erosive Oral lichen planus |
| LP: leukoplakia | ||
| NEOLP: Non-erosive oral lichen planus | ||
| OSCC: Oral squamous cell carcinoma | ||
| Skin | 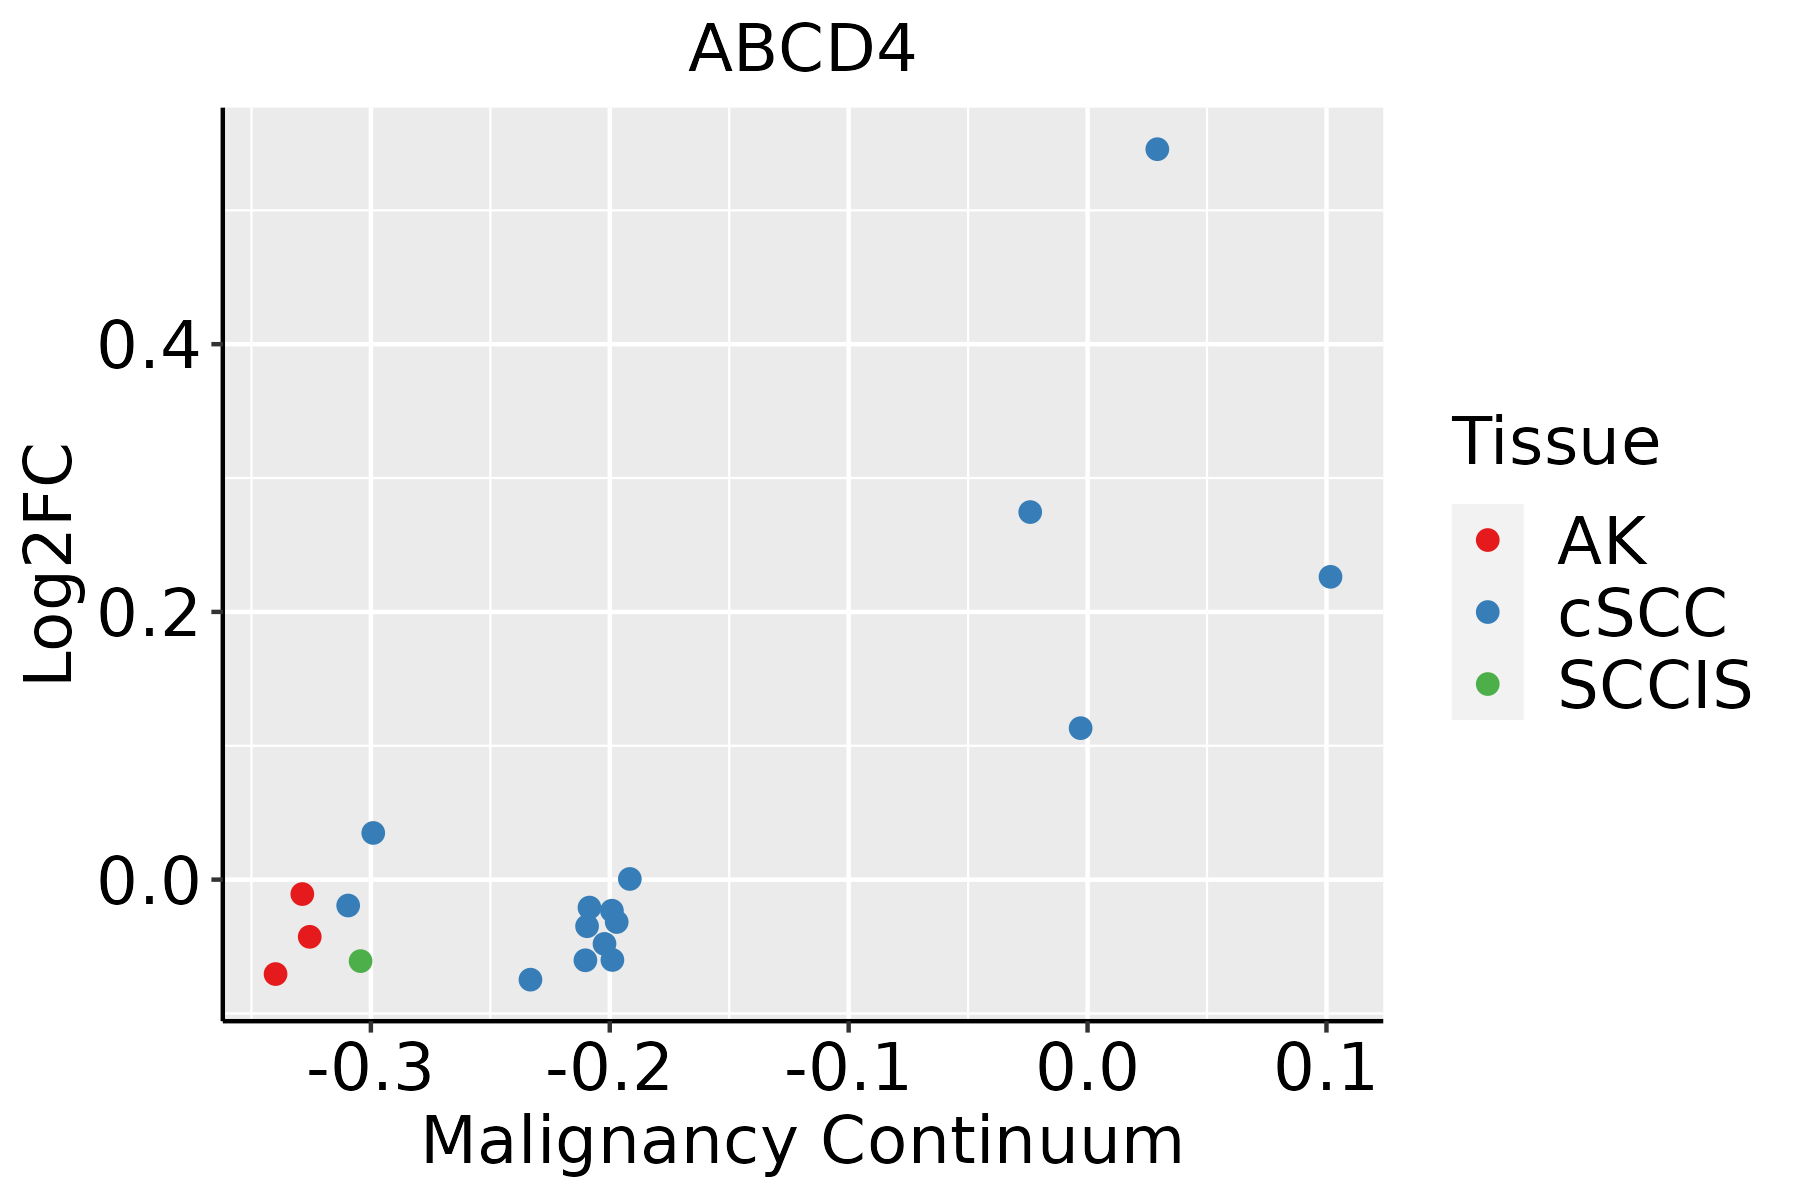 | AK: Actinic keratosis |
| cSCC: Cutaneous squamous cell carcinoma | ||
| SCCIS:squamous cell carcinoma in situ | ||
| Thyroid | 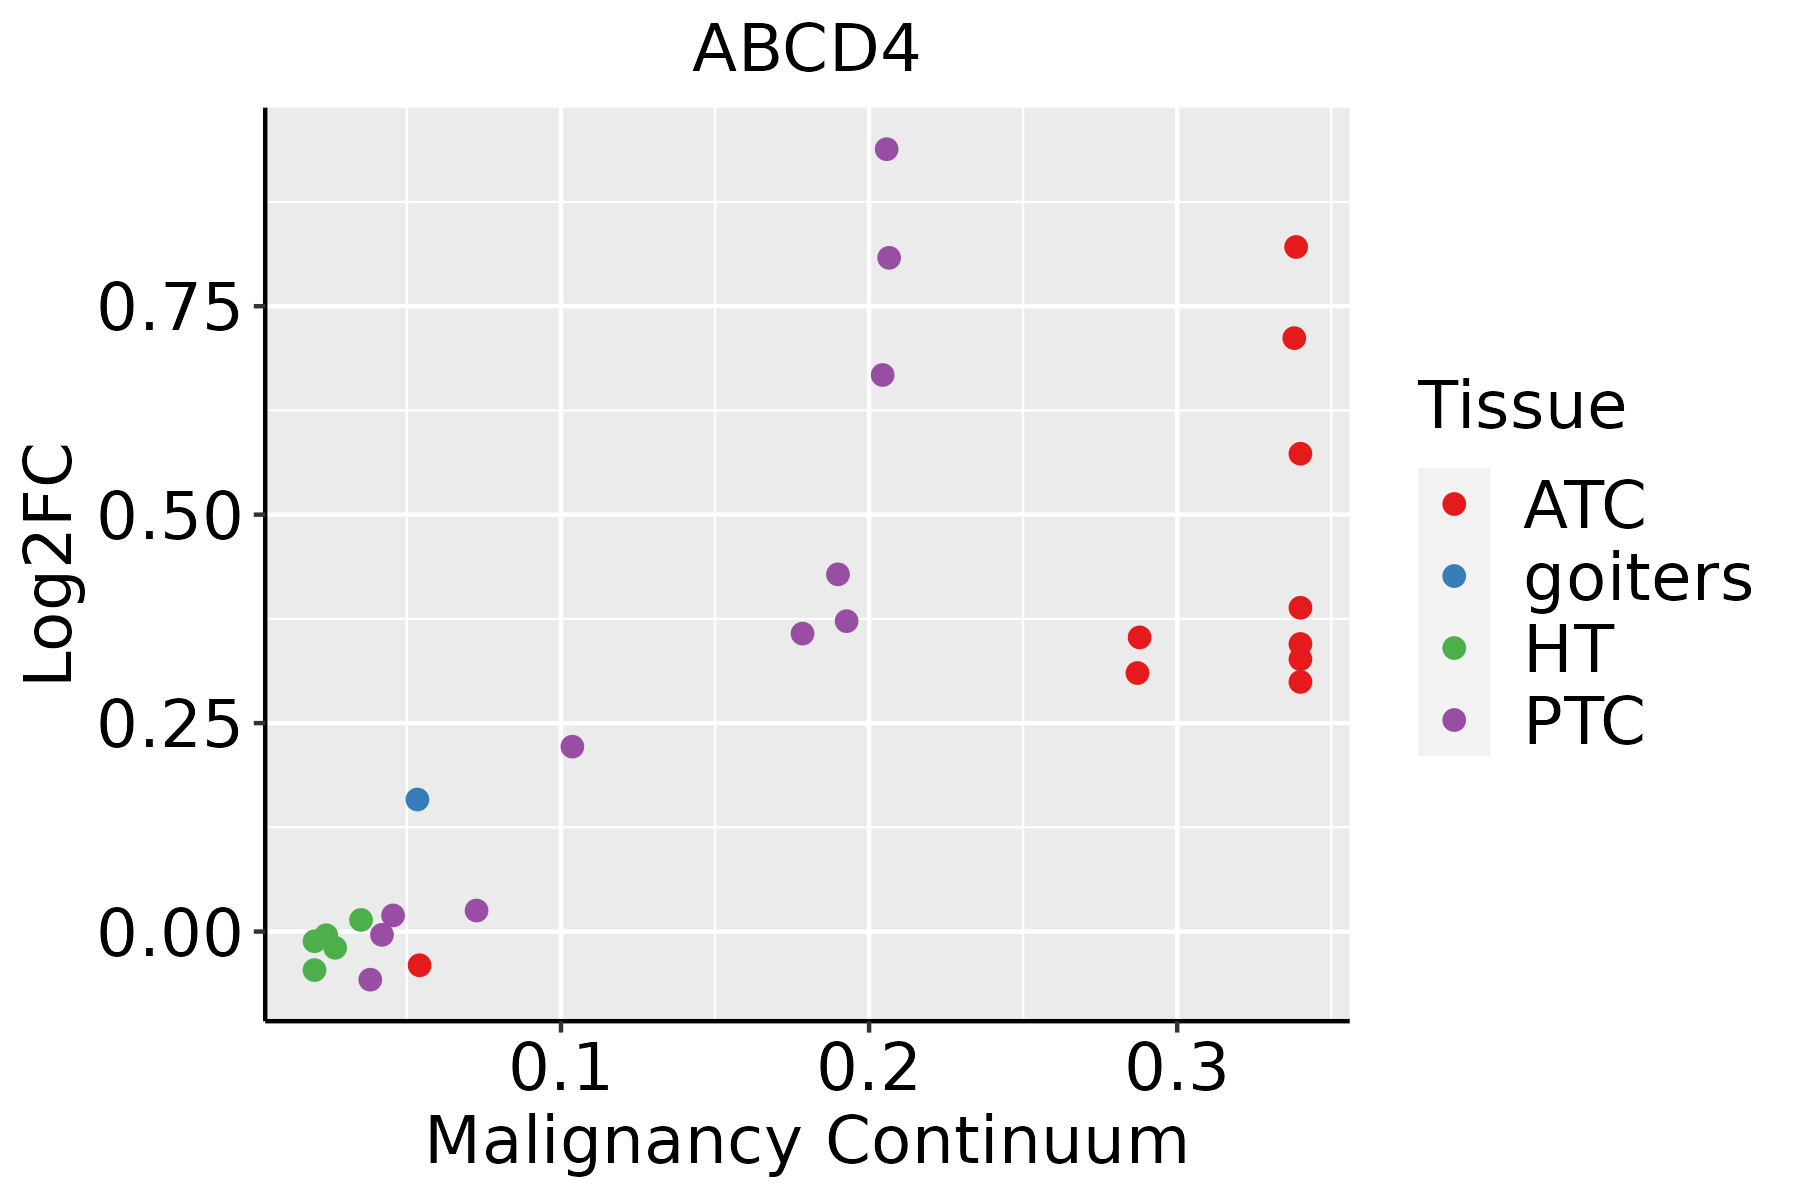 | ATC: Anaplastic thyroid cancer |
| HT: Hashimoto's thyroiditis | ||
| PTC: Papillary thyroid cancer |
| ∗log2FC in expression of this searched gene in stem-like cells from each diseased tissue sample relative to stem-like cells in normal samples in each tissue plotted against the malignancy continuum. Samples are colored based on if they are from different disease stage. |
Top |
Malignant transformation related pathway analysis |
| Find out the enriched GO biological processes and KEGG pathways involved in transition from healthy to precancer to cancer |
| Tissue | Disease Stage | Enriched GO biological Processes |
| Colorectum | AD |  |
| Colorectum | SER |  |
| Colorectum | MSS |  |
| Colorectum | MSI-H |  |
| Colorectum | FAP |  |
| ∗Top 15 enriched GO BP terms are showed in the bar plot of each disease state in each tissue. Each row represents a significant GO biological process which is colored according to the -log10(p.adjust). |
| Page: 1 2 3 4 5 6 7 8 9 |
| GO ID | Tissue | Disease Stage | Description | Gene Ratio | Bg Ratio | pvalue | p.adjust | Count |
| GO:00723296 | Oral cavity | OSCC | monocarboxylic acid catabolic process | 66/7305 | 122/18723 | 5.02e-04 | 2.95e-03 | 66 |
| GO:00193957 | Oral cavity | OSCC | fatty acid oxidation | 57/7305 | 103/18723 | 5.58e-04 | 3.23e-03 | 57 |
| GO:00344406 | Oral cavity | OSCC | lipid oxidation | 59/7305 | 108/18723 | 7.01e-04 | 3.89e-03 | 59 |
| GO:0043574 | Oral cavity | OSCC | peroxisomal transport | 16/7305 | 22/18723 | 1.40e-03 | 6.79e-03 | 16 |
| GO:00066357 | Oral cavity | OSCC | fatty acid beta-oxidation | 42/7305 | 74/18723 | 1.47e-03 | 7.09e-03 | 42 |
| GO:00070312 | Oral cavity | OSCC | peroxisome organization | 23/7305 | 36/18723 | 2.19e-03 | 9.95e-03 | 23 |
| GO:00442826 | Oral cavity | OSCC | small molecule catabolic process | 174/7305 | 376/18723 | 2.25e-03 | 1.00e-02 | 174 |
| GO:00442426 | Oral cavity | OSCC | cellular lipid catabolic process | 104/7305 | 214/18723 | 2.61e-03 | 1.15e-02 | 104 |
| GO:0015919 | Oral cavity | OSCC | peroxisomal membrane transport | 14/7305 | 20/18723 | 4.95e-03 | 1.94e-02 | 14 |
| GO:00070311 | Oral cavity | LP | peroxisome organization | 17/4623 | 36/18723 | 2.74e-03 | 1.92e-02 | 17 |
| GO:004424213 | Oral cavity | LP | cellular lipid catabolic process | 70/4623 | 214/18723 | 4.82e-03 | 3.05e-02 | 70 |
| GO:000663513 | Oral cavity | LP | fatty acid beta-oxidation | 28/4623 | 74/18723 | 8.17e-03 | 4.44e-02 | 28 |
| GO:00435741 | Oral cavity | LP | peroxisomal transport | 11/4623 | 22/18723 | 9.01e-03 | 4.83e-02 | 11 |
| GO:199082317 | Skin | cSCC | response to leukemia inhibitory factor | 42/4864 | 95/18723 | 8.79e-05 | 8.27e-04 | 42 |
| GO:199083016 | Skin | cSCC | cellular response to leukemia inhibitory factor | 41/4864 | 94/18723 | 1.53e-04 | 1.35e-03 | 41 |
| GO:00066359 | Skin | cSCC | fatty acid beta-oxidation | 30/4864 | 74/18723 | 4.32e-03 | 2.27e-02 | 30 |
| GO:00067672 | Skin | cSCC | water-soluble vitamin metabolic process | 24/4864 | 59/18723 | 9.59e-03 | 4.30e-02 | 24 |
| GO:199082310 | Thyroid | PTC | response to leukemia inhibitory factor | 42/5968 | 95/18723 | 7.69e-03 | 3.27e-02 | 42 |
| GO:199083010 | Thyroid | PTC | cellular response to leukemia inhibitory factor | 41/5968 | 94/18723 | 1.10e-02 | 4.38e-02 | 41 |
| GO:199082318 | Thyroid | ATC | response to leukemia inhibitory factor | 44/6293 | 95/18723 | 6.74e-03 | 2.68e-02 | 44 |
| Page: 1 2 3 |
| Pathway ID | Tissue | Disease Stage | Description | Gene Ratio | Bg Ratio | pvalue | p.adjust | qvalue | Count |
| hsa041467 | Esophagus | ESCC | Peroxisome | 55/4205 | 82/8465 | 1.04e-03 | 3.27e-03 | 1.68e-03 | 55 |
| hsa0414612 | Esophagus | ESCC | Peroxisome | 55/4205 | 82/8465 | 1.04e-03 | 3.27e-03 | 1.68e-03 | 55 |
| hsa041466 | Oral cavity | OSCC | Peroxisome | 47/3704 | 82/8465 | 9.01e-03 | 2.01e-02 | 1.03e-02 | 47 |
| hsa0414611 | Oral cavity | OSCC | Peroxisome | 47/3704 | 82/8465 | 9.01e-03 | 2.01e-02 | 1.03e-02 | 47 |
| Page: 1 |
Top |
Cell-cell communication analysis |
| Identification of potential cell-cell interactions between two cell types and their ligand-receptor pairs for different disease states |
| Ligand | Receptor | LRpair | Pathway | Tissue | Disease Stage |
| Page: 1 |
Top |
Single-cell gene regulatory network inference analysis |
| Find out the significant the regulons (TFs) and the target genes of each regulon across cell types for different disease states |
| TF | Cell Type | Tissue | Disease Stage | Target Gene | RSS | Regulon Activity |
| ∗The dot plots of a searched regulon are shown for all cell subpopulations in each disease state of each tissue based on the regulon specific score inferred using pySCENIC and by calculating the average expression. |
| Page: 1 |
Top |
Somatic mutation of malignant transformation related genes |
| Annotation of somatic variants for genes involved in malignant transformation |
| Hugo Symbol | Variant Class | Variant Classification | dbSNP RS | HGVSc | HGVSp | HGVSp Short | SWISSPROT | BIOTYPE | SIFT | PolyPhen | Tumor Sample Barcode | Tissue | Histology | Sex | Age | Stage | Therapy Types | Drugs | Outcome |
| ABCD4 | SNV | Missense_Mutation | rs570985200 | c.284N>G | p.Thr95Arg | p.T95R | O14678 | protein_coding | tolerated(0.05) | benign(0.325) | TCGA-AQ-A54N-01 | Breast | breast invasive carcinoma | Female | <65 | I/II | Unknown | Unknown | SD |
| ABCD4 | insertion | Frame_Shift_Ins | novel | c.1400_1401insGT | p.Asp467GlufsTer9 | p.D467Efs*9 | O14678 | protein_coding | TCGA-A2-A0CX-01 | Breast | breast invasive carcinoma | Female | <65 | I/II | Chemotherapy | adriamycin | SD | ||
| ABCD4 | deletion | Frame_Shift_Del | novel | c.1397_1398delNN | p.Thr466ArgfsTer24 | p.T466Rfs*24 | O14678 | protein_coding | TCGA-A2-A0CX-01 | Breast | breast invasive carcinoma | Female | <65 | I/II | Chemotherapy | adriamycin | SD | ||
| ABCD4 | insertion | In_Frame_Ins | novel | c.252_253insTTTTGTCCTTTTCATACTTTATATCTTAGTCTT | p.Phe84_Leu85insPheCysProPheHisThrLeuTyrLeuSerLeu | p.F84_L85insFCPFHTLYLSL | O14678 | protein_coding | TCGA-BH-A0HF-01 | Breast | breast invasive carcinoma | Female | >=65 | I/II | Hormone Therapy | arimidex | SD | ||
| ABCD4 | SNV | Missense_Mutation | novel | c.698N>T | p.Ala233Val | p.A233V | O14678 | protein_coding | tolerated(0.05) | possibly_damaging(0.899) | TCGA-2W-A8YY-01 | Cervix | cervical & endocervical cancer | Female | <65 | I/II | Chemotherapy | cisplatin | CR |
| ABCD4 | SNV | Missense_Mutation | c.1414N>A | p.Glu472Lys | p.E472K | O14678 | protein_coding | deleterious(0) | possibly_damaging(0.672) | TCGA-DR-A0ZM-01 | Cervix | cervical & endocervical cancer | Female | <65 | III/IV | Unspecific | Cisplatin | SD | |
| ABCD4 | SNV | Missense_Mutation | novel | c.459N>A | p.Phe153Leu | p.F153L | O14678 | protein_coding | tolerated(0.6) | benign(0.019) | TCGA-DS-A0VN-01 | Cervix | cervical & endocervical cancer | Female | <65 | I/II | Chemotherapy | cisplatin | SD |
| ABCD4 | SNV | Missense_Mutation | c.1747N>C | p.Glu583Gln | p.E583Q | O14678 | protein_coding | tolerated(0.4) | benign(0.003) | TCGA-EK-A2R7-01 | Cervix | cervical & endocervical cancer | Female | <65 | I/II | Unknown | Unknown | SD | |
| ABCD4 | SNV | Missense_Mutation | rs759637495 | c.418G>A | p.Asp140Asn | p.D140N | O14678 | protein_coding | deleterious(0) | probably_damaging(1) | TCGA-FU-A3HZ-01 | Cervix | cervical & endocervical cancer | Female | <65 | I/II | Chemotherapy | cisplatin | CR |
| ABCD4 | SNV | Missense_Mutation | novel | c.582C>A | p.Phe194Leu | p.F194L | O14678 | protein_coding | deleterious(0) | probably_damaging(0.998) | TCGA-IR-A3LH-01 | Cervix | cervical & endocervical cancer | Female | <65 | I/II | Chemotherapy | cisplatin | CR |
| Page: 1 2 3 4 5 6 |
Top |
Related drugs of malignant transformation related genes |
| Identification of chemicals and drugs interact with genes involved in malignant transfromation |
| (DGIdb 4.0) |
| Entrez ID | Symbol | Category | Interaction Types | Drug Claim Name | Drug Name | PMIDs |
| Page: 1 |

Copyright 2023-Present -The University of Texas Health Science Center at Houston |