
|
|||||
|
 | |
| |
| |
| |
| |
| |
|
Gene: ABAT |
Gene summary for ABAT |
| Gene information | Species | Human | Gene symbol | ABAT | Gene ID | 18 |
| Gene name | 4-aminobutyrate aminotransferase | |
| Gene Alias | GABA-AT | |
| Cytomap | 16p13.2 | |
| Gene Type | protein-coding | GO ID | GO:0000003 | UniProtAcc | P80404 |
Top |
Malignant transformation analysis |
| Identification of the aberrant gene expression in precancerous and cancerous lesions by comparing the gene expression of stem-like cells in diseased tissues with normal stem cells |
| Entrez ID | Symbol | Replicates | Species | Organ | Tissue | Adj P-value | Log2FC | Malignancy |
| 18 | ABAT | NAFLD1 | Human | Liver | NAFLD | 3.08e-14 | 9.41e-01 | -0.04 |
| 18 | ABAT | HCC1_Meng | Human | Liver | HCC | 1.36e-10 | -1.21e-01 | 0.0246 |
| 18 | ABAT | HCC1 | Human | Liver | HCC | 5.00e-02 | 2.38e+00 | 0.5336 |
| 18 | ABAT | Pt13.a | Human | Liver | HCC | 9.68e-04 | -1.41e-01 | 0.021 |
| 18 | ABAT | S028 | Human | Liver | HCC | 4.68e-05 | 3.49e-01 | 0.2503 |
| 18 | ABAT | S029 | Human | Liver | HCC | 2.06e-02 | 3.29e-01 | 0.2581 |
| 18 | ABAT | HTA12-26-1 | Human | Pancreas | PDAC | 3.09e-13 | 8.68e-01 | 0.3728 |
| 18 | ABAT | HTA12-29-1 | Human | Pancreas | PDAC | 8.17e-26 | 7.68e-01 | 0.3722 |
| Page: 1 |
| Tissue | Expression Dynamics | Abbreviation |
| Liver | 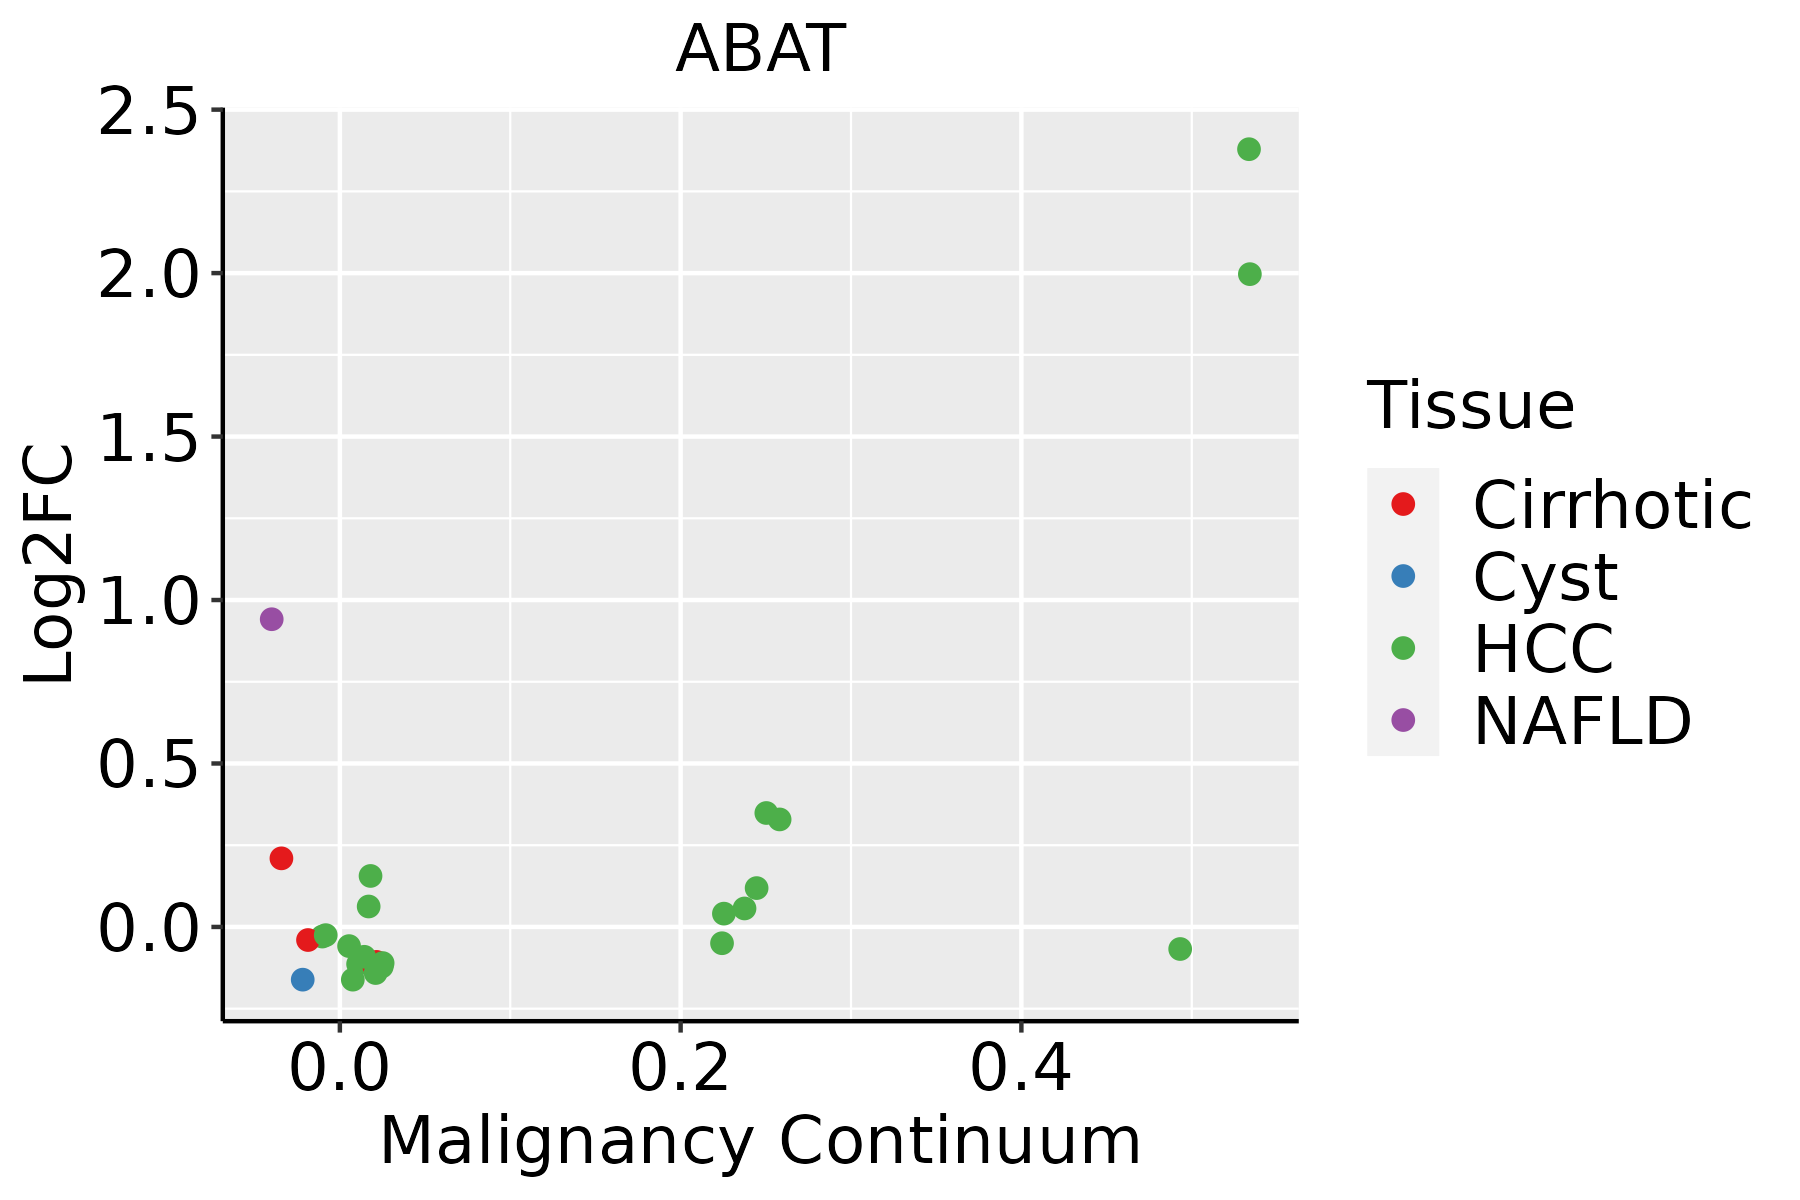 | HCC: Hepatocellular carcinoma |
| NAFLD: Non-alcoholic fatty liver disease | ||
| Prostate |  | BPH: Benign Prostatic Hyperplasia |
| ∗log2FC in expression of this searched gene in stem-like cells from each diseased tissue sample relative to stem-like cells in normal samples in each tissue plotted against the malignancy continuum. Samples are colored based on if they are from different disease stage. |
Top |
Malignant transformation related pathway analysis |
| Find out the enriched GO biological processes and KEGG pathways involved in transition from healthy to precancer to cancer |
| Tissue | Disease Stage | Enriched GO biological Processes |
| Colorectum | AD |  |
| Colorectum | SER |  |
| Colorectum | MSS |  |
| Colorectum | MSI-H |  |
| Colorectum | FAP |  |
| ∗Top 15 enriched GO BP terms are showed in the bar plot of each disease state in each tissue. Each row represents a significant GO biological process which is colored according to the -log10(p.adjust). |
| Page: 1 2 3 4 5 6 7 8 9 |
| GO ID | Tissue | Disease Stage | Description | Gene Ratio | Bg Ratio | pvalue | p.adjust | Count |
| GO:00075964 | Liver | NAFLD | blood coagulation | 48/1882 | 217/18723 | 1.16e-07 | 8.81e-06 | 48 |
| GO:00508174 | Liver | NAFLD | coagulation | 48/1882 | 222/18723 | 2.40e-07 | 1.61e-05 | 48 |
| GO:1903035 | Liver | NAFLD | negative regulation of response to wounding | 26/1882 | 94/18723 | 1.18e-06 | 5.66e-05 | 26 |
| GO:00512227 | Liver | NAFLD | positive regulation of protein transport | 55/1882 | 303/18723 | 1.07e-05 | 3.35e-04 | 55 |
| GO:19049517 | Liver | NAFLD | positive regulation of establishment of protein localization | 55/1882 | 319/18723 | 4.79e-05 | 1.14e-03 | 55 |
| GO:00100387 | Liver | NAFLD | response to metal ion | 62/1882 | 373/18723 | 5.05e-05 | 1.19e-03 | 62 |
| GO:0015850 | Liver | NAFLD | organic hydroxy compound transport | 50/1882 | 284/18723 | 6.01e-05 | 1.32e-03 | 50 |
| GO:00508787 | Liver | NAFLD | regulation of body fluid levels | 60/1882 | 379/18723 | 2.61e-04 | 4.23e-03 | 60 |
| GO:00075687 | Liver | NAFLD | aging | 53/1882 | 339/18723 | 7.78e-04 | 9.77e-03 | 53 |
| GO:00973056 | Liver | NAFLD | response to alcohol | 42/1882 | 253/18723 | 7.91e-04 | 9.89e-03 | 42 |
| GO:0042220 | Liver | NAFLD | response to cocaine | 13/1882 | 55/18723 | 2.64e-03 | 2.42e-02 | 13 |
| GO:0032102 | Liver | NAFLD | negative regulation of response to external stimulus | 60/1882 | 420/18723 | 3.34e-03 | 2.93e-02 | 60 |
| GO:00902764 | Liver | NAFLD | regulation of peptide hormone secretion | 32/1882 | 196/18723 | 4.06e-03 | 3.40e-02 | 32 |
| GO:00016592 | Liver | NAFLD | temperature homeostasis | 29/1882 | 174/18723 | 4.48e-03 | 3.61e-02 | 29 |
| GO:00355926 | Liver | NAFLD | establishment of protein localization to extracellular region | 52/1882 | 360/18723 | 4.80e-03 | 3.81e-02 | 52 |
| GO:0045471 | Liver | NAFLD | response to ethanol | 24/1882 | 137/18723 | 4.89e-03 | 3.85e-02 | 24 |
| GO:00507147 | Liver | NAFLD | positive regulation of protein secretion | 24/1882 | 137/18723 | 4.89e-03 | 3.85e-02 | 24 |
| GO:00027914 | Liver | NAFLD | regulation of peptide secretion | 32/1882 | 200/18723 | 5.53e-03 | 4.23e-02 | 32 |
| GO:00900874 | Liver | NAFLD | regulation of peptide transport | 32/1882 | 202/18723 | 6.42e-03 | 4.69e-02 | 32 |
| GO:00902771 | Liver | NAFLD | positive regulation of peptide hormone secretion | 19/1882 | 103/18723 | 6.58e-03 | 4.69e-02 | 19 |
| Page: 1 2 3 4 5 6 7 8 |
| Pathway ID | Tissue | Disease Stage | Description | Gene Ratio | Bg Ratio | pvalue | p.adjust | qvalue | Count |
| hsa0028041 | Liver | HCC | Valine, leucine and isoleucine degradation | 41/4020 | 48/8465 | 4.84e-08 | 7.05e-07 | 3.92e-07 | 41 |
| hsa0064041 | Liver | HCC | Propanoate metabolism | 24/4020 | 32/8465 | 1.42e-03 | 5.07e-03 | 2.82e-03 | 24 |
| hsa006504 | Liver | HCC | Butanoate metabolism | 19/4020 | 27/8465 | 1.37e-02 | 3.33e-02 | 1.85e-02 | 19 |
| hsa0028051 | Liver | HCC | Valine, leucine and isoleucine degradation | 41/4020 | 48/8465 | 4.84e-08 | 7.05e-07 | 3.92e-07 | 41 |
| hsa0064051 | Liver | HCC | Propanoate metabolism | 24/4020 | 32/8465 | 1.42e-03 | 5.07e-03 | 2.82e-03 | 24 |
| hsa006505 | Liver | HCC | Butanoate metabolism | 19/4020 | 27/8465 | 1.37e-02 | 3.33e-02 | 1.85e-02 | 19 |
| Page: 1 |
Top |
Cell-cell communication analysis |
| Identification of potential cell-cell interactions between two cell types and their ligand-receptor pairs for different disease states |
| Ligand | Receptor | LRpair | Pathway | Tissue | Disease Stage |
| Page: 1 |
Top |
Single-cell gene regulatory network inference analysis |
| Find out the significant the regulons (TFs) and the target genes of each regulon across cell types for different disease states |
| TF | Cell Type | Tissue | Disease Stage | Target Gene | RSS | Regulon Activity |
| ∗The dot plots of a searched regulon are shown for all cell subpopulations in each disease state of each tissue based on the regulon specific score inferred using pySCENIC and by calculating the average expression. |
| Page: 1 |
Top |
Somatic mutation of malignant transformation related genes |
| Annotation of somatic variants for genes involved in malignant transformation |
| Hugo Symbol | Variant Class | Variant Classification | dbSNP RS | HGVSc | HGVSp | HGVSp Short | SWISSPROT | BIOTYPE | SIFT | PolyPhen | Tumor Sample Barcode | Tissue | Histology | Sex | Age | Stage | Therapy Types | Drugs | Outcome |
| ABAT | SNV | Missense_Mutation | c.74N>G | p.Ser25Cys | p.S25C | P80404 | protein_coding | tolerated(0.18) | benign(0) | TCGA-AC-A23H-01 | Breast | breast invasive carcinoma | Female | >=65 | I/II | Unknown | Unknown | PD | |
| ABAT | SNV | Missense_Mutation | c.583N>A | p.Glu195Lys | p.E195K | P80404 | protein_coding | tolerated(0.18) | benign(0.103) | TCGA-AN-A0FW-01 | Breast | breast invasive carcinoma | Female | >=65 | III/IV | Unknown | Unknown | SD | |
| ABAT | SNV | Missense_Mutation | c.1080N>A | p.Met360Ile | p.M360I | P80404 | protein_coding | tolerated(0.32) | benign(0.006) | TCGA-AN-A0XW-01 | Breast | breast invasive carcinoma | Female | <65 | III/IV | Unknown | Unknown | SD | |
| ABAT | SNV | Missense_Mutation | c.10N>G | p.Met4Val | p.M4V | P80404 | protein_coding | tolerated_low_confidence(1) | benign(0) | TCGA-BH-A0GY-01 | Breast | breast invasive carcinoma | Female | >=65 | I/II | Chemotherapy | cyotxan | SD | |
| ABAT | SNV | Missense_Mutation | rs762137050 | c.1424N>A | p.Arg475His | p.R475H | P80404 | protein_coding | deleterious(0) | probably_damaging(1) | TCGA-HN-A2NL-01 | Breast | breast invasive carcinoma | Female | <65 | I/II | Chemotherapy | cyclophosphamide | SD |
| ABAT | insertion | In_Frame_Ins | novel | c.426_427insCAGGCA | p.Lys142_Leu143insGlnAla | p.K142_L143insQA | P80404 | protein_coding | TCGA-AO-A03P-01 | Breast | breast invasive carcinoma | Female | <65 | I/II | Hormone Therapy | letrozole | PD | ||
| ABAT | insertion | Frame_Shift_Ins | novel | c.428_429insGCACTCTGCCTGTTTTTTAG | p.Arg144HisfsTer36 | p.R144Hfs*36 | P80404 | protein_coding | TCGA-AO-A03P-01 | Breast | breast invasive carcinoma | Female | <65 | I/II | Hormone Therapy | letrozole | PD | ||
| ABAT | SNV | Missense_Mutation | novel | c.892G>A | p.Glu298Lys | p.E298K | P80404 | protein_coding | deleterious(0) | probably_damaging(1) | TCGA-C5-A1MP-01 | Cervix | cervical & endocervical cancer | Female | <65 | I/II | Unknown | Unknown | SD |
| ABAT | SNV | Missense_Mutation | rs752701740 | c.205N>C | p.Glu69Gln | p.E69Q | P80404 | protein_coding | tolerated(0.29) | benign(0.104) | TCGA-VS-A958-01 | Cervix | cervical & endocervical cancer | Female | <65 | I/II | Chemotherapy | cisplatin | CR |
| ABAT | SNV | Missense_Mutation | c.766N>A | p.Glu256Lys | p.E256K | P80404 | protein_coding | deleterious(0.01) | possibly_damaging(0.798) | TCGA-AA-3688-01 | Colorectum | colon adenocarcinoma | Male | >=65 | III/IV | Unknown | Unknown | SD |
| Page: 1 2 3 4 5 6 7 |
Top |
Related drugs of malignant transformation related genes |
| Identification of chemicals and drugs interact with genes involved in malignant transfromation |
| (DGIdb 4.0) |
| Entrez ID | Symbol | Category | Interaction Types | Drug Claim Name | Drug Name | PMIDs |
| 18 | ABAT | DRUGGABLE GENOME, ENZYME | valproic acid | 23407051 | ||
| 18 | ABAT | DRUGGABLE GENOME, ENZYME | Divalproex sodium | |||
| 18 | ABAT | DRUGGABLE GENOME, ENZYME | Pyridoxal Phosphate | |||
| 18 | ABAT | DRUGGABLE GENOME, ENZYME | DIVALPROEX SODIUM | |||
| 18 | ABAT | DRUGGABLE GENOME, ENZYME | inhibitor | 178101523 | VIGABATRIN | |
| 18 | ABAT | DRUGGABLE GENOME, ENZYME | CPP -15 | |||
| 18 | ABAT | DRUGGABLE GENOME, ENZYME | 4-hydroxybenzaldehyde | 4-HYDROXYBENZALDEHYDE | ||
| 18 | ABAT | DRUGGABLE GENOME, ENZYME | L-Alanine | L-ALANINE | ||
| 18 | ABAT | DRUGGABLE GENOME, ENZYME | TIAGABINE | TIAGABINE | ||
| 18 | ABAT | DRUGGABLE GENOME, ENZYME | Pyruvic acid |
| Page: 1 2 3 |

Copyright 2023-Present -The University of Texas Health Science Center at Houston |