
|
|||||
|
 | |
| |
| |
| |
| |
| |
|
Gene: CTNNB1 |
Gene summary for CTNNB1 |
| Gene information | Species | Human | Gene symbol | CTNNB1 | Gene ID | 1499 |
| Gene name | catenin beta 1 | |
| Gene Alias | CTNNB | |
| Cytomap | 3p22.1 | |
| Gene Type | protein-coding | GO ID | GO:0000003 | UniProtAcc | A0A024R2Q3 |
Top |
Malignant transformation analysis |
| Identification of the aberrant gene expression in precancerous and cancerous lesions by comparing the gene expression of stem-like cells in diseased tissues with normal stem cells |
| Entrez ID | Symbol | Replicates | Species | Organ | Tissue | Adj P-value | Log2FC | Malignancy |
| 1499 | CTNNB1 | GSM4909281 | Human | Breast | IDC | 4.04e-37 | 7.72e-01 | 0.21 |
| 1499 | CTNNB1 | GSM4909285 | Human | Breast | IDC | 1.22e-03 | -3.19e-01 | 0.21 |
| 1499 | CTNNB1 | GSM4909286 | Human | Breast | IDC | 4.00e-27 | 5.93e-01 | 0.1081 |
| 1499 | CTNNB1 | GSM4909290 | Human | Breast | IDC | 1.18e-10 | 5.79e-01 | 0.2096 |
| 1499 | CTNNB1 | GSM4909293 | Human | Breast | IDC | 1.62e-09 | 9.61e-02 | 0.1581 |
| 1499 | CTNNB1 | GSM4909296 | Human | Breast | IDC | 1.33e-04 | -3.92e-01 | 0.1524 |
| 1499 | CTNNB1 | GSM4909297 | Human | Breast | IDC | 5.05e-39 | 7.43e-01 | 0.1517 |
| 1499 | CTNNB1 | GSM4909298 | Human | Breast | IDC | 2.06e-02 | 1.76e-01 | 0.1551 |
| 1499 | CTNNB1 | GSM4909304 | Human | Breast | IDC | 6.70e-06 | 2.03e-01 | 0.1636 |
| 1499 | CTNNB1 | GSM4909311 | Human | Breast | IDC | 3.87e-21 | -2.74e-01 | 0.1534 |
| 1499 | CTNNB1 | GSM4909312 | Human | Breast | IDC | 3.33e-07 | -3.21e-01 | 0.1552 |
| 1499 | CTNNB1 | GSM4909319 | Human | Breast | IDC | 1.43e-23 | -5.73e-01 | 0.1563 |
| 1499 | CTNNB1 | GSM4909320 | Human | Breast | IDC | 5.97e-05 | -5.18e-01 | 0.1575 |
| 1499 | CTNNB1 | GSM4909321 | Human | Breast | IDC | 2.76e-09 | -4.56e-01 | 0.1559 |
| 1499 | CTNNB1 | brca1 | Human | Breast | Precancer | 7.43e-11 | -5.19e-01 | -0.0338 |
| 1499 | CTNNB1 | brca2 | Human | Breast | Precancer | 2.74e-04 | 4.23e-02 | -0.024 |
| 1499 | CTNNB1 | brca3 | Human | Breast | Precancer | 1.81e-03 | -1.27e-01 | -0.0263 |
| 1499 | CTNNB1 | brca10 | Human | Breast | Precancer | 5.33e-08 | -4.73e-01 | -0.0029 |
| 1499 | CTNNB1 | NCCBC14 | Human | Breast | DCIS | 1.69e-08 | -1.18e-01 | 0.2021 |
| 1499 | CTNNB1 | NCCBC3 | Human | Breast | DCIS | 3.30e-15 | 5.03e-01 | 0.1198 |
| Page: 1 2 3 4 5 6 7 8 9 10 11 12 13 |
| Tissue | Expression Dynamics | Abbreviation |
| Breast | 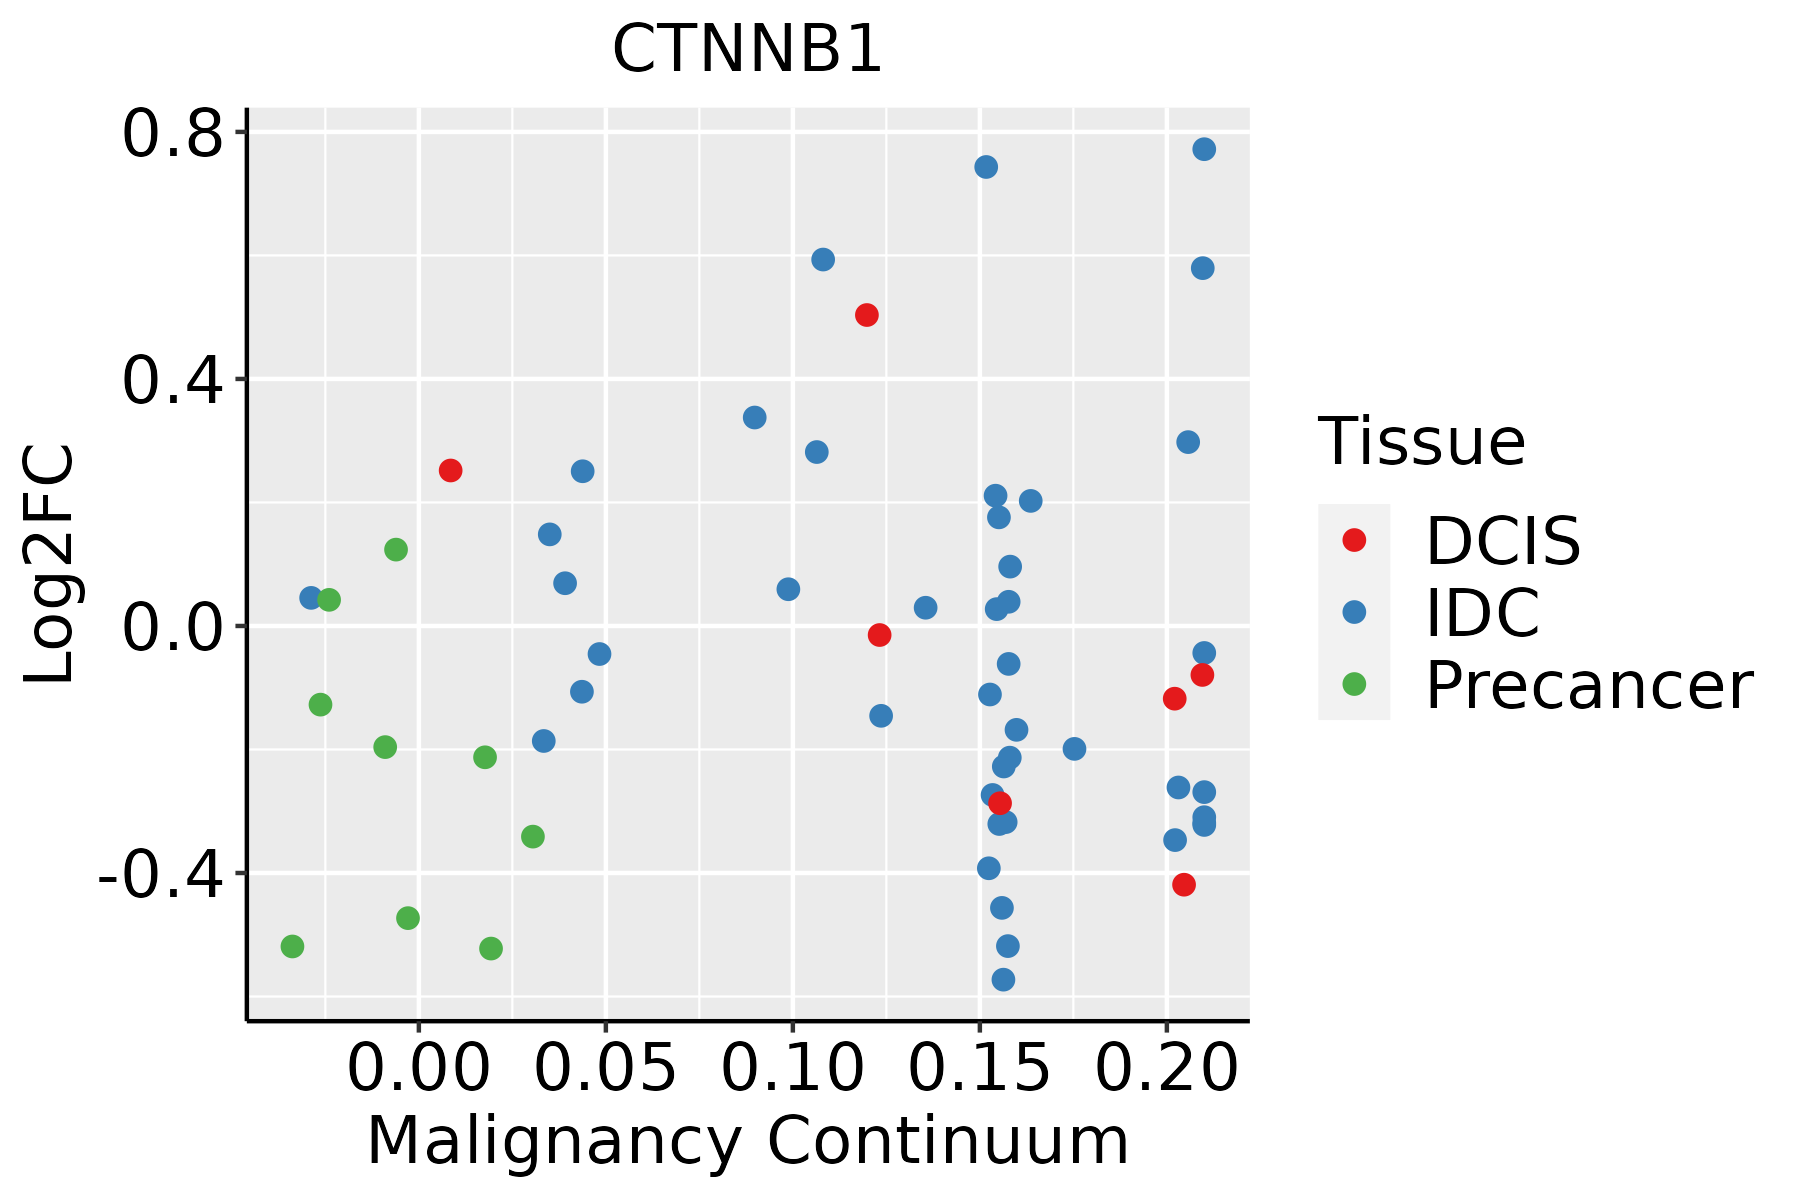 | IDC: Invasive ductal carcinoma |
| DCIS: Ductal carcinoma in situ | ||
| Precancer(BRCA1-mut): Precancerous lesion from BRCA1 mutation carriers | ||
| Colorectum (GSE201348) |  | FAP: Familial adenomatous polyposis |
| CRC: Colorectal cancer | ||
| Colorectum (HTA11) |  | AD: Adenomas |
| SER: Sessile serrated lesions | ||
| MSI-H: Microsatellite-high colorectal cancer | ||
| MSS: Microsatellite stable colorectal cancer | ||
| Endometrium |  | AEH: Atypical endometrial hyperplasia |
| EEC: Endometrioid Cancer | ||
| Esophagus | 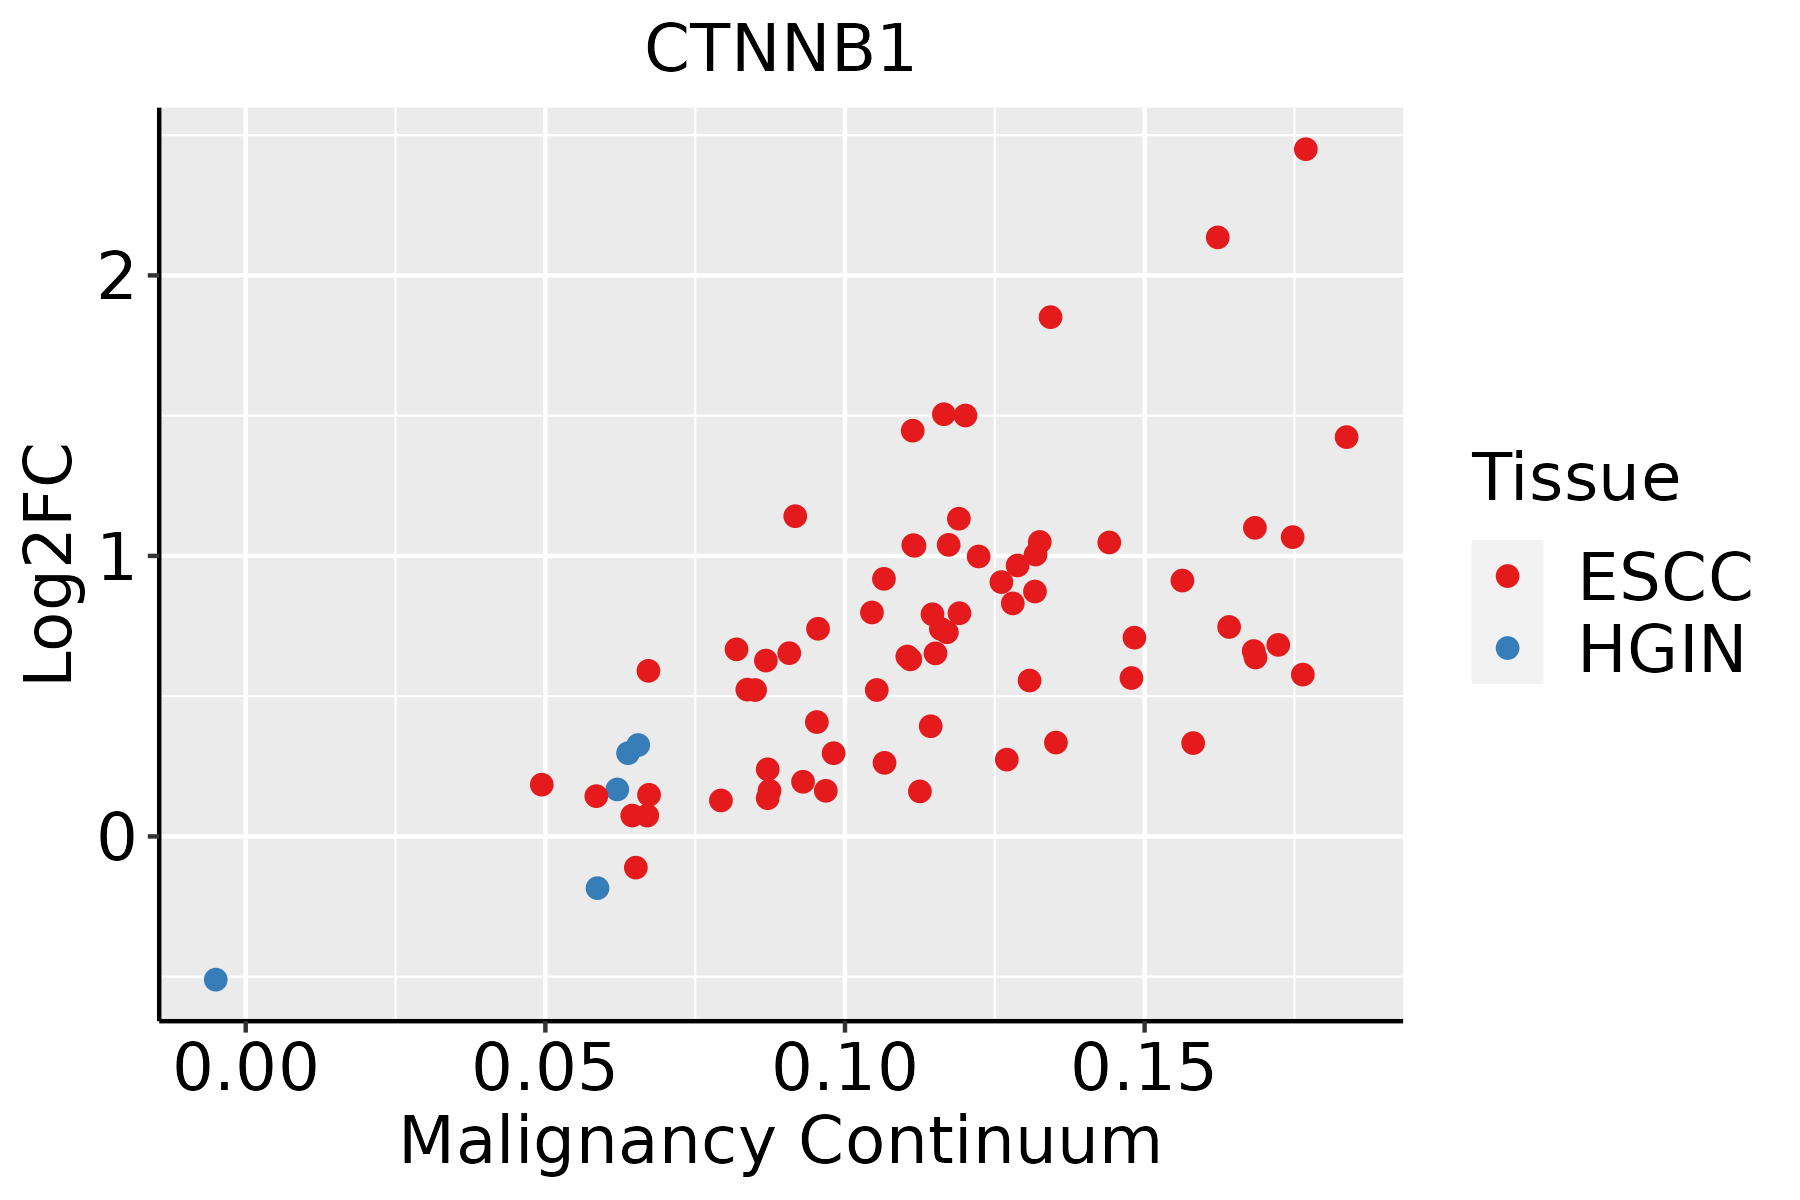 | ESCC: Esophageal squamous cell carcinoma |
| HGIN: High-grade intraepithelial neoplasias | ||
| LGIN: Low-grade intraepithelial neoplasias | ||
| GC |  | CAG: Chronic atrophic gastritis |
| CAG with IM: Chronic atrophic gastritis with intestinal metaplasia | ||
| CSG: Chronic superficial gastritis | ||
| GC: Gastric cancer | ||
| SIM: Severe intestinal metaplasia | ||
| WIM: Wild intestinal metaplasia | ||
| Liver | 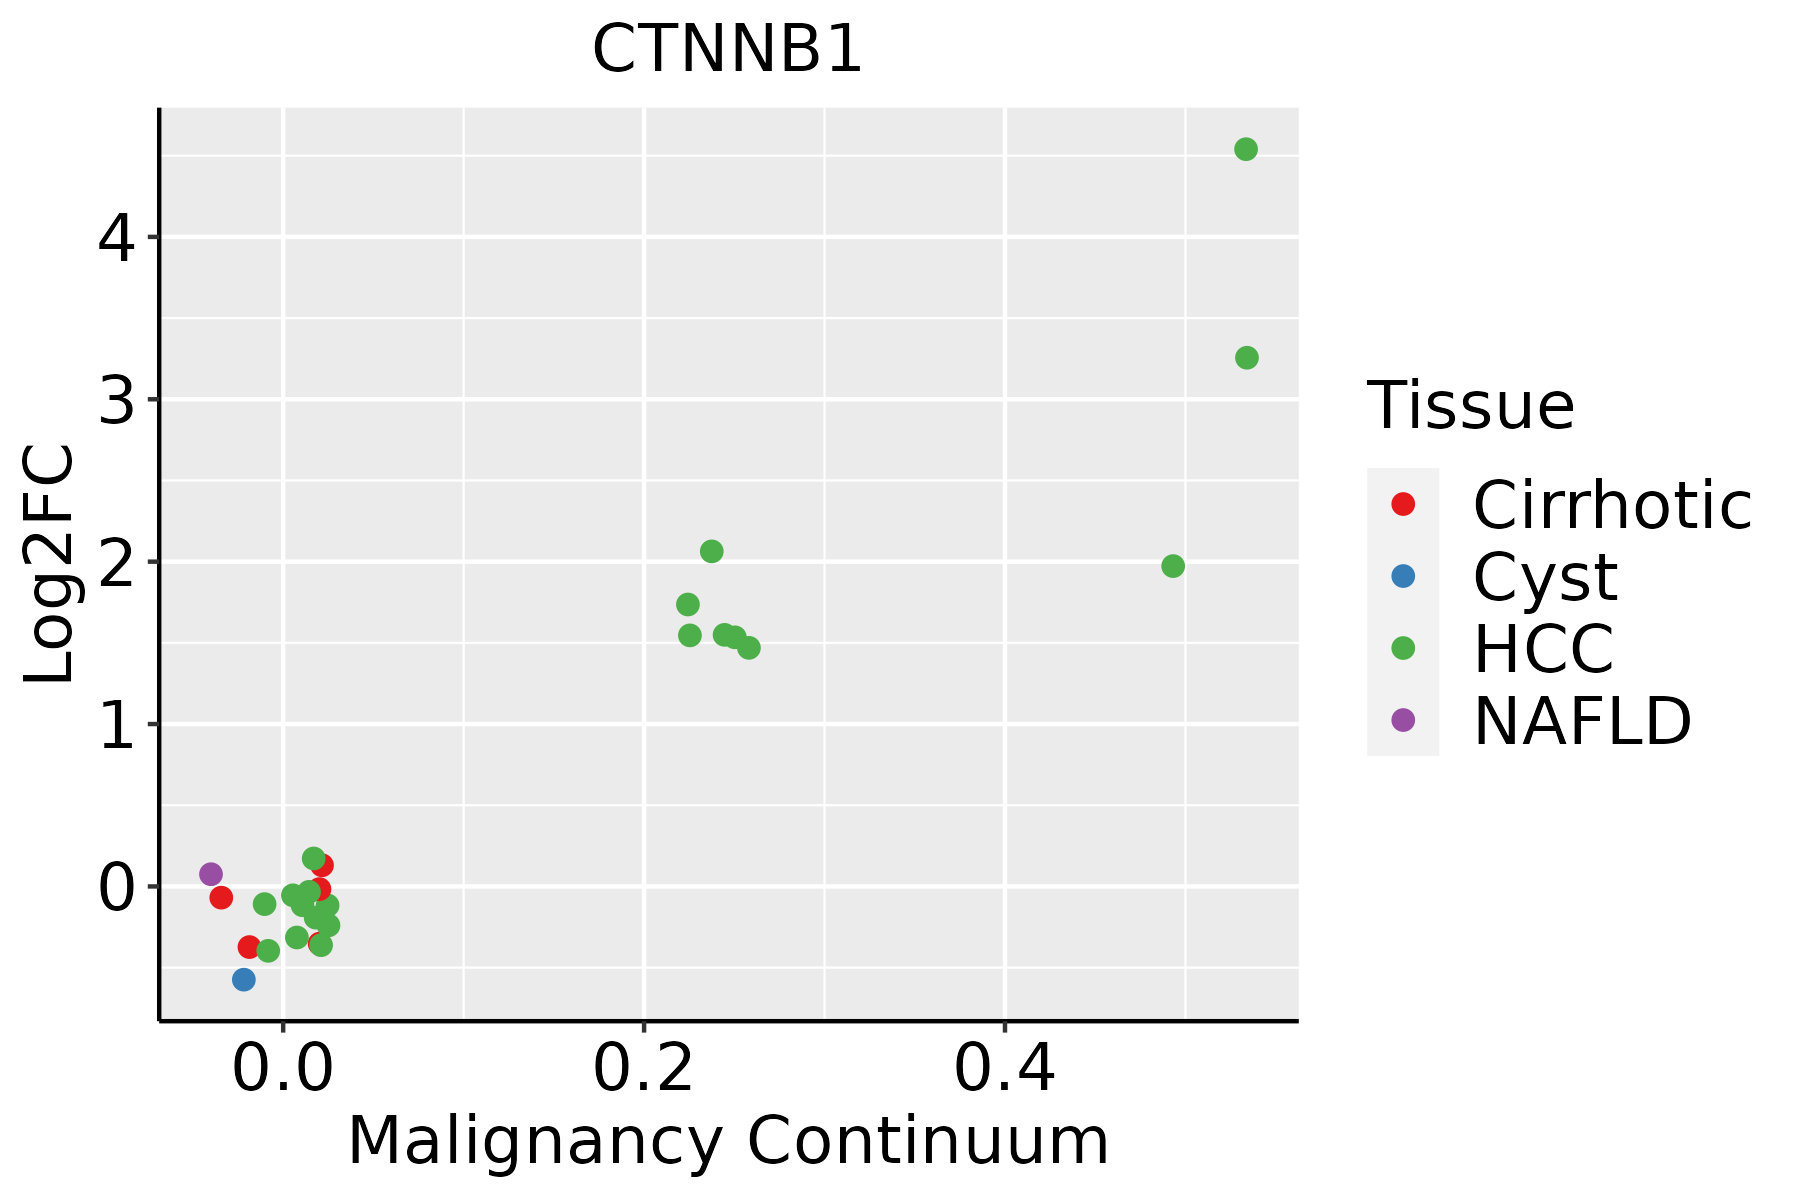 | HCC: Hepatocellular carcinoma |
| NAFLD: Non-alcoholic fatty liver disease | ||
| Lung | 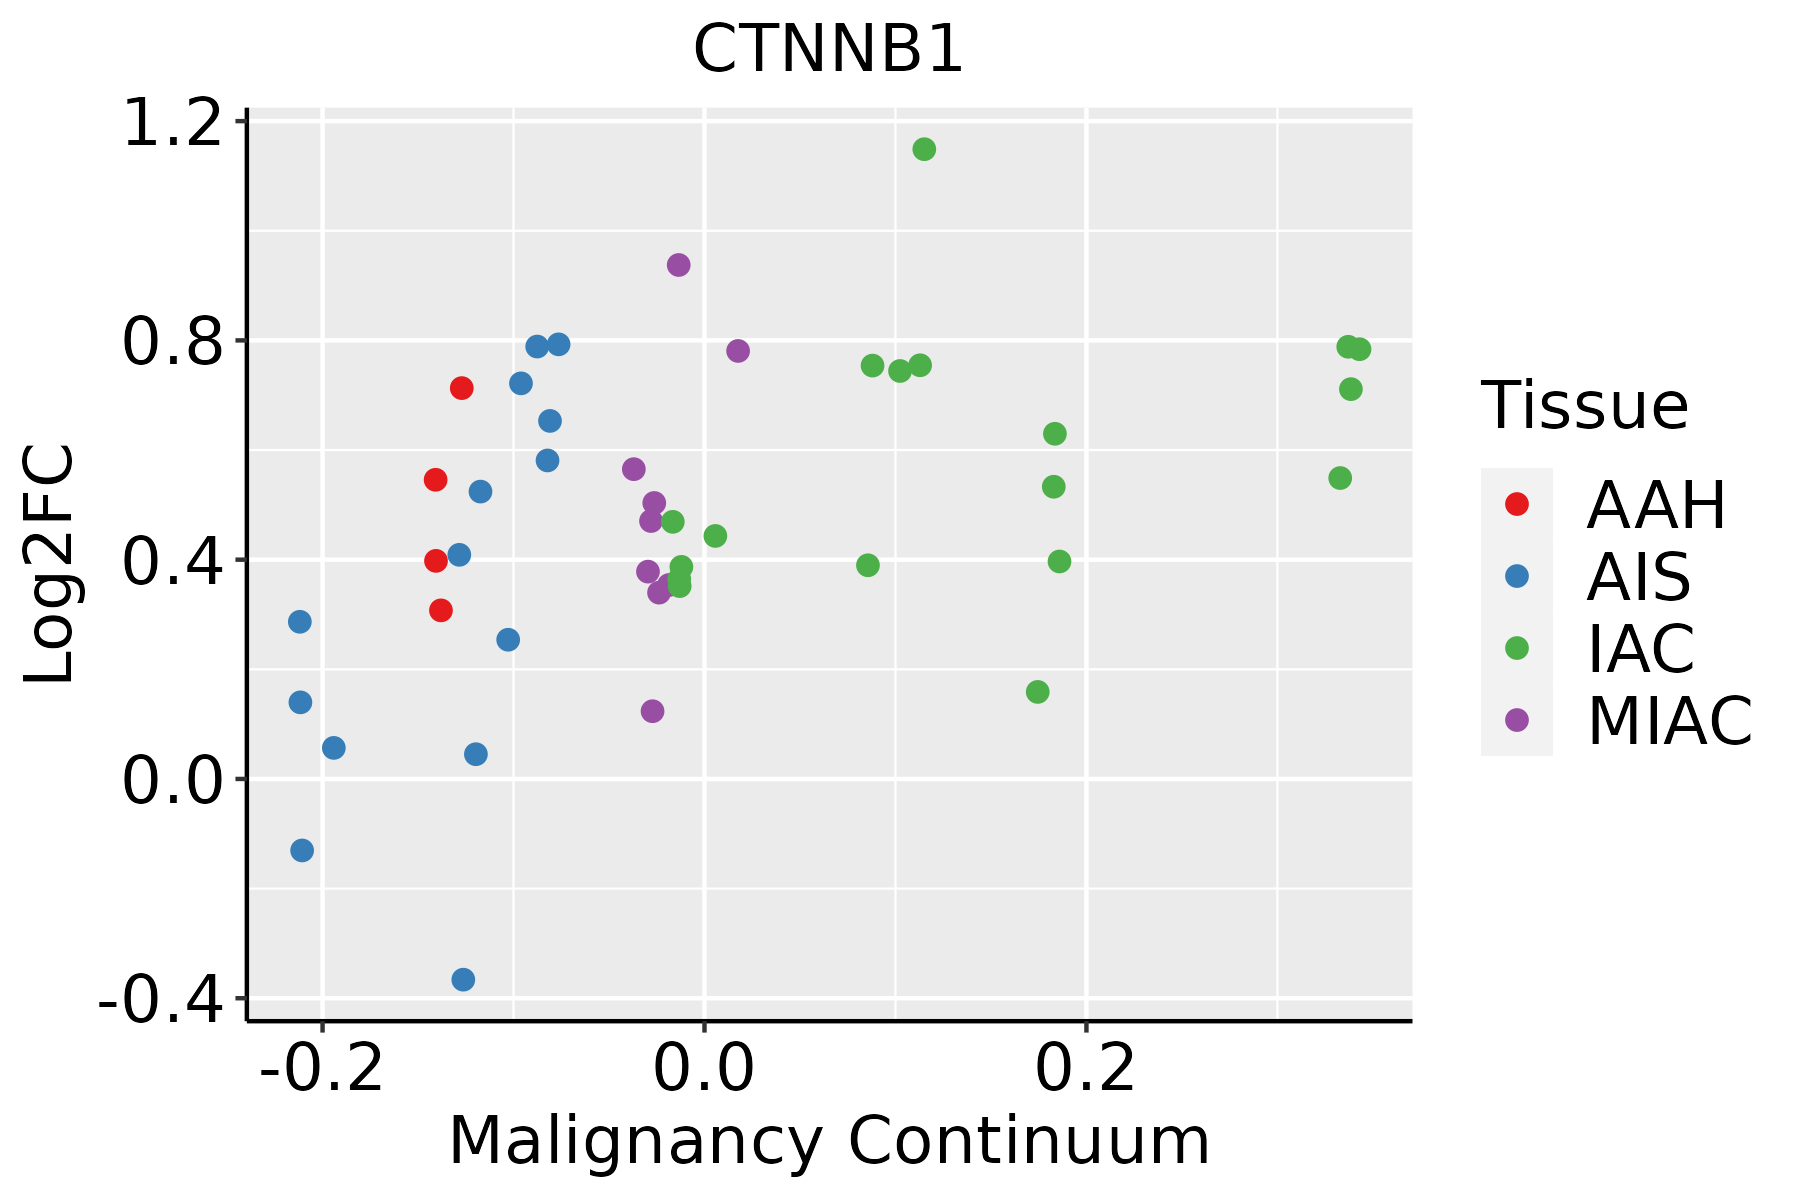 | AAH: Atypical adenomatous hyperplasia |
| AIS: Adenocarcinoma in situ | ||
| IAC: Invasive lung adenocarcinoma | ||
| MIA: Minimally invasive adenocarcinoma | ||
| Oral Cavity | 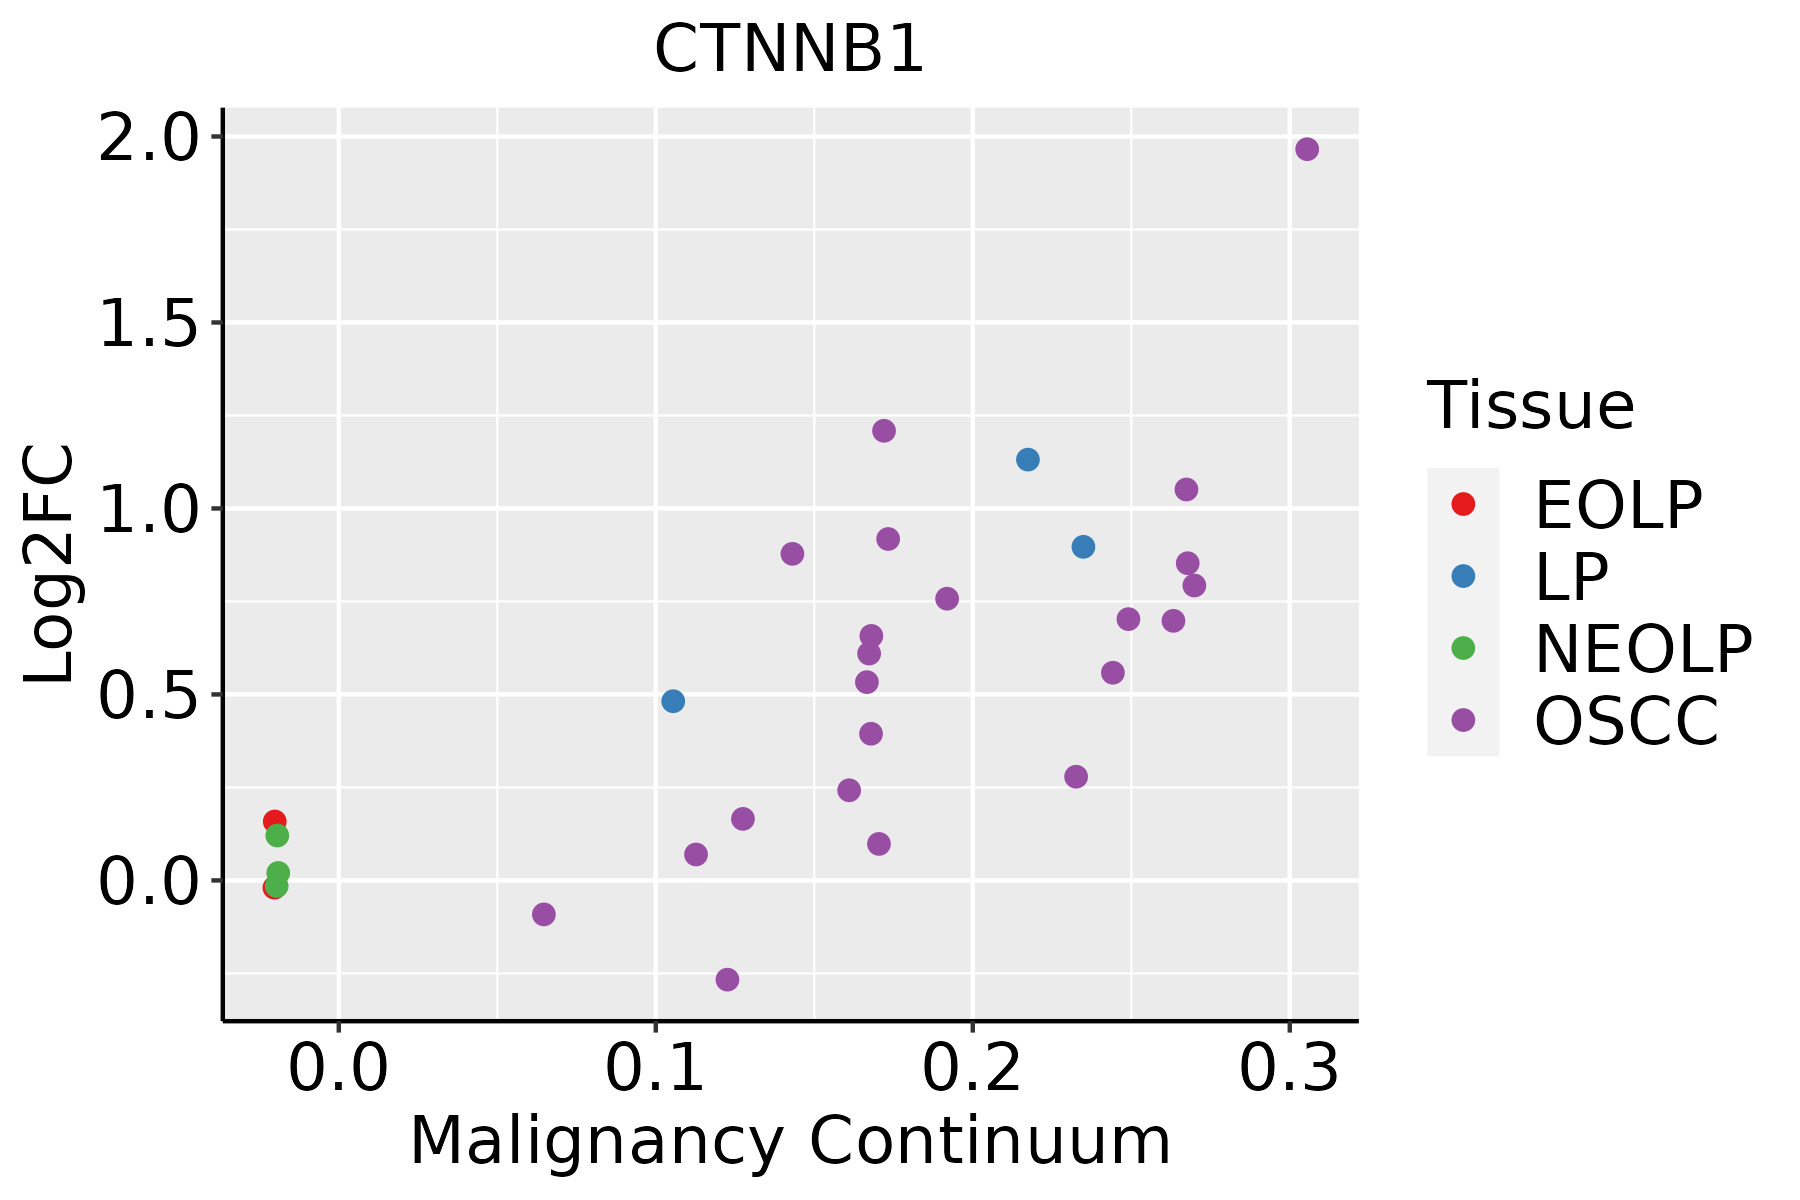 | EOLP: Erosive Oral lichen planus |
| LP: leukoplakia | ||
| NEOLP: Non-erosive oral lichen planus | ||
| OSCC: Oral squamous cell carcinoma | ||
| Prostate | 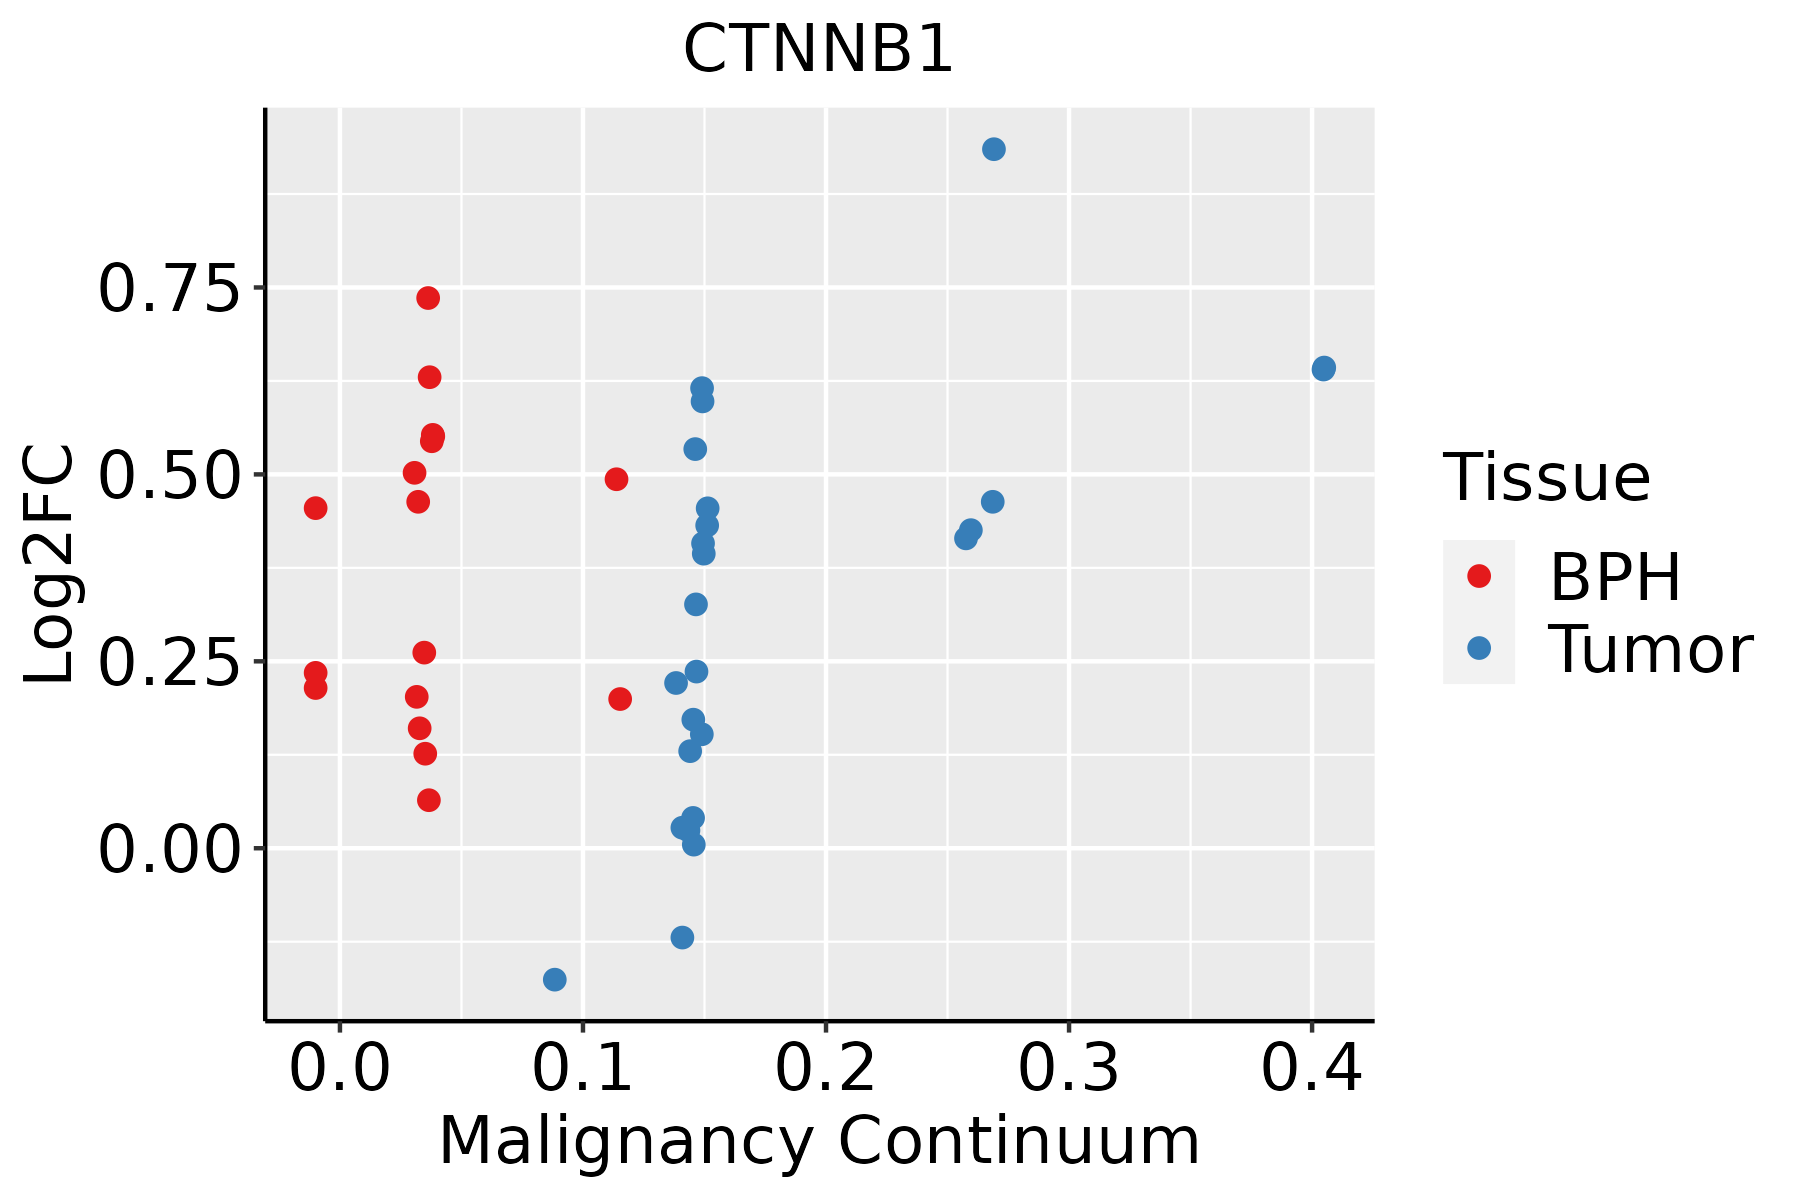 | BPH: Benign Prostatic Hyperplasia |
| Skin | 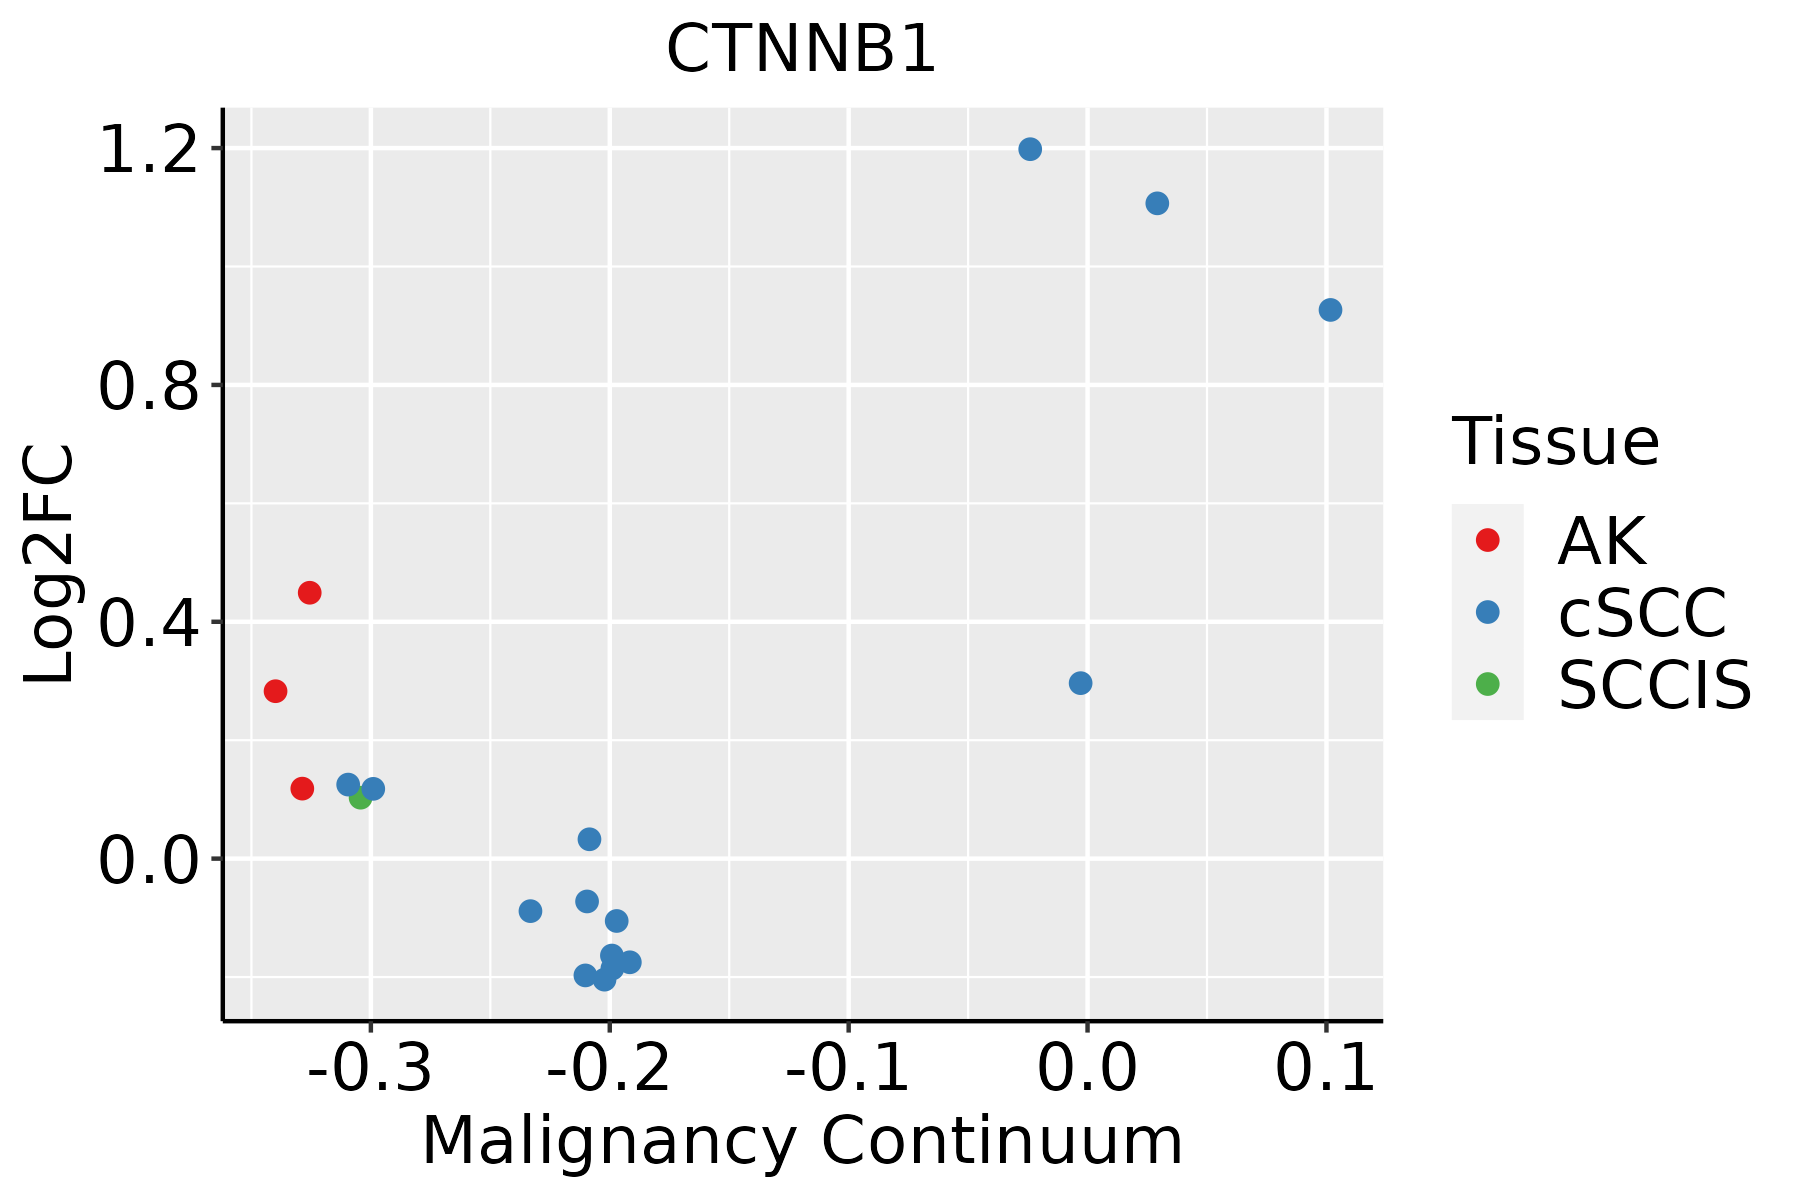 | AK: Actinic keratosis |
| cSCC: Cutaneous squamous cell carcinoma | ||
| SCCIS:squamous cell carcinoma in situ | ||
| Thyroid | 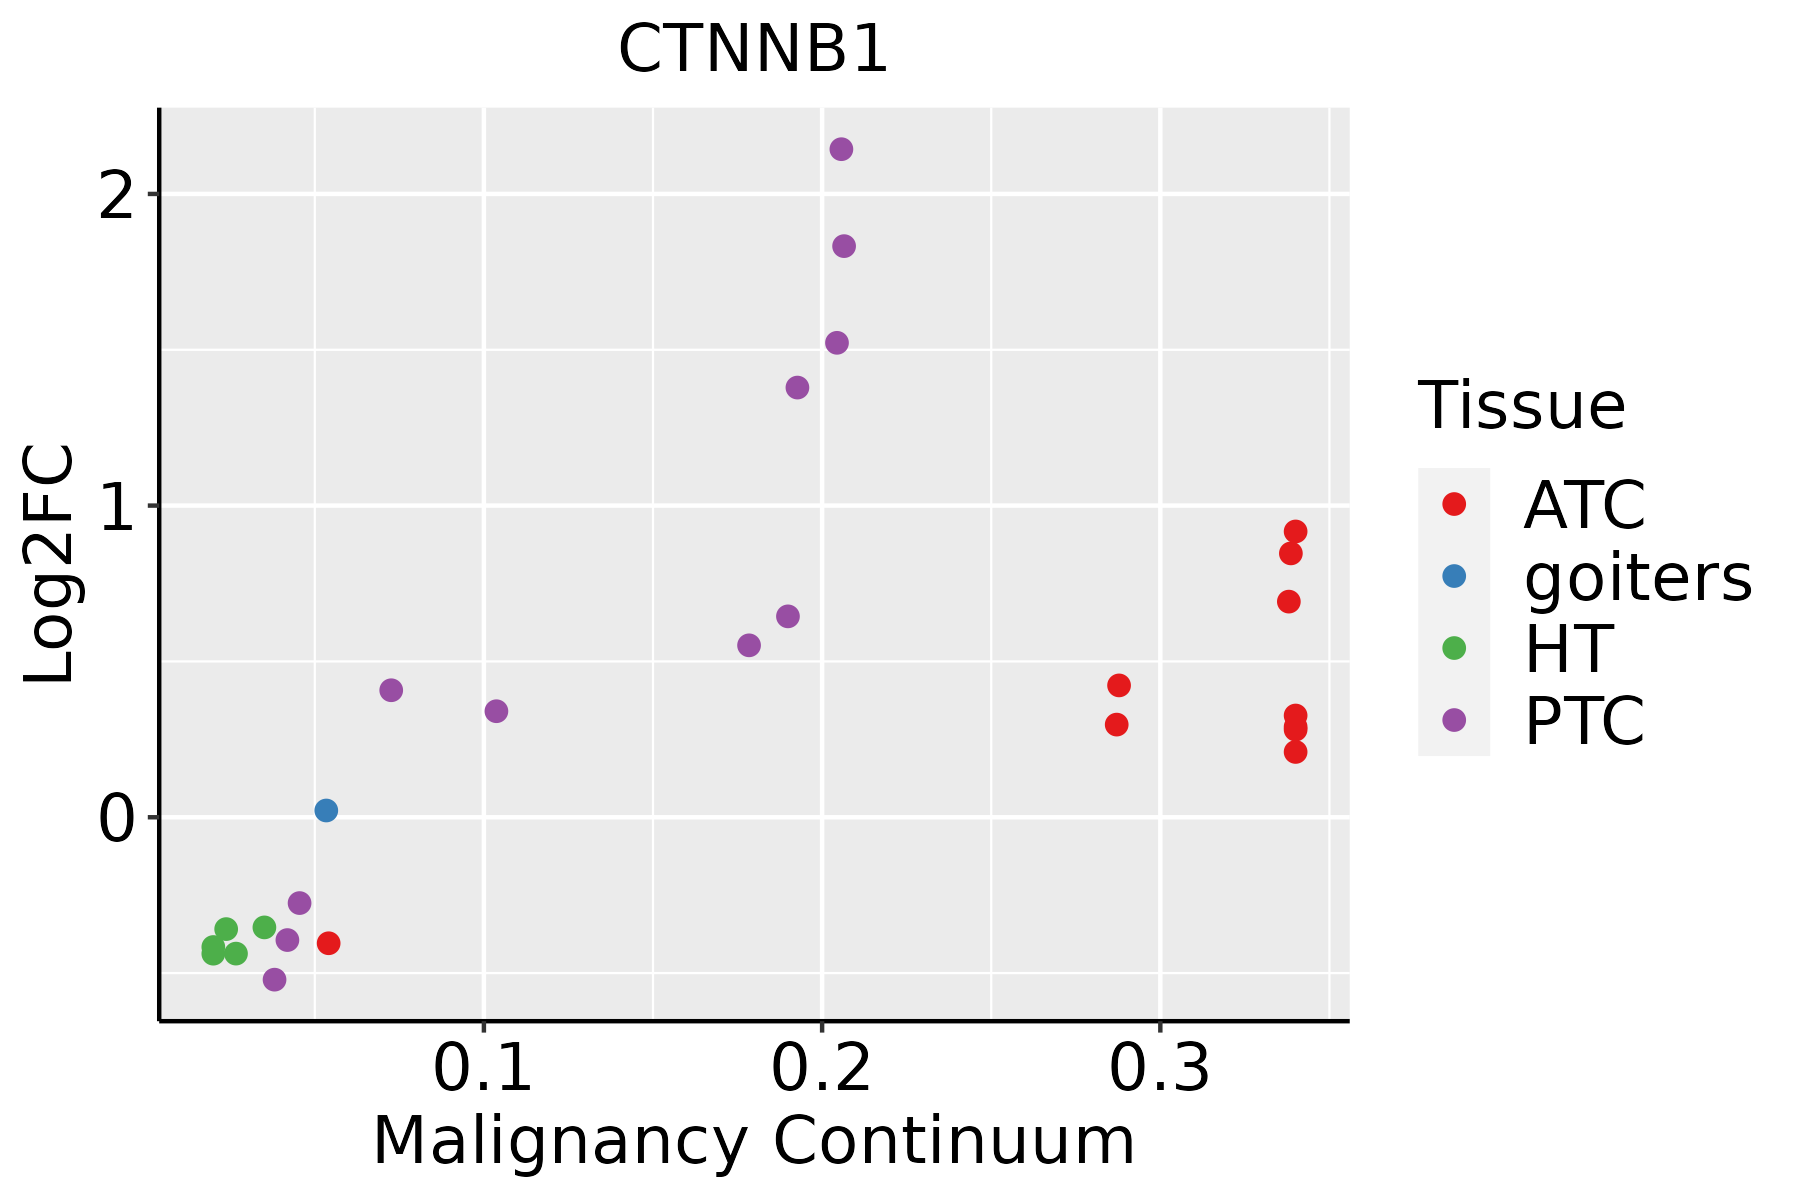 | ATC: Anaplastic thyroid cancer |
| HT: Hashimoto's thyroiditis | ||
| PTC: Papillary thyroid cancer |
| ∗log2FC in expression of this searched gene in stem-like cells from each diseased tissue sample relative to stem-like cells in normal samples in each tissue plotted against the malignancy continuum. Samples are colored based on if they are from different disease stage. |
Top |
Malignant transformation related pathway analysis |
| Find out the enriched GO biological processes and KEGG pathways involved in transition from healthy to precancer to cancer |
| Tissue | Disease Stage | Enriched GO biological Processes |
| Colorectum | AD |  |
| Colorectum | SER |  |
| Colorectum | MSS |  |
| Colorectum | MSI-H |  |
| Colorectum | FAP |  |
| ∗Top 15 enriched GO BP terms are showed in the bar plot of each disease state in each tissue. Each row represents a significant GO biological process which is colored according to the -log10(p.adjust). |
| Page: 1 2 3 4 5 6 7 8 9 |
| GO ID | Tissue | Disease Stage | Description | Gene Ratio | Bg Ratio | pvalue | p.adjust | Count |
| GO:005165620 | Thyroid | PTC | establishment of organelle localization | 193/5968 | 390/18723 | 2.21e-13 | 1.15e-11 | 193 |
| GO:2001234113 | Thyroid | PTC | negative regulation of apoptotic signaling pathway | 124/5968 | 224/18723 | 2.57e-13 | 1.32e-11 | 124 |
| GO:0034599113 | Thyroid | PTC | cellular response to oxidative stress | 151/5968 | 288/18723 | 2.82e-13 | 1.43e-11 | 151 |
| GO:000020920 | Thyroid | PTC | protein polyubiquitination | 128/5968 | 236/18723 | 7.81e-13 | 3.65e-11 | 128 |
| GO:000635416 | Thyroid | PTC | DNA-templated transcription, elongation | 62/5968 | 91/18723 | 1.30e-12 | 5.91e-11 | 62 |
| GO:0051099113 | Thyroid | PTC | positive regulation of binding | 100/5968 | 173/18723 | 1.56e-12 | 6.96e-11 | 100 |
| GO:0016049112 | Thyroid | PTC | cell growth | 225/5968 | 482/18723 | 4.75e-12 | 2.07e-10 | 225 |
| GO:000734619 | Thyroid | PTC | regulation of mitotic cell cycle | 212/5968 | 457/18723 | 4.03e-11 | 1.44e-09 | 212 |
| GO:003304419 | Thyroid | PTC | regulation of chromosome organization | 102/5968 | 187/18723 | 1.04e-10 | 3.58e-09 | 102 |
| GO:0001701111 | Thyroid | PTC | in utero embryonic development | 175/5968 | 367/18723 | 1.40e-10 | 4.73e-09 | 175 |
| GO:000636816 | Thyroid | PTC | transcription elongation from RNA polymerase II promoter | 48/5968 | 69/18723 | 1.43e-10 | 4.81e-09 | 48 |
| GO:005105218 | Thyroid | PTC | regulation of DNA metabolic process | 171/5968 | 359/18723 | 2.52e-10 | 8.33e-09 | 171 |
| GO:0070997113 | Thyroid | PTC | neuron death | 171/5968 | 361/18723 | 4.32e-10 | 1.38e-08 | 171 |
| GO:005165019 | Thyroid | PTC | establishment of vesicle localization | 89/5968 | 161/18723 | 6.38e-10 | 1.97e-08 | 89 |
| GO:0032204110 | Thyroid | PTC | regulation of telomere maintenance | 52/5968 | 80/18723 | 1.15e-09 | 3.34e-08 | 52 |
| GO:1903321113 | Thyroid | PTC | negative regulation of protein modification by small protein conjugation or removal | 59/5968 | 95/18723 | 1.26e-09 | 3.63e-08 | 59 |
| GO:0031589111 | Thyroid | PTC | cell-substrate adhesion | 169/5968 | 363/18723 | 2.73e-09 | 7.57e-08 | 169 |
| GO:00327846 | Thyroid | PTC | regulation of DNA-templated transcription, elongation | 38/5968 | 53/18723 | 3.07e-09 | 8.43e-08 | 38 |
| GO:005164817 | Thyroid | PTC | vesicle localization | 94/5968 | 177/18723 | 3.54e-09 | 9.45e-08 | 94 |
| GO:1901214113 | Thyroid | PTC | regulation of neuron death | 151/5968 | 319/18723 | 4.74e-09 | 1.24e-07 | 151 |
| Page: 1 2 3 4 5 6 7 8 9 10 11 12 13 14 15 16 17 18 19 20 21 22 23 24 25 26 27 28 29 30 31 32 33 34 35 36 37 38 39 40 41 42 43 44 45 46 47 48 49 50 51 52 53 54 55 56 57 58 59 60 61 62 63 64 65 66 67 68 69 70 71 72 73 74 75 76 77 78 79 80 81 82 83 84 85 86 87 88 89 90 91 92 93 94 95 96 97 98 99 100 101 102 103 104 105 106 107 108 109 110 111 112 113 114 115 116 117 118 119 120 121 122 123 124 125 126 127 128 129 130 131 132 133 134 135 136 137 138 139 140 141 142 143 144 145 146 147 148 149 150 151 152 153 154 155 156 157 158 159 160 161 162 163 164 165 166 167 168 169 170 171 172 173 174 175 176 177 178 179 180 181 182 183 184 185 186 187 188 189 190 191 192 193 194 195 196 197 198 199 200 201 202 203 204 205 206 207 208 209 210 211 |
| Pathway ID | Tissue | Disease Stage | Description | Gene Ratio | Bg Ratio | pvalue | p.adjust | qvalue | Count |
| hsa0501016 | Breast | Precancer | Alzheimer disease | 103/684 | 384/8465 | 1.03e-29 | 4.66e-28 | 3.57e-28 | 103 |
| hsa0502216 | Breast | Precancer | Pathways of neurodegeneration - multiple diseases | 112/684 | 476/8465 | 6.96e-27 | 2.44e-25 | 1.87e-25 | 112 |
| hsa0513218 | Breast | Precancer | Salmonella infection | 49/684 | 249/8465 | 2.92e-09 | 6.15e-08 | 4.71e-08 | 49 |
| hsa0516718 | Breast | Precancer | Kaposi sarcoma-associated herpesvirus infection | 36/684 | 194/8465 | 1.68e-06 | 2.53e-05 | 1.94e-05 | 36 |
| hsa0541818 | Breast | Precancer | Fluid shear stress and atherosclerosis | 28/684 | 139/8465 | 4.74e-06 | 6.00e-05 | 4.59e-05 | 28 |
| hsa0510018 | Breast | Precancer | Bacterial invasion of epithelial cells | 16/684 | 77/8465 | 3.55e-04 | 2.80e-03 | 2.15e-03 | 16 |
| hsa0467018 | Breast | Precancer | Leukocyte transendothelial migration | 20/684 | 114/8465 | 7.26e-04 | 5.33e-03 | 4.09e-03 | 20 |
| hsa0520514 | Breast | Precancer | Proteoglycans in cancer | 30/684 | 205/8465 | 1.00e-03 | 7.18e-03 | 5.50e-03 | 30 |
| hsa0452018 | Breast | Precancer | Adherens junction | 17/684 | 93/8465 | 1.11e-03 | 7.57e-03 | 5.80e-03 | 17 |
| hsa0516316 | Breast | Precancer | Human cytomegalovirus infection | 32/684 | 225/8465 | 1.13e-03 | 7.57e-03 | 5.80e-03 | 32 |
| hsa0501017 | Breast | Precancer | Alzheimer disease | 103/684 | 384/8465 | 1.03e-29 | 4.66e-28 | 3.57e-28 | 103 |
| hsa0502217 | Breast | Precancer | Pathways of neurodegeneration - multiple diseases | 112/684 | 476/8465 | 6.96e-27 | 2.44e-25 | 1.87e-25 | 112 |
| hsa0513219 | Breast | Precancer | Salmonella infection | 49/684 | 249/8465 | 2.92e-09 | 6.15e-08 | 4.71e-08 | 49 |
| hsa0516719 | Breast | Precancer | Kaposi sarcoma-associated herpesvirus infection | 36/684 | 194/8465 | 1.68e-06 | 2.53e-05 | 1.94e-05 | 36 |
| hsa0541819 | Breast | Precancer | Fluid shear stress and atherosclerosis | 28/684 | 139/8465 | 4.74e-06 | 6.00e-05 | 4.59e-05 | 28 |
| hsa0510019 | Breast | Precancer | Bacterial invasion of epithelial cells | 16/684 | 77/8465 | 3.55e-04 | 2.80e-03 | 2.15e-03 | 16 |
| hsa0467019 | Breast | Precancer | Leukocyte transendothelial migration | 20/684 | 114/8465 | 7.26e-04 | 5.33e-03 | 4.09e-03 | 20 |
| hsa0520515 | Breast | Precancer | Proteoglycans in cancer | 30/684 | 205/8465 | 1.00e-03 | 7.18e-03 | 5.50e-03 | 30 |
| hsa0452019 | Breast | Precancer | Adherens junction | 17/684 | 93/8465 | 1.11e-03 | 7.57e-03 | 5.80e-03 | 17 |
| hsa0516317 | Breast | Precancer | Human cytomegalovirus infection | 32/684 | 225/8465 | 1.13e-03 | 7.57e-03 | 5.80e-03 | 32 |
| Page: 1 2 3 4 5 6 7 8 9 10 11 12 13 14 15 16 17 18 19 20 21 22 23 24 25 26 27 28 29 30 31 32 33 34 35 36 37 38 39 40 41 42 43 |
Top |
Cell-cell communication analysis |
| Identification of potential cell-cell interactions between two cell types and their ligand-receptor pairs for different disease states |
| Ligand | Receptor | LRpair | Pathway | Tissue | Disease Stage |
| Page: 1 |
Top |
Single-cell gene regulatory network inference analysis |
| Find out the significant the regulons (TFs) and the target genes of each regulon across cell types for different disease states |
| TF | Cell Type | Tissue | Disease Stage | Target Gene | RSS | Regulon Activity |
| CTNNB1 | NK | Endometrium | ADJ | GALNT2,PLEKHA5,SEC14L1, etc. | 4.03e-01 |  |
| CTNNB1 | GDT | Endometrium | AEH | GALNT2,PLEKHA5,SEC14L1, etc. | 2.12e-01 |  |
| CTNNB1 | NK | Endometrium | AEH | GALNT2,PLEKHA5,SEC14L1, etc. | 1.16e-01 | |
| CTNNB1 | GDT | Endometrium | EEC | GALNT2,PLEKHA5,SEC14L1, etc. | 1.23e-01 |  |
| CTNNB1 | NK | Endometrium | EEC | GALNT2,PLEKHA5,SEC14L1, etc. | 5.56e-02 | |
| ∗The dot plots of a searched regulon are shown for all cell subpopulations in each disease state of each tissue based on the regulon specific score inferred using pySCENIC and by calculating the average expression. |
| Page: 1 |
Top |
Somatic mutation of malignant transformation related genes |
| Annotation of somatic variants for genes involved in malignant transformation |
| Hugo Symbol | Variant Class | Variant Classification | dbSNP RS | HGVSc | HGVSp | HGVSp Short | SWISSPROT | BIOTYPE | SIFT | PolyPhen | Tumor Sample Barcode | Tissue | Histology | Sex | Age | Stage | Therapy Types | Drugs | Outcome |
| CTNNB1 | SNV | Missense_Mutation | c.2212G>A | p.Glu738Lys | p.E738K | P35222 | protein_coding | tolerated_low_confidence(0.24) | benign(0.015) | TCGA-A7-A26H-01 | Breast | breast invasive carcinoma | Female | >=65 | I/II | Hormone Therapy | anastrozole | PD | |
| CTNNB1 | SNV | Missense_Mutation | rs760527240 | c.292A>G | p.Met98Val | p.M98V | P35222 | protein_coding | tolerated(0.1) | benign(0.059) | TCGA-EW-A6SD-01 | Breast | breast invasive carcinoma | Female | <65 | I/II | Chemotherapy | tch | SD |
| CTNNB1 | SNV | Missense_Mutation | novel | c.1274N>G | p.Ser425Cys | p.S425C | P35222 | protein_coding | deleterious(0.01) | possibly_damaging(0.638) | TCGA-C5-A1MH-01 | Cervix | cervical & endocervical cancer | Female | >=65 | III/IV | Chemotherapy | cisplatin | PD |
| CTNNB1 | SNV | Missense_Mutation | rs121913412 | c.121N>G | p.Thr41Ala | p.T41A | P35222 | protein_coding | deleterious(0) | possibly_damaging(0.694) | TCGA-EA-A410-01 | Cervix | cervical & endocervical cancer | Female | <65 | I/II | Unknown | Unknown | SD |
| CTNNB1 | SNV | Missense_Mutation | rs121913403 | c.110C>G | p.Ser37Cys | p.S37C | P35222 | protein_coding | deleterious(0) | probably_damaging(1) | TCGA-IR-A3LA-01 | Cervix | cervical & endocervical cancer | Female | <65 | I/II | Chemotherapy | cisplatin | CR |
| CTNNB1 | SNV | Missense_Mutation | rs755119590 | c.1937C>G | p.Ser646Cys | p.S646C | P35222 | protein_coding | deleterious(0.02) | benign(0.3) | TCGA-IR-A3LA-01 | Cervix | cervical & endocervical cancer | Female | <65 | I/II | Chemotherapy | cisplatin | CR |
| CTNNB1 | SNV | Missense_Mutation | rs121913396 | c.95N>G | p.Asp32Gly | p.D32G | P35222 | protein_coding | deleterious(0.01) | probably_damaging(0.984) | TCGA-JW-A5VH-01 | Cervix | cervical & endocervical cancer | Female | <65 | I/II | Chemotherapy | carboplatin | PD |
| CTNNB1 | SNV | Missense_Mutation | rs121913409 | c.134C>T | p.Ser45Phe | p.S45F | P35222 | protein_coding | deleterious(0) | probably_damaging(0.928) | TCGA-4N-A93T-01 | Colorectum | colon adenocarcinoma | Male | >=65 | III/IV | Chemotherapy | xeloda | SD |
| CTNNB1 | SNV | Missense_Mutation | c.1060N>C | p.Lys354Gln | p.K354Q | P35222 | protein_coding | deleterious(0) | probably_damaging(0.999) | TCGA-A6-2682-01 | Colorectum | colon adenocarcinoma | Male | >=65 | III/IV | Chemotherapy | 5 | PD | |
| CTNNB1 | SNV | Missense_Mutation | novel | c.782N>C | p.Asn261Thr | p.N261T | P35222 | protein_coding | deleterious(0.01) | probably_damaging(0.979) | TCGA-A6-6141-01 | Colorectum | colon adenocarcinoma | Male | <65 | I/II | Chemotherapy | 5-fu | SD |
| Page: 1 2 3 4 5 6 7 8 9 10 11 12 13 14 15 16 17 18 19 20 21 22 23 24 25 26 27 28 29 30 31 32 33 34 35 36 |
Top |
Related drugs of malignant transformation related genes |
| Identification of chemicals and drugs interact with genes involved in malignant transfromation |
| (DGIdb 4.0) |
| Entrez ID | Symbol | Category | Interaction Types | Drug Claim Name | Drug Name | PMIDs |
| 1499 | CTNNB1 | CLINICALLY ACTIONABLE, TRANSCRIPTION FACTOR, TRANSCRIPTION FACTOR COMPLEX, DRUGGABLE GENOME, DRUG RESISTANCE | NVP-TNKS656 | 26224873 | ||
| 1499 | CTNNB1 | CLINICALLY ACTIONABLE, TRANSCRIPTION FACTOR, TRANSCRIPTION FACTOR COMPLEX, DRUGGABLE GENOME, DRUG RESISTANCE | BC21 | 22224445 | ||
| 1499 | CTNNB1 | CLINICALLY ACTIONABLE, TRANSCRIPTION FACTOR, TRANSCRIPTION FACTOR COMPLEX, DRUGGABLE GENOME, DRUG RESISTANCE | Triciribine | TRICIRIBINE | 26224873 | |
| 1499 | CTNNB1 | CLINICALLY ACTIONABLE, TRANSCRIPTION FACTOR, TRANSCRIPTION FACTOR COMPLEX, DRUGGABLE GENOME, DRUG RESISTANCE | CEQ508 | |||
| 1499 | CTNNB1 | CLINICALLY ACTIONABLE, TRANSCRIPTION FACTOR, TRANSCRIPTION FACTOR COMPLEX, DRUGGABLE GENOME, DRUG RESISTANCE | dexamethasone | DEXAMETHASONE | 26521987 | |
| 1499 | CTNNB1 | CLINICALLY ACTIONABLE, TRANSCRIPTION FACTOR, TRANSCRIPTION FACTOR COMPLEX, DRUGGABLE GENOME, DRUG RESISTANCE | ANTI-PD-L1 MONOCLONAL ANTIBODY | 25970248 | ||
| 1499 | CTNNB1 | CLINICALLY ACTIONABLE, TRANSCRIPTION FACTOR, TRANSCRIPTION FACTOR COMPLEX, DRUGGABLE GENOME, DRUG RESISTANCE | EOSIN_Y | EOSIN_Y | 22889313 | |
| 1499 | CTNNB1 | CLINICALLY ACTIONABLE, TRANSCRIPTION FACTOR, TRANSCRIPTION FACTOR COMPLEX, DRUGGABLE GENOME, DRUG RESISTANCE | (+/-)-HYDNOCARPIN | CHEMBL91638 | 24018191 | |
| 1499 | CTNNB1 | CLINICALLY ACTIONABLE, TRANSCRIPTION FACTOR, TRANSCRIPTION FACTOR COMPLEX, DRUGGABLE GENOME, DRUG RESISTANCE | ANTI-CTLA-4 MONOCLONAL ANTIBODY | 25970248 | ||
| 1499 | CTNNB1 | CLINICALLY ACTIONABLE, TRANSCRIPTION FACTOR, TRANSCRIPTION FACTOR COMPLEX, DRUGGABLE GENOME, DRUG RESISTANCE | FLUORESCEIN SODIUM | FLUORESCEIN SODIUM | 22889313 |
| Page: 1 2 3 |

Copyright 2023-Present -The University of Texas Health Science Center at Houston |