Schematic overview of the cellular and molecular mechanisms involved in the cancer progression, including the proposed cellular and molecular mechanisms in cancer cells trajectory. AT1: alveolar type 1 cells; AT2: alveolar type 2 cells; AAH: atypical adenomatous hyperplasia; AIS: adenocarcinoma in situ; MIA: minimally invasive adenocarcinoma; IA: invasive adenocarcinoma; EMT: epithelial-mesenchymal transition

Home

Download

Statistics

Help

Contact

Center for Computational Systems Medicine
leaf

Gene summary

leaf

Malignant transformation analysis

leaf

Malignant transformation related pathway analysis

leaf

Cell-cell communication analysis

leaf

Single-cell gene regulatory network inference analysis

leaf

Somatic mutation of malignant transformation related genes

leaf

Related drugs of malignant transformation related genes

Gene: STOML2

Gene summary for STOML2

check button Gene summary.

Gene informationSpeciesHuman
Gene symbol

STOML2

Gene ID

30968

Gene namestomatin like 2
Gene AliasHSPC108
Cytomap9p13.3
Gene Typeprotein-coding
GO ID

GO:0001775

UniProtAcc

Q9UJZ1


Top

Malignant transformation analysis

check button Identification of the aberrant gene expression in precancerous and cancerous lesions by comparing the gene expression of stem-like cells in diseased tissues with normal stem cells
check button Malignant transformation involving gene list.
Entrez IDSymbolReplicatesSpeciesOrganTissueAdj P-valueLog2FCMalignancy
30968STOML2GSM4909281HumanBreastIDC4.34e-093.78e-010.21
30968STOML2GSM4909282HumanBreastIDC1.61e-386.86e-01-0.0288
30968STOML2GSM4909285HumanBreastIDC6.64e-194.19e-010.21
30968STOML2GSM4909288HumanBreastIDC3.62e-094.12e-010.0988
30968STOML2GSM4909290HumanBreastIDC2.28e-094.83e-010.2096
30968STOML2GSM4909292HumanBreastIDC6.33e-107.66e-010.1236
30968STOML2GSM4909293HumanBreastIDC5.19e-042.61e-010.1581
30968STOML2GSM4909296HumanBreastIDC7.03e-118.27e-020.1524
30968STOML2GSM4909297HumanBreastIDC1.70e-14-7.85e-020.1517
30968STOML2GSM4909304HumanBreastIDC3.72e-073.50e-010.1636
30968STOML2GSM4909311HumanBreastIDC2.73e-25-2.03e-010.1534
30968STOML2GSM4909312HumanBreastIDC1.40e-085.91e-020.1552
30968STOML2GSM4909316HumanBreastIDC3.61e-042.39e-030.21
30968STOML2GSM4909319HumanBreastIDC3.17e-39-8.15e-020.1563
30968STOML2GSM4909320HumanBreastIDC4.24e-07-3.95e-030.1575
30968STOML2GSM4909321HumanBreastIDC3.41e-12-8.52e-020.1559
30968STOML2brca1HumanBreastPrecancer9.20e-093.94e-01-0.0338
30968STOML2brca2HumanBreastPrecancer3.19e-052.65e-01-0.024
30968STOML2brca3HumanBreastPrecancer6.80e-042.79e-01-0.0263
30968STOML2NCCBC14HumanBreastDCIS3.36e-06-1.56e-010.2021
Page: 1 2 3 4 5 6 7 8 9 10 11 

check button Transcriptomic changes along malignancy continuum.
TissueExpression DynamicsAbbreviation
BreastThe image shows the transcriptomic changes along malignancy continuum.log2FC in expression of this searched gene in stem-like cells from each diseased tissue sample relative to stem-like cells in normal samples in each tissue plotted against the malignancy continuum. Samples are colored based on if they are from different disease stage.
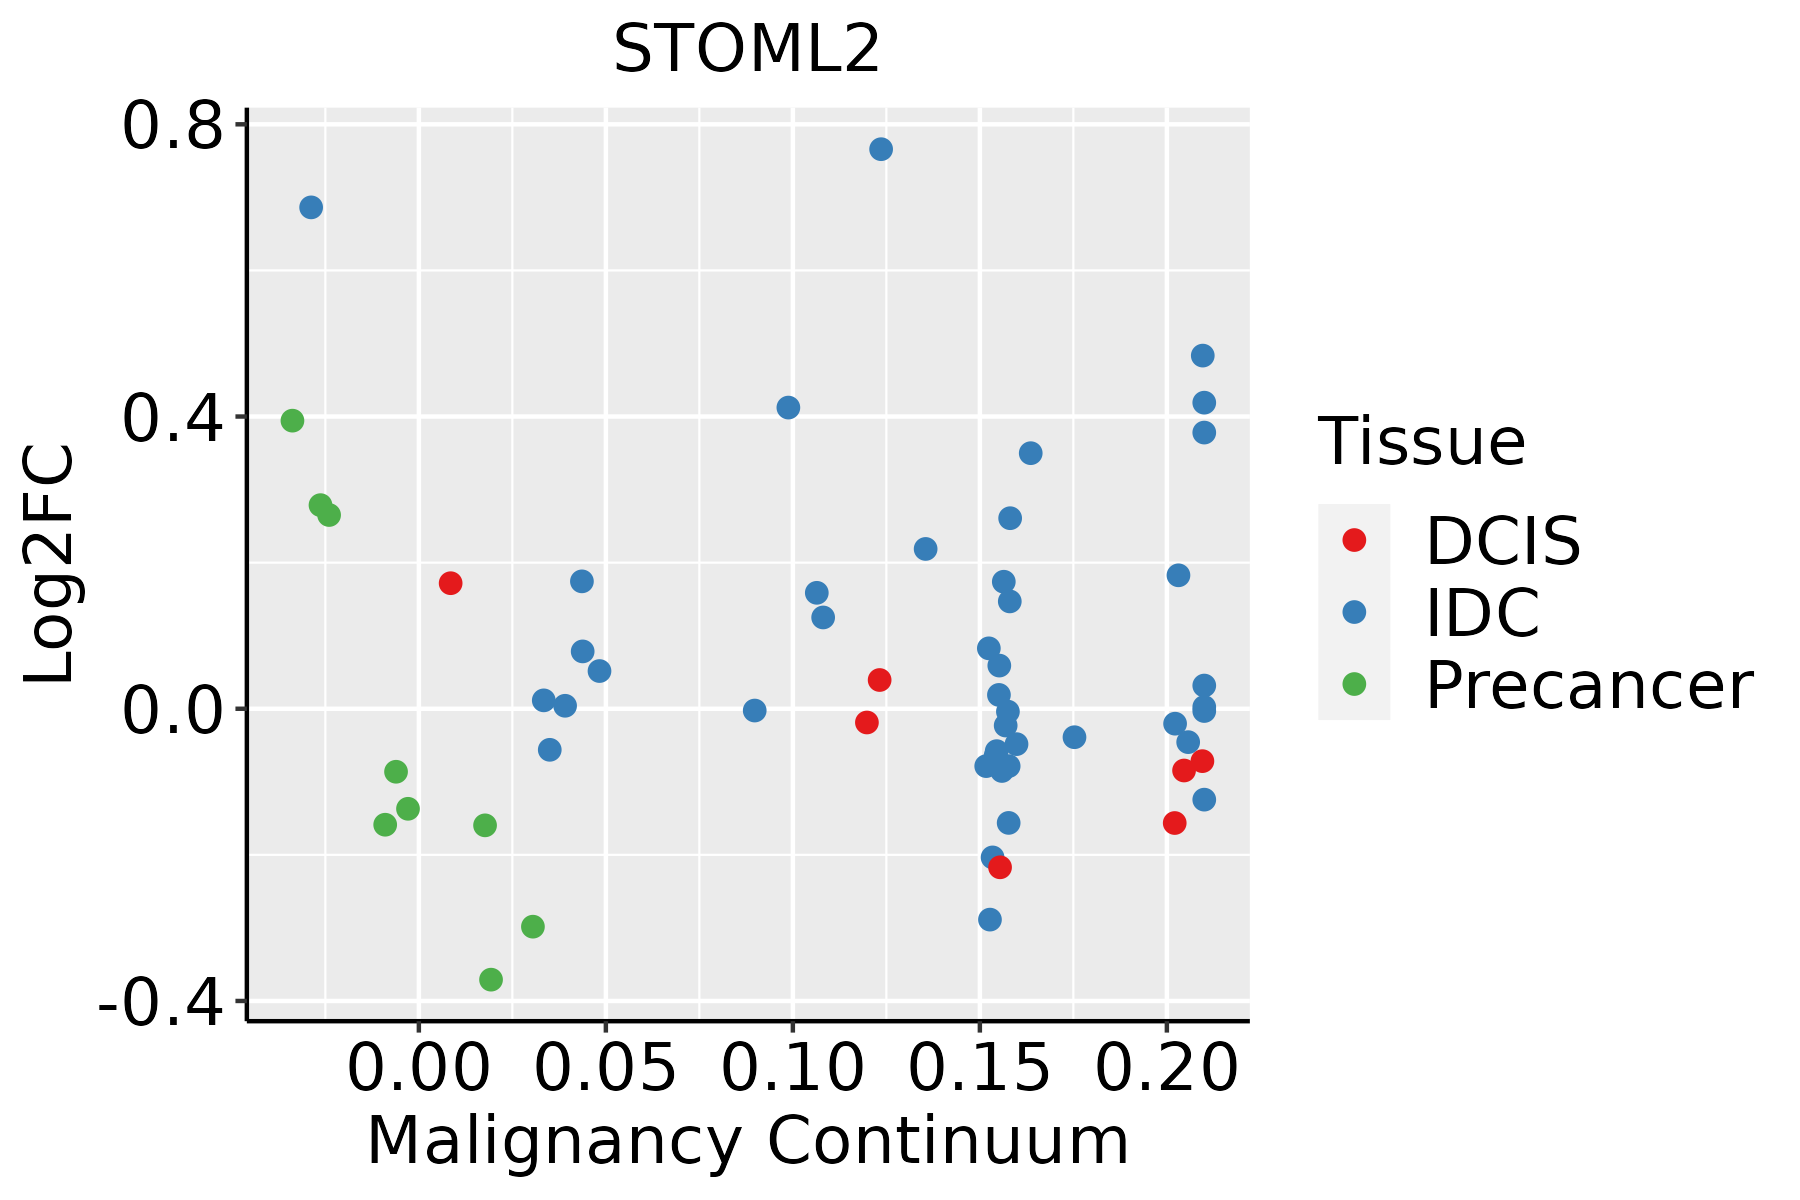
IDC: Invasive ductal carcinoma
DCIS: Ductal carcinoma in situ
Precancer(BRCA1-mut): Precancerous lesion from BRCA1 mutation carriers
Colorectum (GSE201348)The image shows the transcriptomic changes along malignancy continuum.log2FC in expression of this searched gene in stem-like cells from each diseased tissue sample relative to stem-like cells in normal samples in each tissue plotted against the malignancy continuum. Samples are colored based on if they are from different disease stage.FAP: Familial adenomatous polyposis
CRC: Colorectal cancer
Colorectum (HTA11)The image shows the transcriptomic changes along malignancy continuum.log2FC in expression of this searched gene in stem-like cells from each diseased tissue sample relative to stem-like cells in normal samples in each tissue plotted against the malignancy continuum. Samples are colored based on if they are from different disease stage.AD: Adenomas
SER: Sessile serrated lesions
MSI-H: Microsatellite-high colorectal cancer
MSS: Microsatellite stable colorectal cancer
EndometriumThe image shows the transcriptomic changes along malignancy continuum.log2FC in expression of this searched gene in stem-like cells from each diseased tissue sample relative to stem-like cells in normal samples in each tissue plotted against the malignancy continuum. Samples are colored based on if they are from different disease stage.
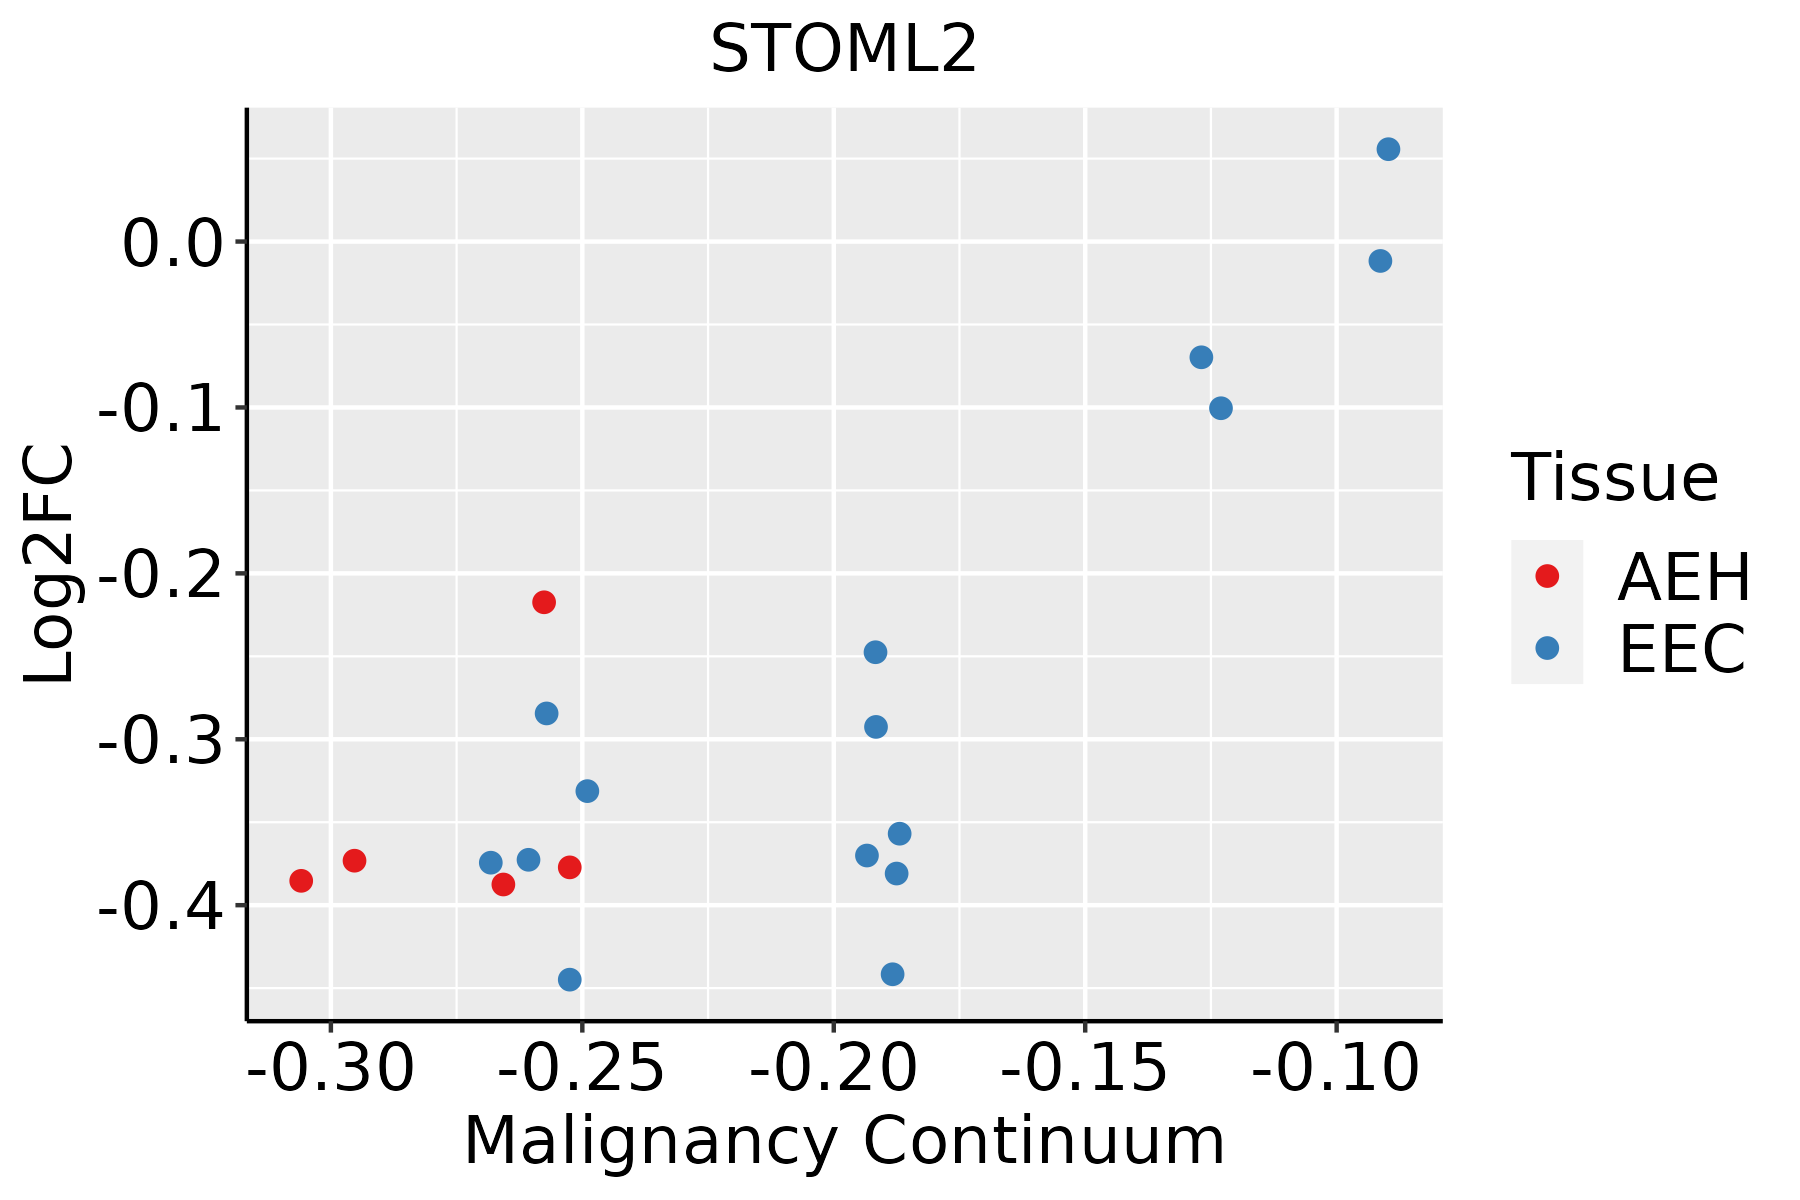
AEH: Atypical endometrial hyperplasia
EEC: Endometrioid Cancer
EsophagusThe image shows the transcriptomic changes along malignancy continuum.log2FC in expression of this searched gene in stem-like cells from each diseased tissue sample relative to stem-like cells in normal samples in each tissue plotted against the malignancy continuum. Samples are colored based on if they are from different disease stage.
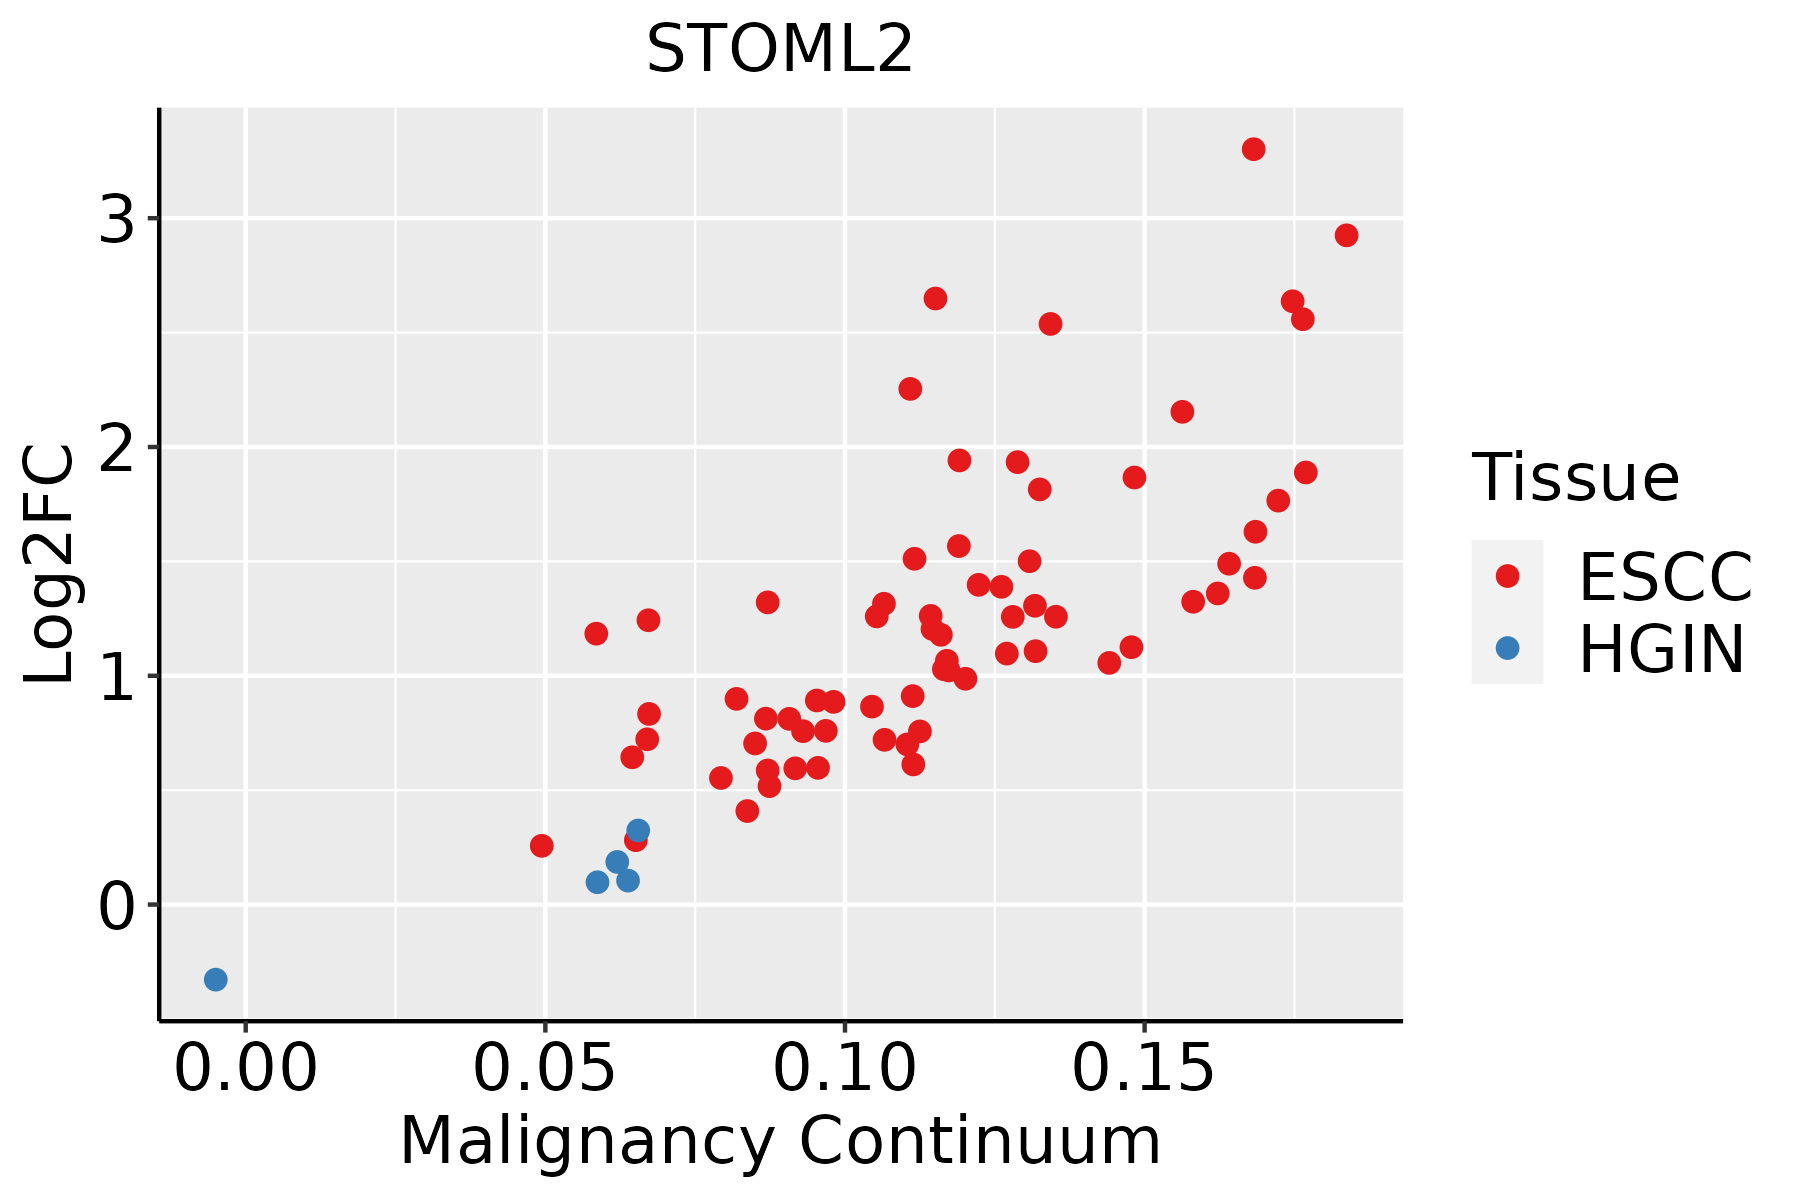
ESCC: Esophageal squamous cell carcinoma
HGIN: High-grade intraepithelial neoplasias
LGIN: Low-grade intraepithelial neoplasias
LiverThe image shows the transcriptomic changes along malignancy continuum.log2FC in expression of this searched gene in stem-like cells from each diseased tissue sample relative to stem-like cells in normal samples in each tissue plotted against the malignancy continuum. Samples are colored based on if they are from different disease stage.
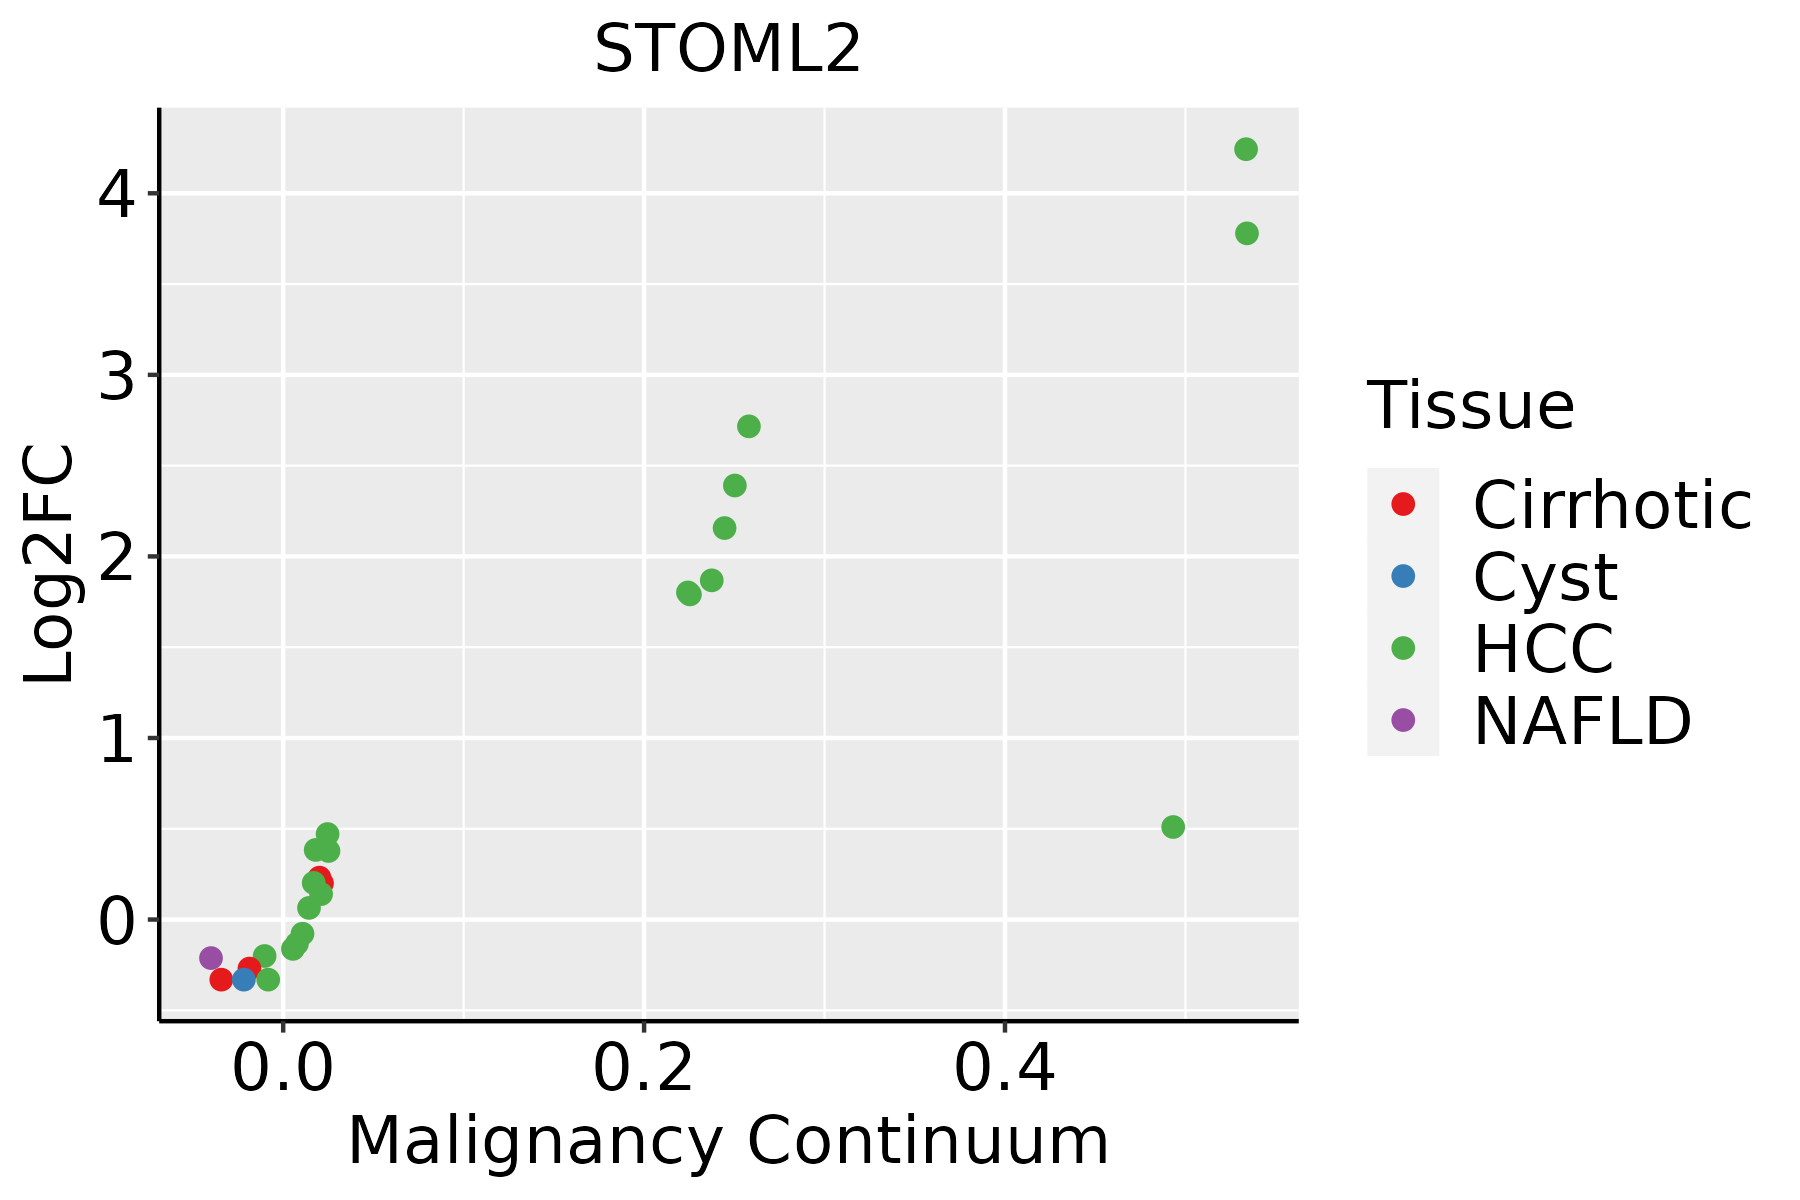
HCC: Hepatocellular carcinoma
NAFLD: Non-alcoholic fatty liver disease
Oral CavityThe image shows the transcriptomic changes along malignancy continuum.log2FC in expression of this searched gene in stem-like cells from each diseased tissue sample relative to stem-like cells in normal samples in each tissue plotted against the malignancy continuum. Samples are colored based on if they are from different disease stage.
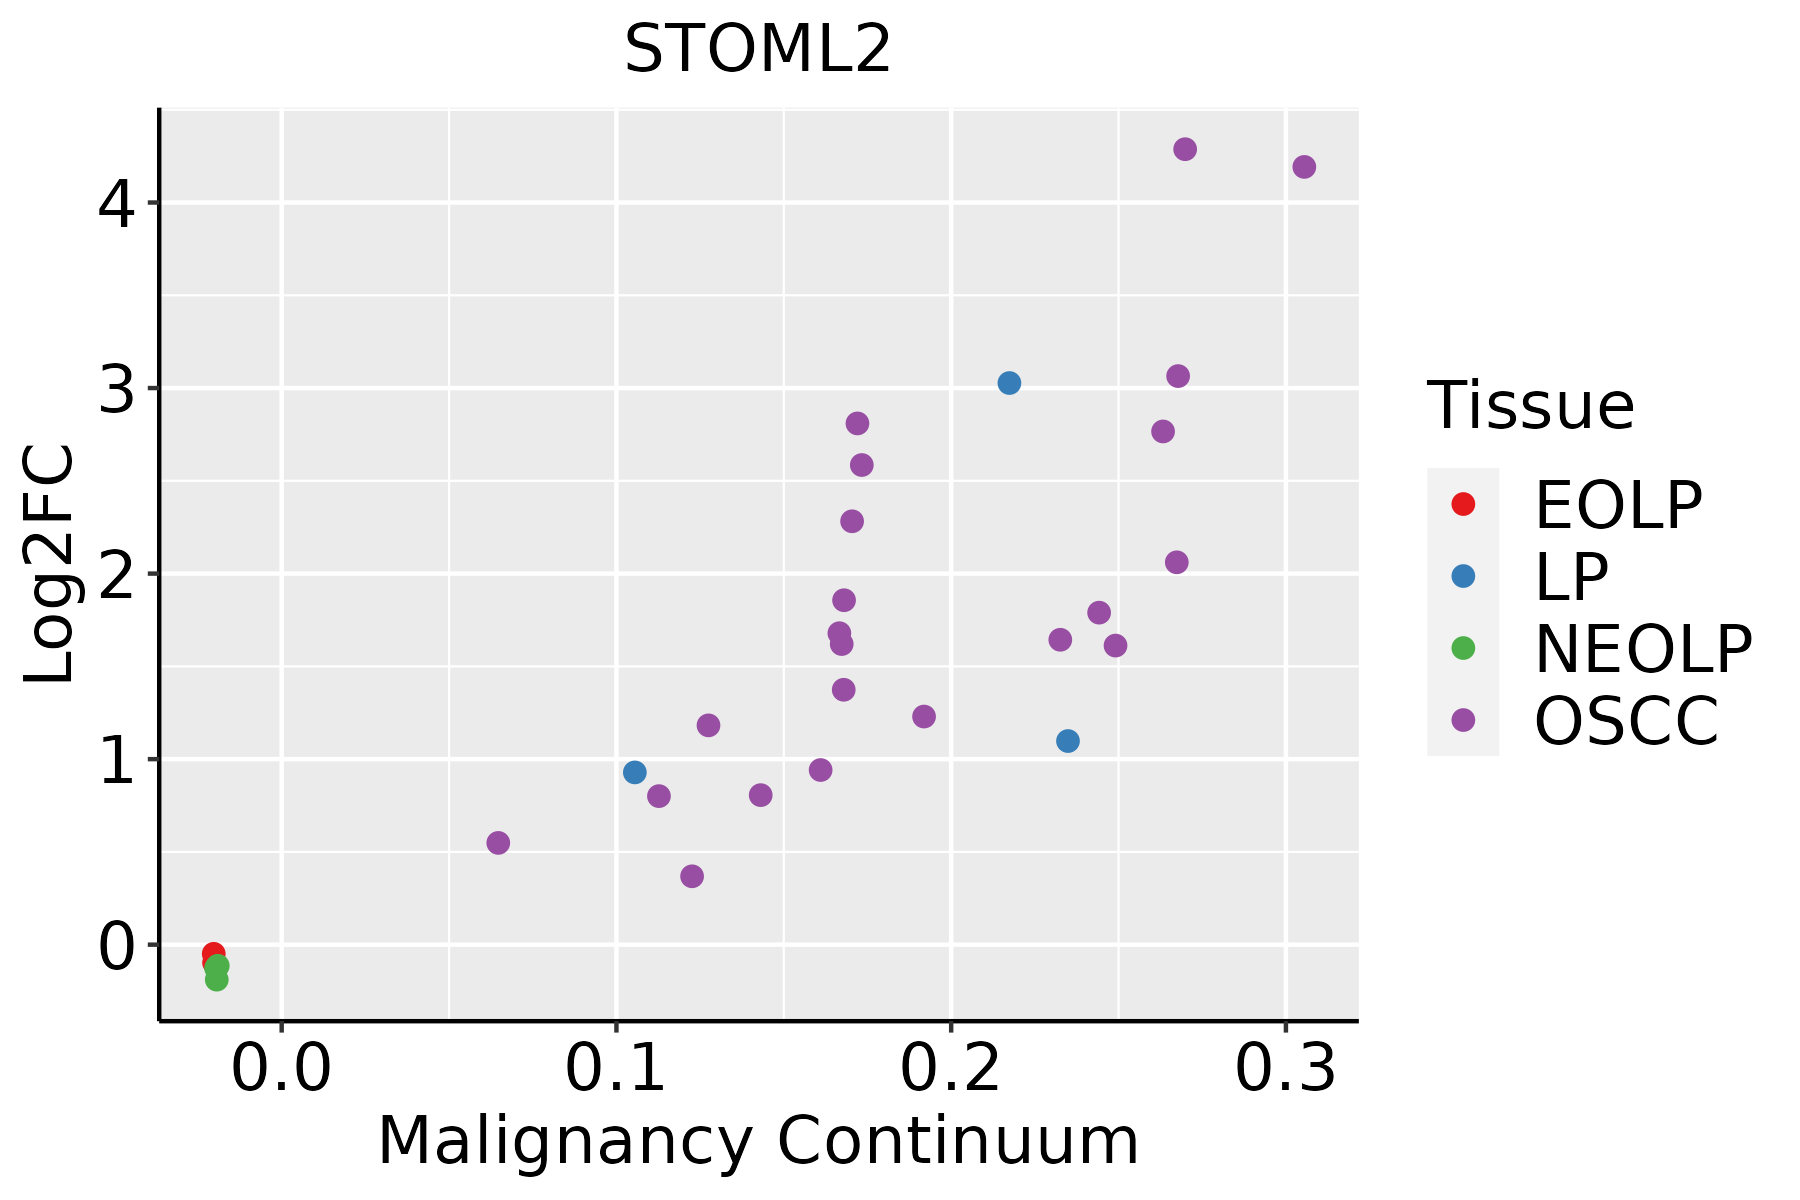
EOLP: Erosive Oral lichen planus
LP: leukoplakia
NEOLP: Non-erosive oral lichen planus
OSCC: Oral squamous cell carcinoma
ProstateThe image shows the transcriptomic changes along malignancy continuum.log2FC in expression of this searched gene in stem-like cells from each diseased tissue sample relative to stem-like cells in normal samples in each tissue plotted against the malignancy continuum. Samples are colored based on if they are from different disease stage.
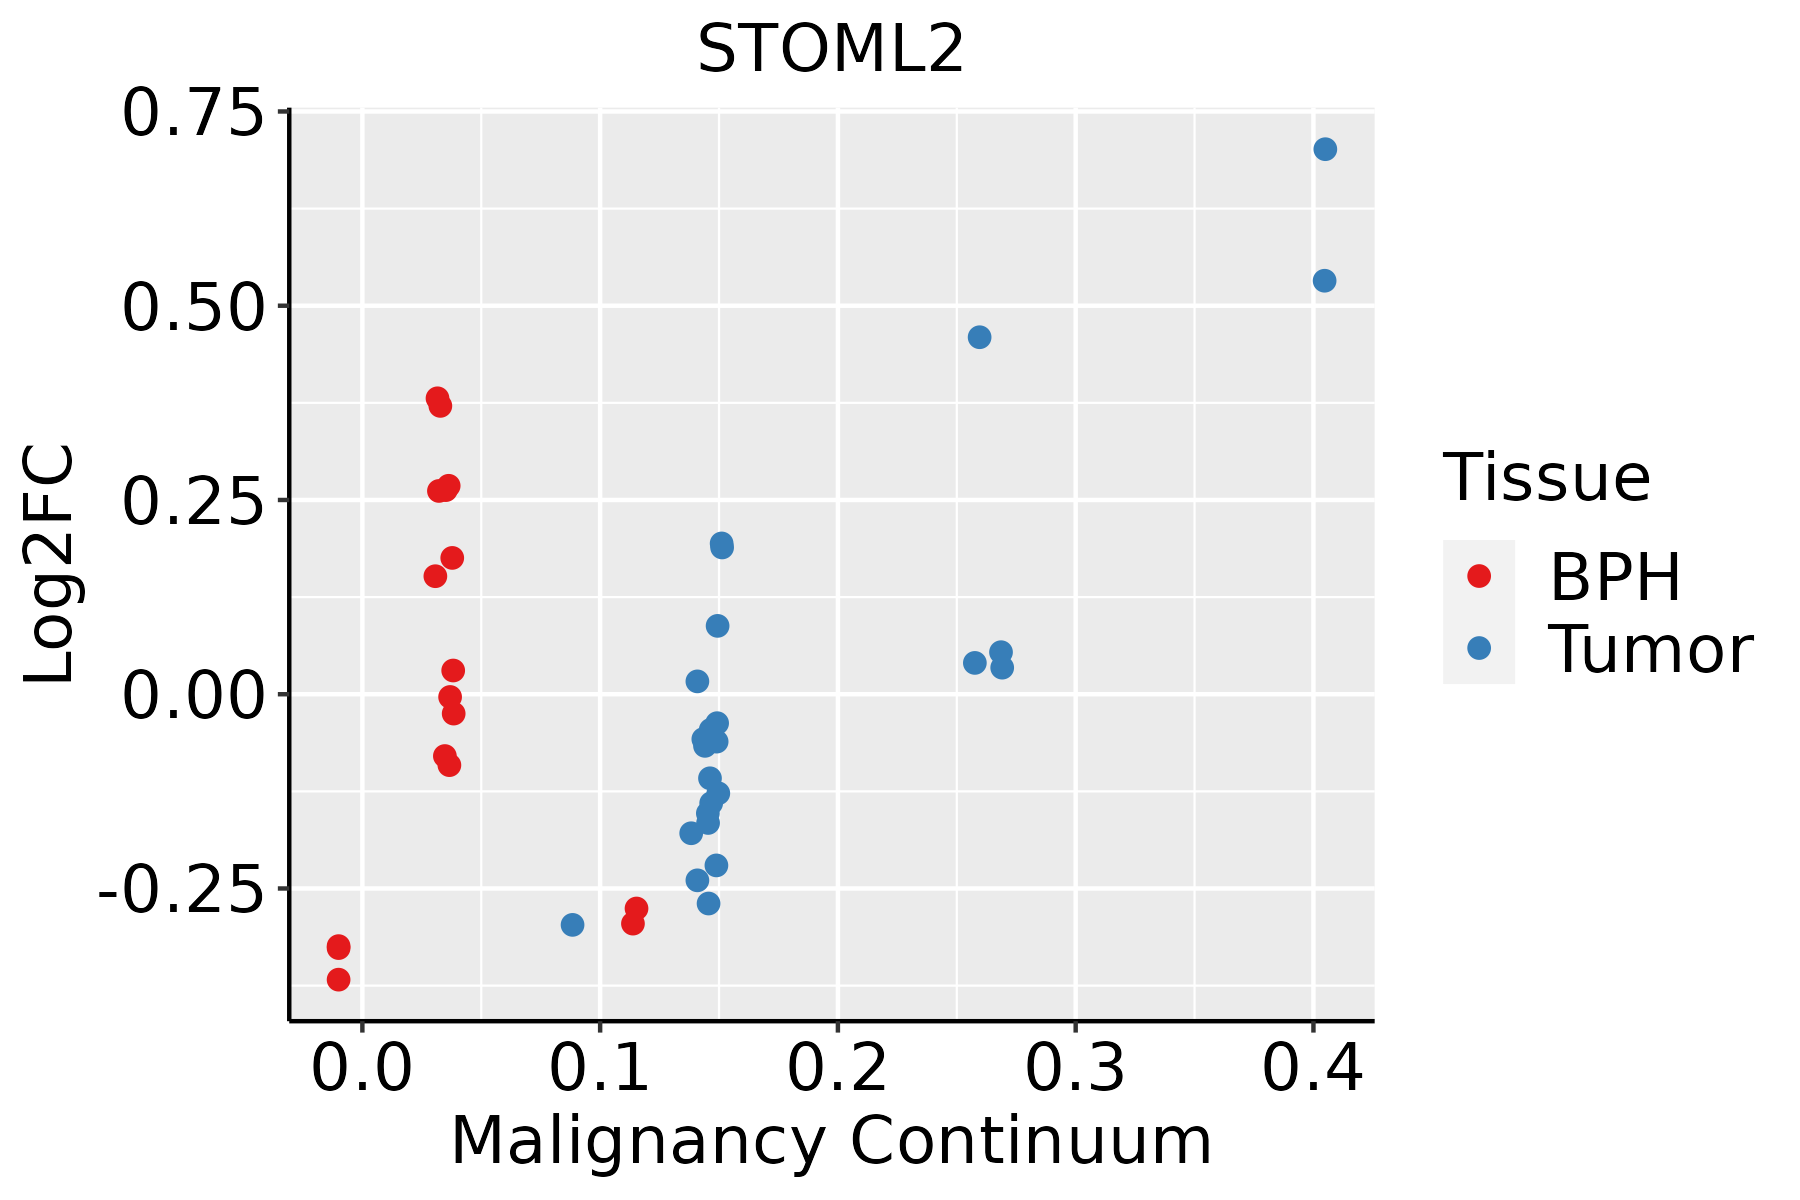
BPH: Benign Prostatic Hyperplasia
SkinThe image shows the transcriptomic changes along malignancy continuum.log2FC in expression of this searched gene in stem-like cells from each diseased tissue sample relative to stem-like cells in normal samples in each tissue plotted against the malignancy continuum. Samples are colored based on if they are from different disease stage.
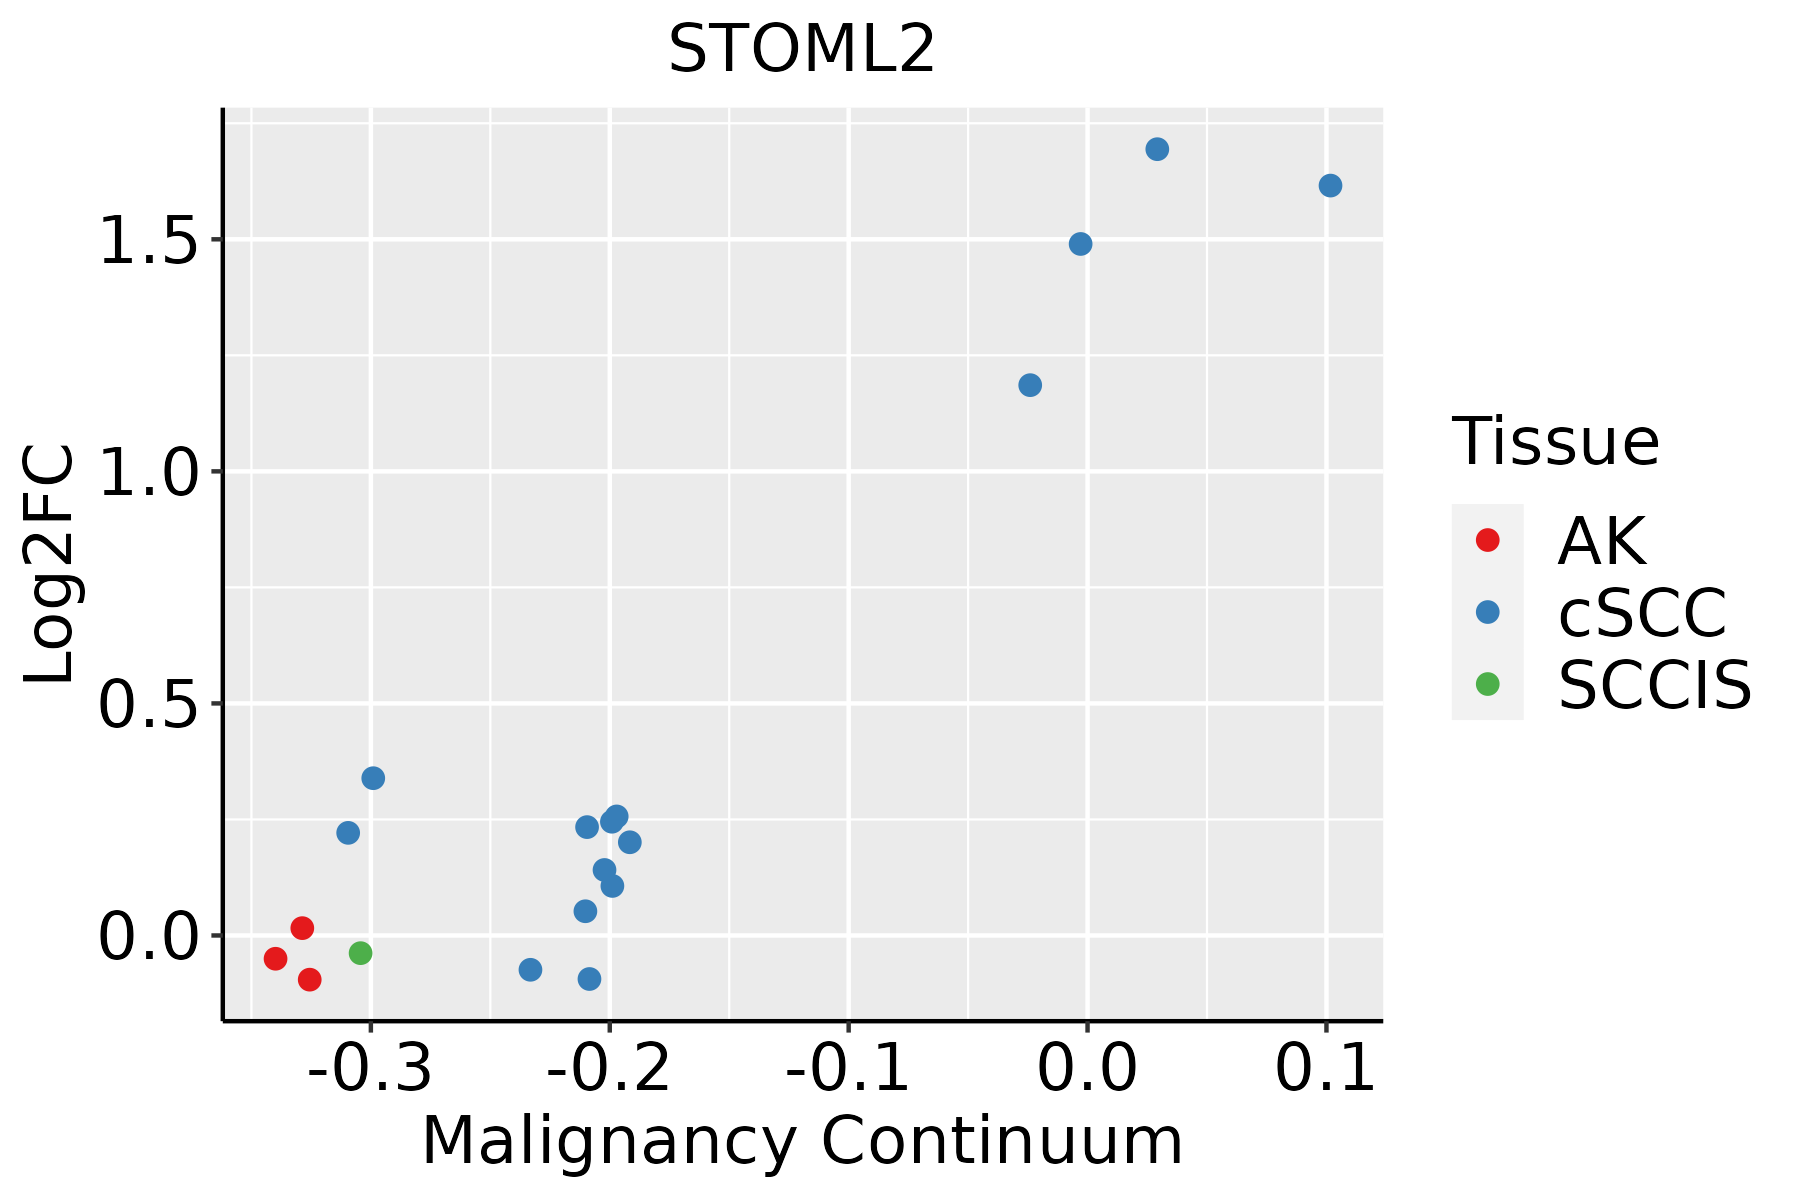
AK: Actinic keratosis
cSCC: Cutaneous squamous cell carcinoma
SCCIS:squamous cell carcinoma in situ
ThyroidThe image shows the transcriptomic changes along malignancy continuum.log2FC in expression of this searched gene in stem-like cells from each diseased tissue sample relative to stem-like cells in normal samples in each tissue plotted against the malignancy continuum. Samples are colored based on if they are from different disease stage.ATC: Anaplastic thyroid cancer
HT: Hashimoto's thyroiditis
PTC: Papillary thyroid cancer
∗log2FC in expression of this searched gene in stem-like cells from each diseased tissue sample relative to stem-like cells in normal samples in each tissue plotted against the malignancy continuum. Samples are colored based on if they are from different disease stage.

Top

Malignant transformation related pathway analysis

check buttonFind out the enriched GO biological processes and KEGG pathways involved in transition from healthy to precancer to cancer
check button Figure of enriched GO biological processes.
TissueDisease StageEnriched GO biological Processes
ColorectumADGO analysis - Figure of enriched GO biological processes: Top 15 enriched GO BP terms are showed in the bar plot of each disease state in each tissue. Each row represents a significant GO biological process which is colored according to the -log10(p.adjust).
ColorectumSERGO analysis - Figure of enriched GO biological processes: Top 15 enriched GO BP terms are showed in the bar plot of each disease state in each tissue. Each row represents a significant GO biological process which is colored according to the -log10(p.adjust).
ColorectumMSSGO analysis - Figure of enriched GO biological processes: Top 15 enriched GO BP terms are showed in the bar plot of each disease state in each tissue. Each row represents a significant GO biological process which is colored according to the -log10(p.adjust).
ColorectumMSI-HGO analysis - Figure of enriched GO biological processes: Top 15 enriched GO BP terms are showed in the bar plot of each disease state in each tissue. Each row represents a significant GO biological process which is colored according to the -log10(p.adjust).
ColorectumFAPGO analysis - Figure of enriched GO biological processes: Top 15 enriched GO BP terms are showed in the bar plot of each disease state in each tissue. Each row represents a significant GO biological process which is colored according to the -log10(p.adjust).
∗Top 15 enriched GO BP terms are showed in the bar plot of each disease state in each tissue. Each row represents a significant GO biological process which is colored according to the -log10(p.adjust).
Page: 1 2 3 4 5 6 7 8 9 

check button Enriched GO biological processes.
GO IDTissueDisease StageDescriptionGene RatioBg Ratiopvaluep.adjustCount
GO:19012936EndometriumEECnucleoside phosphate biosynthetic process43/2168256/187237.79e-034.34e-0243
GO:0006091110EsophagusESCCgeneration of precursor metabolites and energy331/8552490/187233.86e-238.45e-21331
GO:0045333110EsophagusESCCcellular respiration173/8552230/187234.53e-205.99e-18173
GO:0006839110EsophagusESCCmitochondrial transport187/8552254/187238.35e-209.81e-18187
GO:0009060110EsophagusESCCaerobic respiration145/8552189/187232.16e-182.21e-16145
GO:0015980110EsophagusESCCenergy derivation by oxidation of organic compounds220/8552318/187231.20e-171.09e-15220
GO:00062604EsophagusESCCDNA replication181/8552260/187233.55e-152.05e-13181
GO:0046034111EsophagusESCCATP metabolic process189/8552277/187231.99e-141.04e-12189
GO:0006119111EsophagusESCCoxidative phosphorylation106/8552141/187238.19e-133.63e-11106
GO:005160418EsophagusESCCprotein maturation189/8552294/187237.64e-112.39e-09189
GO:0006753110EsophagusESCCnucleoside phosphate metabolic process288/8552497/187231.80e-083.50e-07288
GO:0019693111EsophagusESCCribose phosphate metabolic process234/8552396/187234.24e-087.76e-07234
GO:0009117111EsophagusESCCnucleotide metabolic process282/8552489/187234.70e-088.50e-07282
GO:0009141111EsophagusESCCnucleoside triphosphate metabolic process78/8552112/187232.36e-073.59e-0678
GO:00062612EsophagusESCCDNA-dependent DNA replication100/8552151/187232.61e-073.94e-06100
GO:1990542110EsophagusESCCmitochondrial transmembrane transport72/8552102/187232.94e-074.23e-0672
GO:00482844EsophagusESCCorganelle fusion94/8552141/187233.72e-075.16e-0694
GO:0009259111EsophagusESCCribonucleotide metabolic process224/8552385/187234.41e-076.00e-06224
GO:0072521111EsophagusESCCpurine-containing compound metabolic process238/8552416/187231.20e-061.49e-05238
GO:0009150111EsophagusESCCpurine ribonucleotide metabolic process213/8552368/187231.40e-061.69e-05213
Page: 1 2 3 4 5 6 7 8 9 10 11 12 13 14 15 16 17 18 19 20 21 22 23 24 25 26 27 28 29 30 31 32 33 34 35 36 37 38 39 40 

check button Enriched KEGG pathways.
Pathway IDTissueDisease StageDescriptionGene RatioBg Ratiopvaluep.adjustqvalueCount
Page: 1 

Top

Cell-cell communication analysis

check buttonIdentification of potential cell-cell interactions between two cell types and their ligand-receptor pairs for different disease states
LigandReceptorLRpairPathwayTissueDisease Stage
Page: 1 

Top

Single-cell gene regulatory network inference analysis

check buttonFind out the significant the regulons (TFs) and the target genes of each regulon across cell types for different disease states
TFCell TypeTissueDisease StageTarget GeneRSSRegulon Activity
∗The dot plots of a searched regulon are shown for all cell subpopulations in each disease state of each tissue based on the regulon specific score inferred using pySCENIC and by calculating the average expression.
Page: 1 

Top

Somatic mutation of malignant transformation related genes

check buttonAnnotation of somatic variants for genes involved in malignant transformation
Hugo SymbolVariant ClassVariant ClassificationdbSNP RSHGVScHGVSpHGVSp ShortSWISSPROTBIOTYPESIFTPolyPhenTumor Sample BarcodeTissueHistologySexAgeStageTherapy TypesDrugsOutcome
STOML2insertionIn_Frame_Insnovelc.869_870insTGGGGAp.Ala290_Lys291insGlyAspp.A290_K291insGDQ9UJZ1protein_codingTCGA-BH-A0H7-01Breastbreast invasive carcinomaFemale>=65III/IVChemotherapydoxorubicinSD
STOML2insertionIn_Frame_Insnovelc.868_869insAGCTGGGCTTGGCCAGGGAGTp.Ala290delinsGluLeuGlyLeuAlaArgGluSerp.A290delinsELGLARESQ9UJZ1protein_codingTCGA-BH-A0H7-01Breastbreast invasive carcinomaFemale>=65III/IVChemotherapydoxorubicinSD
STOML2SNVMissense_Mutationrs763483882c.215G>Ap.Arg72Glnp.R72QQ9UJZ1protein_codingtolerated(0.09)benign(0.094)TCGA-EA-A3HS-01Cervixcervical & endocervical cancerFemale<65I/IIUnknownUnknownSD
STOML2SNVMissense_Mutationrs753222022c.511N>Tp.Arg171Cysp.R171CQ9UJZ1protein_codingdeleterious(0.01)possibly_damaging(0.892)TCGA-AA-3966-01Colorectumcolon adenocarcinomaFemale>=65I/IIUnknownUnknownSD
STOML2SNVMissense_Mutationrs201944176c.776G>Ap.Arg259Glnp.R259QQ9UJZ1protein_codingtolerated(0.48)benign(0.003)TCGA-AA-A00N-01Colorectumcolon adenocarcinomaMale>=65I/IIUnknownUnknownPD
STOML2SNVMissense_Mutationc.1062G>Tp.Lys354Asnp.K354NQ9UJZ1protein_codingdeleterious_low_confidence(0.01)benign(0.003)TCGA-G4-6303-01Colorectumcolon adenocarcinomaFemale<65III/IVChemotherapy5-fuPD
STOML2SNVMissense_Mutationc.445N>Ap.Glu149Lysp.E149KQ9UJZ1protein_codingdeleterious(0)probably_damaging(0.997)TCGA-G4-6304-01Colorectumcolon adenocarcinomaFemale>=65I/IIChemotherapyfluorouracilPD
STOML2SNVMissense_Mutationnovelc.628N>Tp.Thr210Serp.T210SQ9UJZ1protein_codingtolerated(0.36)benign(0.098)TCGA-A5-A0G2-01Endometriumuterine corpus endometrioid carcinomaFemale<65III/IVUnknownUnknownSD
STOML2SNVMissense_Mutationrs781632715c.512N>Ap.Arg171Hisp.R171HQ9UJZ1protein_codingtolerated(0.1)possibly_damaging(0.806)TCGA-AJ-A3EK-01Endometriumuterine corpus endometrioid carcinomaFemale<65I/IIChemotherapycarboplatinCR
STOML2SNVMissense_Mutationrs201944176c.776N>Ap.Arg259Glnp.R259QQ9UJZ1protein_codingtolerated(0.48)benign(0.003)TCGA-AJ-A5DW-01Endometriumuterine corpus endometrioid carcinomaFemale<65I/IIUnknownUnknownSD
Page: 1 2 3 4 

Top

Related drugs of malignant transformation related genes

check buttonIdentification of chemicals and drugs interact with genes involved in malignant transfromation
(DGIdb 4.0)
Entrez IDSymbolCategoryInteraction TypesDrug Claim NameDrug NamePMIDs
Page: 1